
The Fed dot plot is a chart of where each Federal Reserve policymaker thinks the federal funds rate should sit at the end of each year. This guide settles three things: how to read one, how far it has missed, and whether a dot plot meeting moves currencies more than a Fed meeting without dots. In short, a year-ahead median has missed by as much as 3.475 points. And on daily bars, a dot plot day was no bigger than other Fed days: 1.26 against 1.25 ATR on six USD pairs.
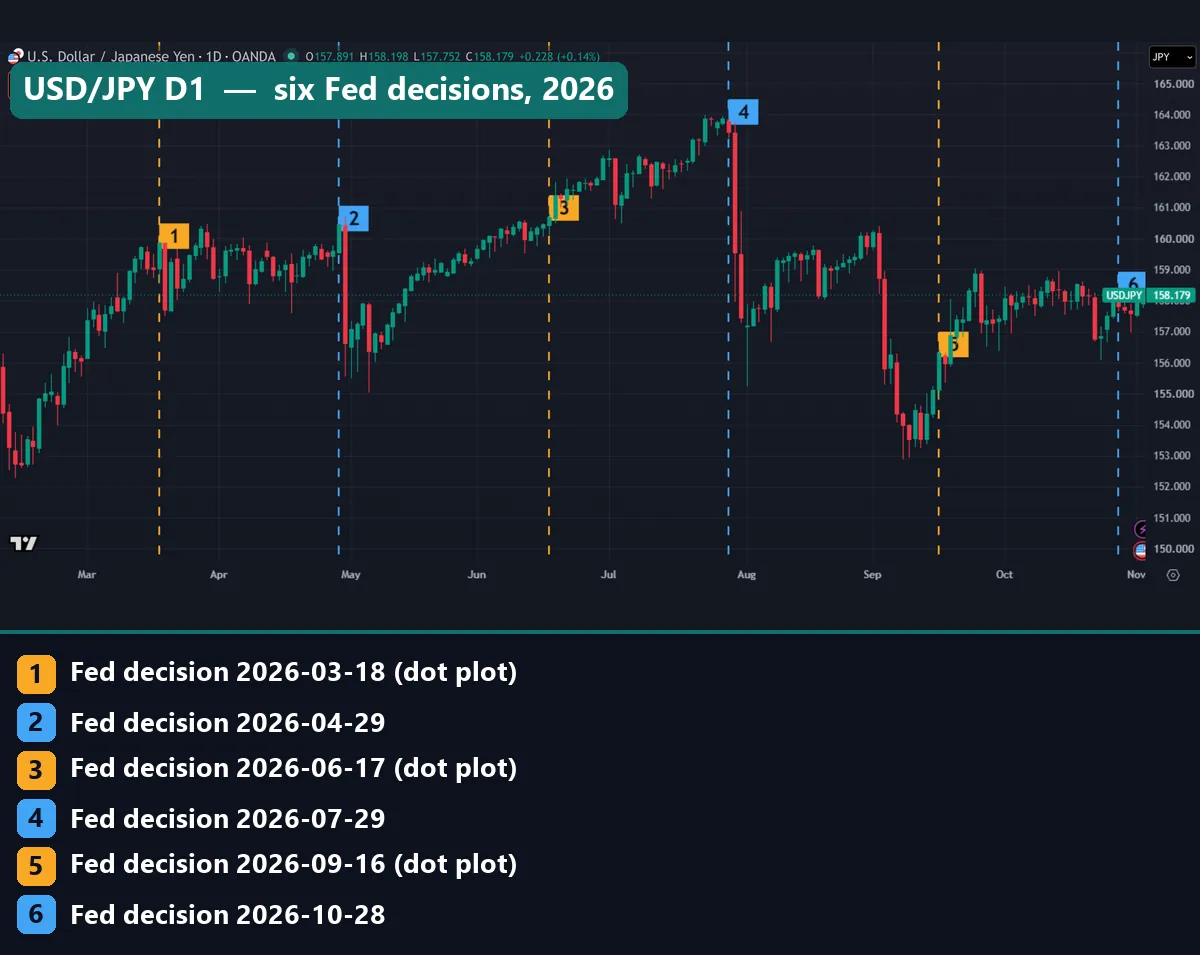
This chart marks the last six Fed decisions on USD/JPY. Gold lines carry a dot plot, and blue lines do not. The longest red candle in view comes one bar after blue line 2, on 29 April, and two more long ones follow blue line 4, on 29 July. A sharp drop in early September sits on no line at all.
What the Fed dot plot actually is
The dot plot is Figure 2 in the Summary of Economic Projections, or SEP. The Fed publishes an SEP at four of its eight scheduled meetings each year: March, June, September and December. Our FOMC meeting guide lists the 2026 dates and what else lands on those days.
Each dot is one person’s judgment. The September 2026 projection tables at the Federal Reserve describe a dot as one participant’s view of the appropriate rate at the end of a given year, or over the longer run. Those tables print no names, so a reader cannot tell whose dot is whose.
The San Francisco Fed economic letter on disagreement in the dot plot dates the rate path to 2012. Also, a participant does not need a vote. The committee has 12 voters, yet the September tables count 18 participants.
What the dot plot is not
It is not an official forecast. Brookings’ article on replacing the dot plot with scenarios says the dots do not represent the committee’s consensus or an official forecast. The policy statement holds the decision, and the dots are separate views printed beside it.
It is not a promise either. The Fed says each projection rests on information available at the time of the meeting, and the Chicago Fed letter on how markets react to the dot plot calls the dots conditional assessments, not firm commitments. So a new inflation or jobs report can change a view well before the next chart. Our guide to hawkish vs dovish language covers the words that travel with the dots.
It is also not a market price. A dot shows what one official thinks is right, while a futures curve shows what traders will pay.
How the dots are built
The Fed targets a range, not a single rate. So each dot shows a midpoint, and the median comes from sorting the dots in a column. Two formulas cover it:
midpoint = (lower limit + upper limit) / 2
median   = the middle dot, or the average of the two middle dots
Take the current range of 3.75% to 4.00%. Its midpoint is 3.875. The Fed rounds each dot to the nearest 1/8 of a point, which is why you see values such as 4.125 and 4.375. It then prints the median to one decimal, so 4.125 appears as 4.1.
A new chart moves prices mainly through surprise, because traders already hold a view of the likely path. The Chicago Fed letter tested this on SEP releases from September 2015 to June 2026. A median 25 basis points above expectations lifted market pricing by only about 5 basis points on the day, and expectations kept moving toward the surprise over later quarters. (One basis point is a hundredth of a percentage point.) From there, the chain runs through how interest rates affect forex.
How we tested the dot plot against price
We took the Fed’s numbers from federalreserve.gov: SEP medians, Figure 2 dot counts and the target range history. Then we measured price on two platforms.
MetaTrader 4, build 1471. We used Capital Point Trading history: daily bars on 23 pairs from 12 June 2018 to 24 August 2026, and M15 bars on seven symbols from June 2025 to August 2026. That terminal has been offline since late August 2026, so these windows end there and miss the 16 September dots. The headline figures use six USD pairs: EURUSD, GBPUSD, AUDUSD, USDJPY, USDCHF and USDCAD. Our list holds 34 dot plot meetings and 35 others.
TradingView web chart. We pulled daily bars for EURUSD, USDJPY and the US 10-year yield on 3 November 2026, from 1 January 2018 onward: 34 dot plot days, 36 other meeting days and about 390 other Wednesdays. Our captures use the same chart, with gold lines on dot plot meetings and blue lines on the rest.
We sized each day’s high-to-low range in units of the previous day’s ATR(14), so pairs and years compare fairly. The M15 figure divides a bar’s median range on meeting days by the same New York bar on other Wednesdays. All figures come before spread, swap and commission, and none is a trading result. Our editorial testing policy explains how we choose and report tests.
The parts of a dot plot, in one table
This table reads the 16 September 2026 chart part by part.
| Part | What it means | 16 September 2026 |
|---|---|---|
| Dot | One participant’s judgment, rounded to 1/8 of a point | 18 dots for 2026 |
| Column | The end of a calendar year, or the longer run | 2026 to 2029, longer run |
| Height | Midpoint of the target range, in percent | 2.875 to 4.375 |
| Median | Middle of a column, printed to one decimal | 4.1, 4.1, 3.9, 3.6, 3.2 |
| Longer run | Where a participant expects the rate to settle, absent new shocks | 3.2 median |
| Current range | Where policy stands now, shown for comparison | 3.75 to 4.00 |
| Next chart | The next meeting with projections | 8-9 December 2026 |
One detail catches readers out. The 2028 and 2029 columns hold 17 dots, not 18, because the Fed’s note says one participant did not submit those years.
Reading Fed days on a price chart
A dot plot has no price on it, so you mark meeting days on a chart yourself. Lines 1, 3 and 5 carry dots: 18 March, 17 June and 16 September. Lines 2, 4 and 6 do not: 29 April, 29 July and 28 October.
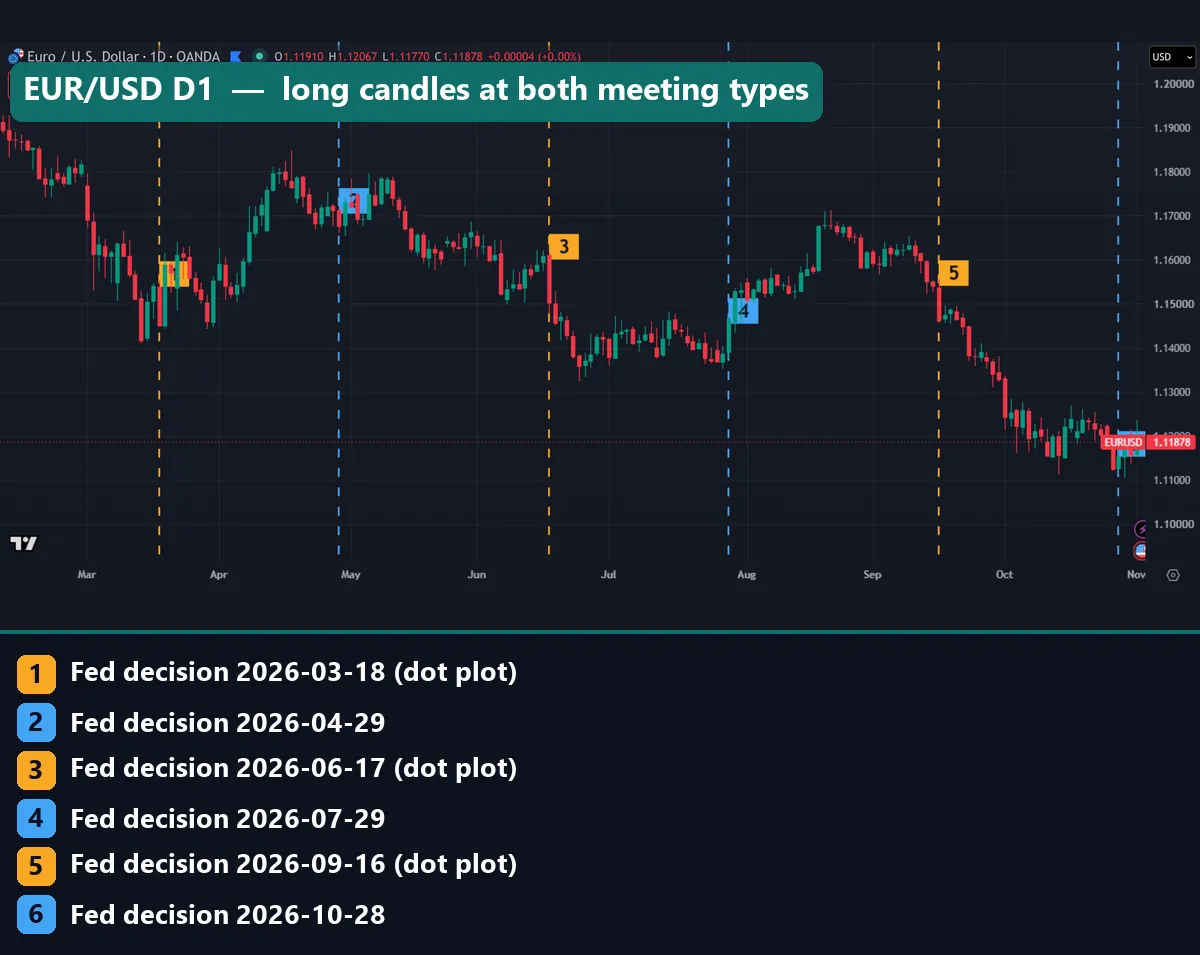
On EUR/USD, line 3 sits on a long red candle, from above 1.16000 to about 1.15000. Line 5 sits on another long red candle. But blue line 4 has a long green candle about the size of that second one. So long candles landed on both kinds of meeting, in both directions.
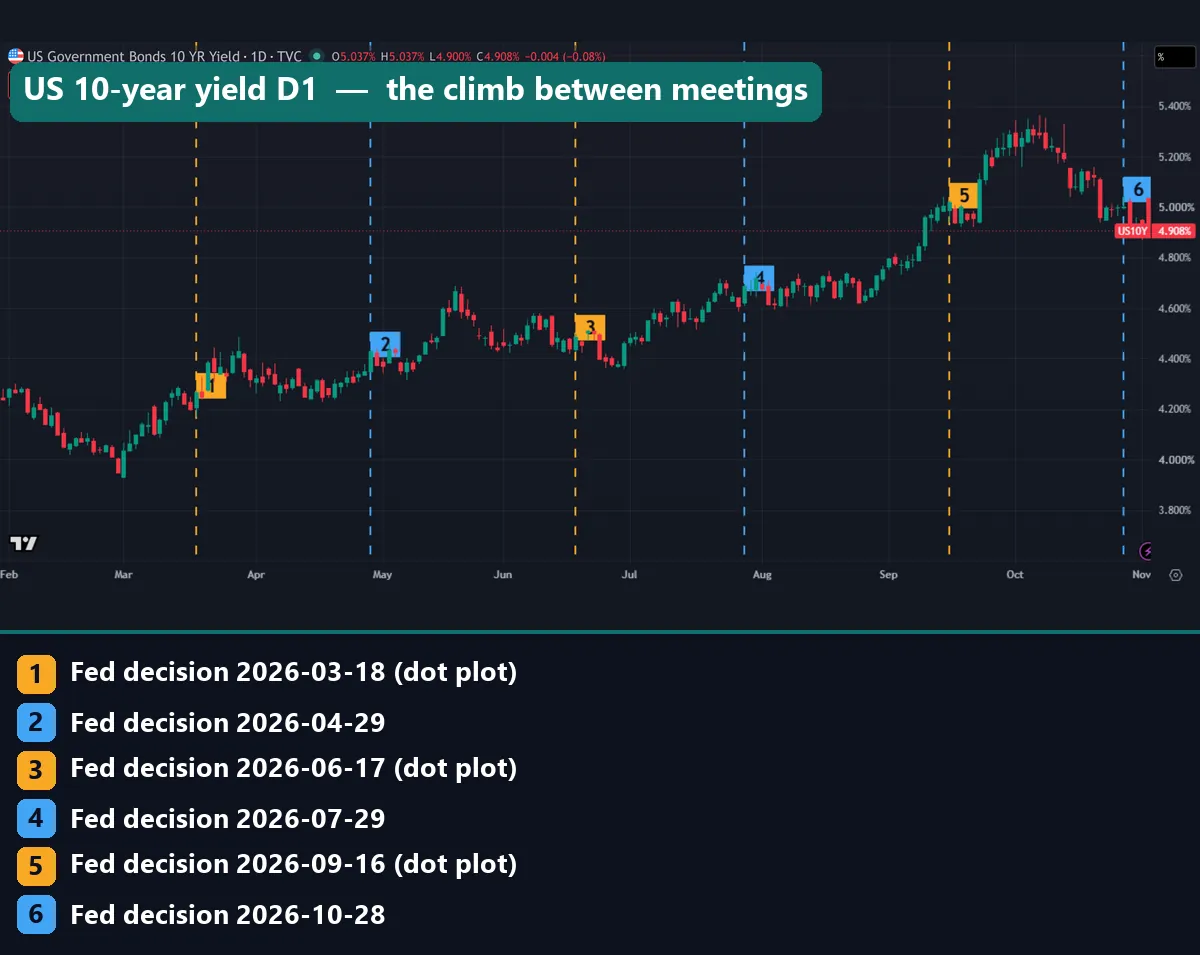
The 10-year yield tells a slower story. It climbs from around 4.3% at line 1 to around 5% at line 5, then tops 5.3% in October before the last close of 4.908%. Yet the candle on line 5 is small, and the long green candle comes five bars later. Our page on bond yields and forex explains why that climb still matters to currencies.
So read a meeting day in three steps. First, find the line. Next, compare its candle with the one after it, because the 14:00 statement leaves only three hours before the daily bar closes at 17:00 New York. Then check our economic calendar for that week, since one daily bar holds every release of the day.
Worked example: the 16 September 2026 dots
Start with the 2026 column. It holds 18 dots: 4 at 4.375, 12 at 4.125 and 2 at 3.875. The Fed raised the range to 3.75% to 4.00% that same day, so the midpoint was 3.875.
Now subtract. Two dots sit at the midpoint, so they show no further change by year end. Twelve sit 0.25 higher, and four sit 0.50 higher. The 9th and 10th dots are both 4.125, so the Fed prints 4.1.
Then compare with June. That column also held 18 dots: 1 at 4.375, 5 at 4.125, 3 at 3.875, 8 at 3.625 and 1 at 3.375. Its 9th and 10th dots were 3.625 and 3.875, which average 3.75 and print as 3.8.
| Column | June 2026 median | September 2026 median |
|---|---|---|
| 2026 | 3.8 | 4.1 |
| 2027 | 3.6 | 4.1 |
| 2028 | 3.4 | 3.9 |
| Longer run | 3.1 | 3.2 |
Every column moved up, which traders would call a hawkish shift. Dots also age. After the 28 October hold, only 8-9 December remains this year. So a 4.125 dot now needs one quarter-point rise at that meeting, and a 4.375 dot needs a half point in one go. That is arithmetic on September’s dots, not a forecast from us.
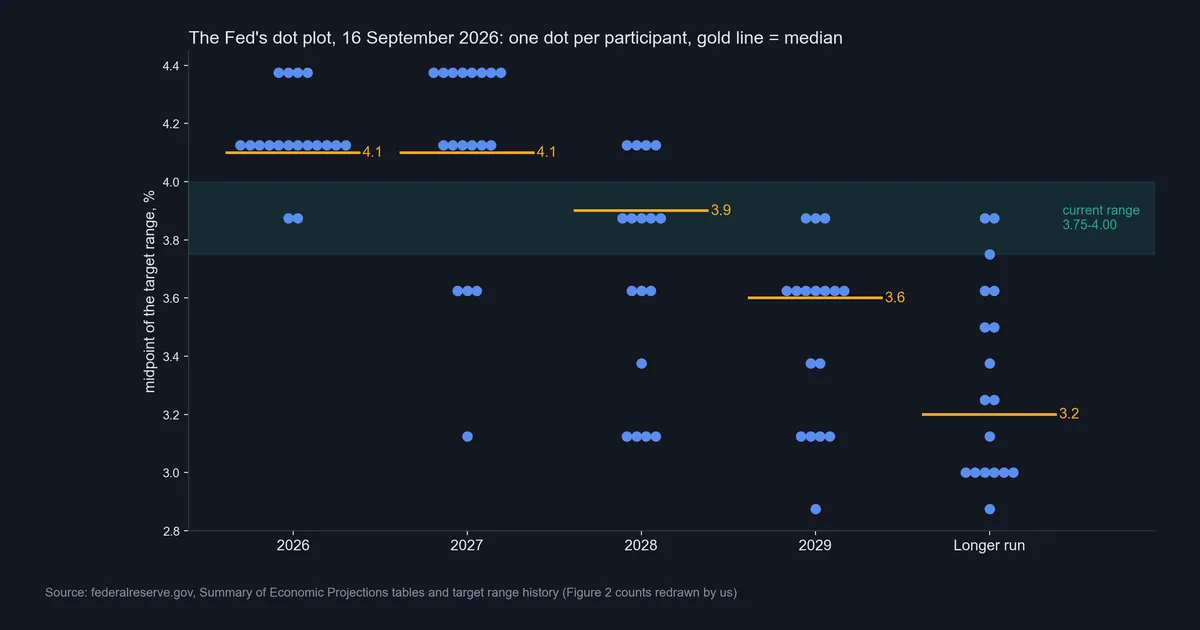
This chart is the Fed’s own Figure 2 counts, redrawn by us. We estimated no dot.
How far a year-ahead median has missed
Each December, the dots give a median for the end of the next year. We set that against where the target range really ended, using its midpoint.
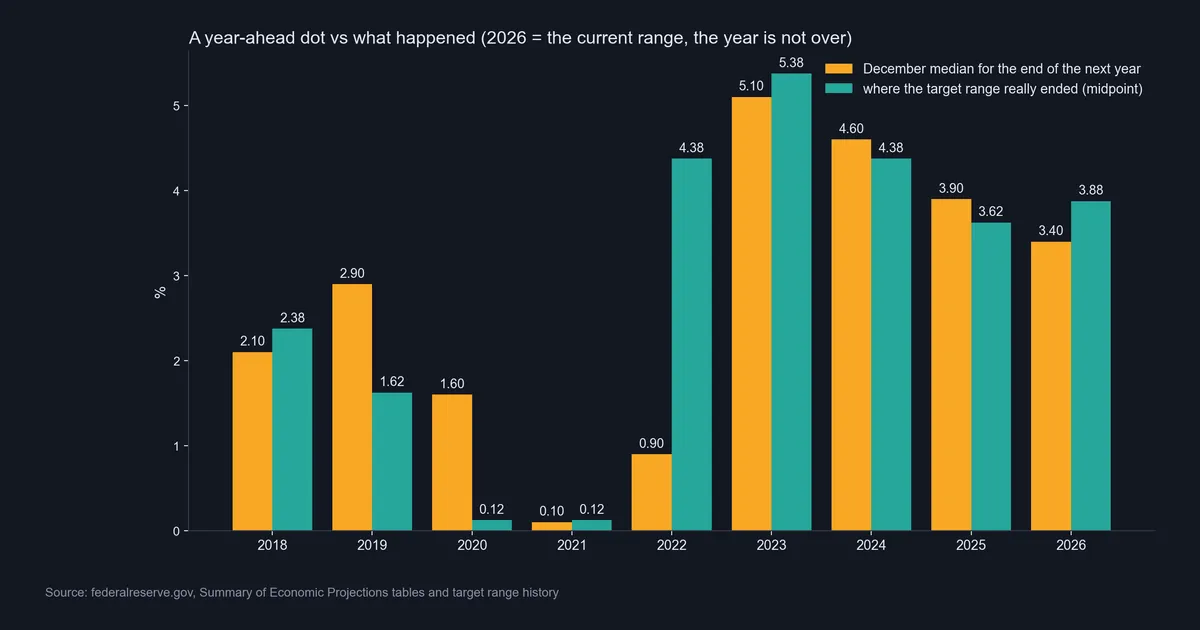
| Year end | December median | Actual midpoint | Miss, points |
|---|---|---|---|
| 2018 | 2.1 | 2.375 | +0.275 |
| 2019 | 2.9 | 1.625 | -1.275 |
| 2020 | 1.6 | 0.125 | -1.475 |
| 2021 | 0.1 | 0.125 | +0.025 |
| 2022 | 0.9 | 4.375 | +3.475 |
| 2023 | 5.1 | 5.375 | +0.275 |
| 2024 | 4.6 | 4.375 | -0.225 |
| 2025 | 3.9 | 3.625 | -0.275 |
| 2026, not finished | 3.4 | 3.875 | +0.475 |
Five of the eight finished years landed within 0.275 points. But three missed by more than a point, and we measured the size of each miss, not its cause. The median can point the wrong way too. In December 2018 the midpoint stood at 2.375 and the median for end-2019 was 2.9, yet that year ended at 1.625.
Download the complete indicator database
Put these concepts on your charts. One email unlocks the full library of 1,380+ indicators with compiled MT4 and MT5 files, plus my TradingView scripts. No paywall, no spam, unsubscribe any time.
Get free access to my indicator database
One email unlocks 1,380+ free MT4, MT5 and TradingView indicators — the complete library. No single-tool download; you get the whole database.
Where it fails: what the dots cannot tell you
The dot plot works as a snapshot of views, and it has clear limits.
It misses turns. The largest miss came from a median of 0.9 in December 2021, against 4.375 a year later.
It goes stale. A new chart comes only four times a year, and a view can change between charts.
It hides who counts. With no names, you cannot weight dots by who votes.
It gives no timing. A year-end dot does not say at which meeting a move would come.
It says little about direction. The decision day’s direction continued over five days on 55.4% of dot plot pair-days, against 42.3% with no dots. That looks like an edge. However, those 547 and 579 pair-days overlap heavily on the same meetings, so do not build a rule on it.
Our test has blind spots. We did not split meetings by how much the dots surprised traders. And our daily bars mix the dots with the statement, the press conference and any other news that day.
Is a dot plot day bigger than other Fed days?
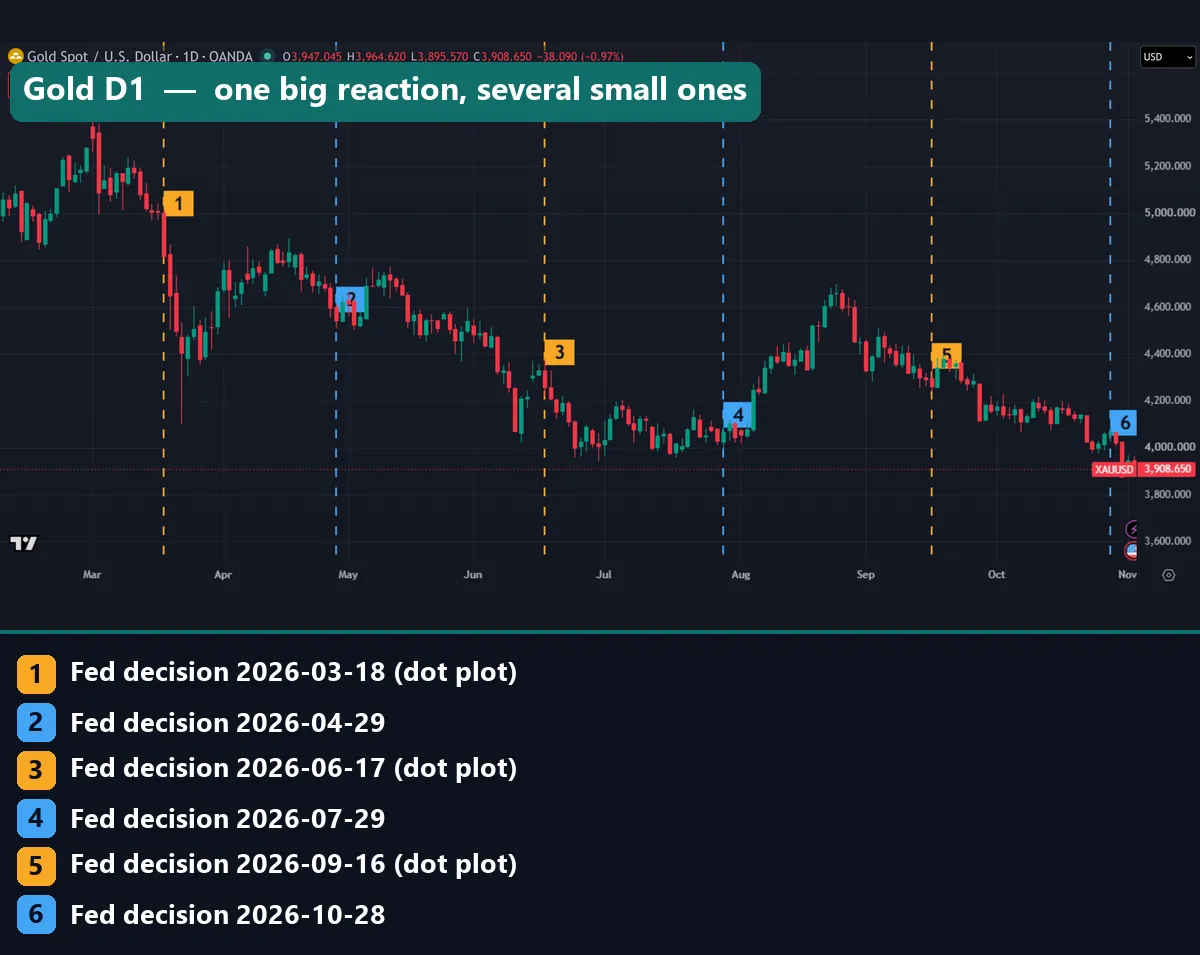
Gold shows why one chart cannot settle this. Line 1, a dot plot meeting, starts a four-bar fall from about 5,000 to about 4,400. By contrast, line 3 sits on a modest candle, and the longest candles nearby came four and five bars before it. Blue line 4 is quiet too, until a long green candle five bars later.
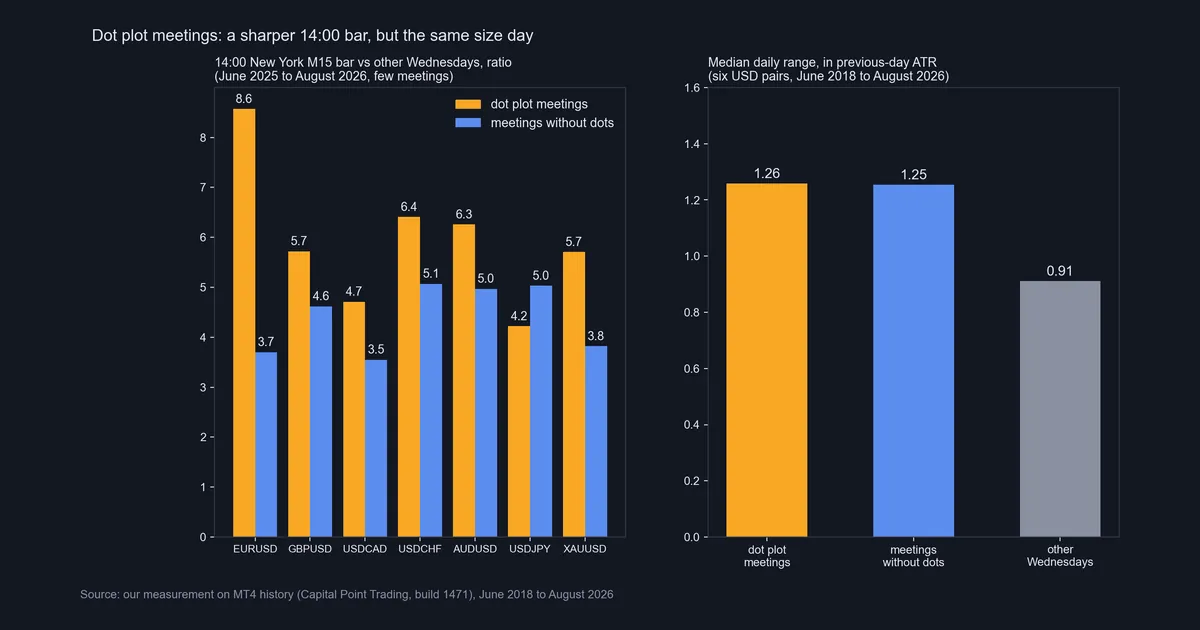
So we measured all the meetings, and the right panel gives the answer. Across six USD pairs, the median range was 1.26 previous-day ATR on dot plot days and 1.25 at meetings without dots, against 0.91 on other Wednesdays. A Fed day is bigger, but a dot plot day is not bigger than other Fed days.
Our TradingView check agrees. From 2018 on, EUR/USD ran 1.33 on dot plot days and 1.27 at other meetings, while USD/JPY ran 1.08 and 1.17, so the order flips by pair. Yields barely separated either: the 10-year’s median absolute close change was 3.75 basis points with dots, 3.7 without and 3.5 on other Wednesdays.
The 14:00 bar: sharper, on a small sample
The left panel zooms in on the statement bar. Each figure is the 14:00 New York M15 range, divided by that bar on other Wednesdays. The last column shows how few meetings sit behind each ratio.
| Symbol | Dot plot | No dots | Meetings used |
|---|---|---|---|
| EURUSD | 8.6 | 3.7 | 4 and 5 |
| GBPUSD | 5.7 | 4.6 | 3 and 4 |
| USDCAD | 4.7 | 3.5 | 4 and 5 |
| USDCHF | 6.4 | 5.1 | 4 and 5 |
| AUDUSD | 6.3 | 5.0 | 1 and 2 |
| USDJPY | 4.2 | 5.0 | 1 and 2 |
| XAUUSD | 5.7 | 3.8 | 4 and 5 |
Six of the seven symbols show a bigger 14:00 bar with dots, led by EUR/USD. But USD/JPY goes the other way. And that pair, like AUD/USD, rests on one dot plot meeting and two others, so treat those rows as anecdotes. Even the fullest rows hold only four and five meetings.
On EUR/USD the gap also shrinks by 14:30, when the press conference starts: 7.4 with dots, 6.6 without. Our page on forex news spikes covers bars like these.
Four common mistakes with the dot plot
Reading the median as a promise. A median is a snapshot of views on one date. December 2025’s 3.4 for end-2026 already sits below today’s range.
Looking only at the median. The 2026 and 2027 columns share a median of 4.1. Yet 2027 runs from 3.125 to 4.375, while 12 of the 18 dots for 2026 share one value.
Preparing only for dot plot meetings. Meetings without dots ran just as wide, at 1.25 ATR against 1.26. So plan for all eight, as you would for other high-impact news.
Reading one candle as a verdict on the dots. The statement, the dots and the press conference all land in one daily bar, and part of the reaction can spill into the next. So check an M15 chart first.
Where to go next
The Fed is one central bank among several. Our guide to central bank rate decisions compares them, and the interest rate tracker shows where policy rates stand now. For the dollar’s broad moves, see the dollar index in forex.
Data feeds the next set of dots, so our pages on CPI in forex and reading an economic calendar help between charts.
FAQ: Fed dot plot questions
What is the Fed dot plot?
It is a chart inside the Fed’s Summary of Economic Projections. Each dot shows one participant’s view of the right federal funds rate at the end of a year, or over the longer run.
How often does the Fed publish the dot plot?
Four times a year, with the March, June, September and December meetings. The next one arrives with the 8-9 December 2026 meeting.
What time does the dot plot come out?
At 14:00 New York, alongside the statement. That means 19:00 UTC on 9 December 2026, because US clocks changed on 1 November.
What do the numbers on the dot plot mean?
Each number is the midpoint of a target range, in percent. For example, a dot at 4.125 means a range of 4.00% to 4.25%.
Can you tell who placed each dot?
No. The Fed’s tables print no names and give only counts, so you cannot match a dot to a person or a vote.
How accurate is the dot plot?
We compared December medians with the next year-end range. Five of eight finished years landed within 0.275 points, but three missed by more than a point. The largest miss was 3.475 points, for 2022.
Does the dot plot move forex more than other Fed meetings?
Not at the daily level, where six USD pairs ran 1.26 ATR with dots and 1.25 without. The M15 14:00 bar looked sharper on EUR/USD, at 8.6 against 3.7, but only across four and five meetings.
Should I trade the dot plot?
That depends on your plan and your risk limits, and we make no buy or sell calls. The dots show views, not direction. If you trade a Fed day, size for the wider range and set your exit first; results are not guaranteed; past performance is not indicative of future results.
Last updated: 3 November 2026.

About the author
Written by Dominic Walsh, a Forex trader and MT4/MT5 indicator, Expert Advisor and script developer. Every tool on forexmt4systems.com is tested on live charts before release and ships with ready-to-use compiled MT4 (.ex4) and MT5 (.ex5) files. Learn more about the trader and developer behind this site.
How we build, test and correct every tool: Editorial & Testing Policy. Trading carries risk; see the disclaimer.