
An FOMC meeting is where the US Federal Reserve sets its policy interest rate, eight times a year. This guide settles three things: what the meeting is, when the 2026 decisions fall, and how much forex moves on decision day. We measured the scheduled decisions from 2018 to 2026 on 23 currency pairs in MetaTrader 4 history. In short, the six USD majors ranged about 1.4 times wider than on a normal Wednesday, and pairs without the dollar barely noticed. Direction is another matter, because the decision day’s move carried on over the next five days only 48.7% of the time.
What an FOMC meeting is
FOMC stands for Federal Open Market Committee. It sets US monetary policy, and its main tool is the target range for the federal funds rate. That rate is what banks charge each other for overnight loans.
The committee has 12 voting members. Seven sit on the Board of Governors, and the president of the New York Fed holds a fixed seat. Four of the other eleven Reserve Bank presidents fill the rest on a rotating basis, as the FOMC entry at Investopedia sets out.
Each regular meeting runs over two days, and the decision comes on the second day. The FOMC meeting calendar at the Federal Reserve lists the dates well ahead. It also states the rhythm: eight scheduled meetings a year, plus others as needed. Traders watch four parts.
- 14:00 New York: the statement, with the rate decision and the vote.
- 14:30 New York: the Chair’s press conference.
- Four meetings a year: the Summary of Economic Projections, with the dot plot. Each dot shows one official’s view of the right rate at each year’s end.
- Three weeks later: the minutes, a fuller record of the debate.
How a rate decision moves currencies
Currencies trade partly on interest rates. When US rates rise against rates abroad, holding dollars pays more, so demand for the dollar tends to grow. Our guide on how interest rates affect forex walks through that chain, and the interest rate differential page covers the gap between two countries.
But markets price the likely decision long before 14:00. So the move on the day comes from the surprise, the gap between what the committee did and what traders expected. That is why a decision that matches forecasts can still move the dollar, if the statement or the dots change the expected path of rates.
The rate itself has a formula. The New York Fed computes the effective federal funds rate as a volume-weighted median of overnight federal funds trades, as its effective federal funds rate page at the New York Fed explains. To measure the market’s reaction, we used a second formula:
day ratio = median(range / prior ATR(14)) on decision days
          / median(range / prior ATR(14)) on other Wednesdays
A ratio of 1.0 means a decision day looks like any other Wednesday. Dividing by ATR lets pairs and years with different volatility compare fairly. Our guide to ATR in trading explains the indicator.
The 2026 FOMC calendar
These dates come from the official calendar, where an asterisk marks the meetings with new projections.
| Meeting | Decision day | Dot plot |
|---|---|---|
| 27-28 January | Wednesday 28 January | No |
| 17-18 March | Wednesday 18 March | Yes |
| 28-29 April | Wednesday 29 April | No |
| 16-17 June | Wednesday 17 June | Yes |
| 28-29 July | Wednesday 29 July | No |
| 15-16 September | Wednesday 16 September | Yes |
| 27-28 October | Wednesday 28 October | No |
| 8-9 December | Wednesday 9 December | Yes |
Two meetings remain this year, on 28 October and 9 December. Mind the clock, though. On 28 October the statement lands at 18:00 UTC, but on 9 December it lands at 19:00 UTC, after US clocks change. Our forex time zone converter turns that into your broker’s server time. The committee can also act between dates, and our data includes the emergency cuts of 3 March and 15 March 2020.
How we tested
We used daily bars from MetaTrader 4, build 1471, with history from Capital Point Trading. The data covers 23 currency pairs from 12 June 2018 to 24 August 2026, and each pair starts on its own date. Decision days came from the Federal Reserve’s calendar pages: the last day of 69 scheduled meetings from January 2018 to September 2026.
Each USD major had 49 of those days in its history. Most crosses had 47 to 62, but AUDCAD had only nine and NZDCAD eight. MT4 daily bars close at 17:00 New York, so the 14:00 statement lands three hours before the bar ends.
We measured each day’s high-to-low range in units of the previous day’s ATR(14), then compared decision days with all other Wednesdays. We also checked the day after, the dot-plot meetings, the emergency cuts, and whether the day’s direction carried on for five days. For the intraday view we used M15 bars on seven symbols from mid-2025 to August 2026.
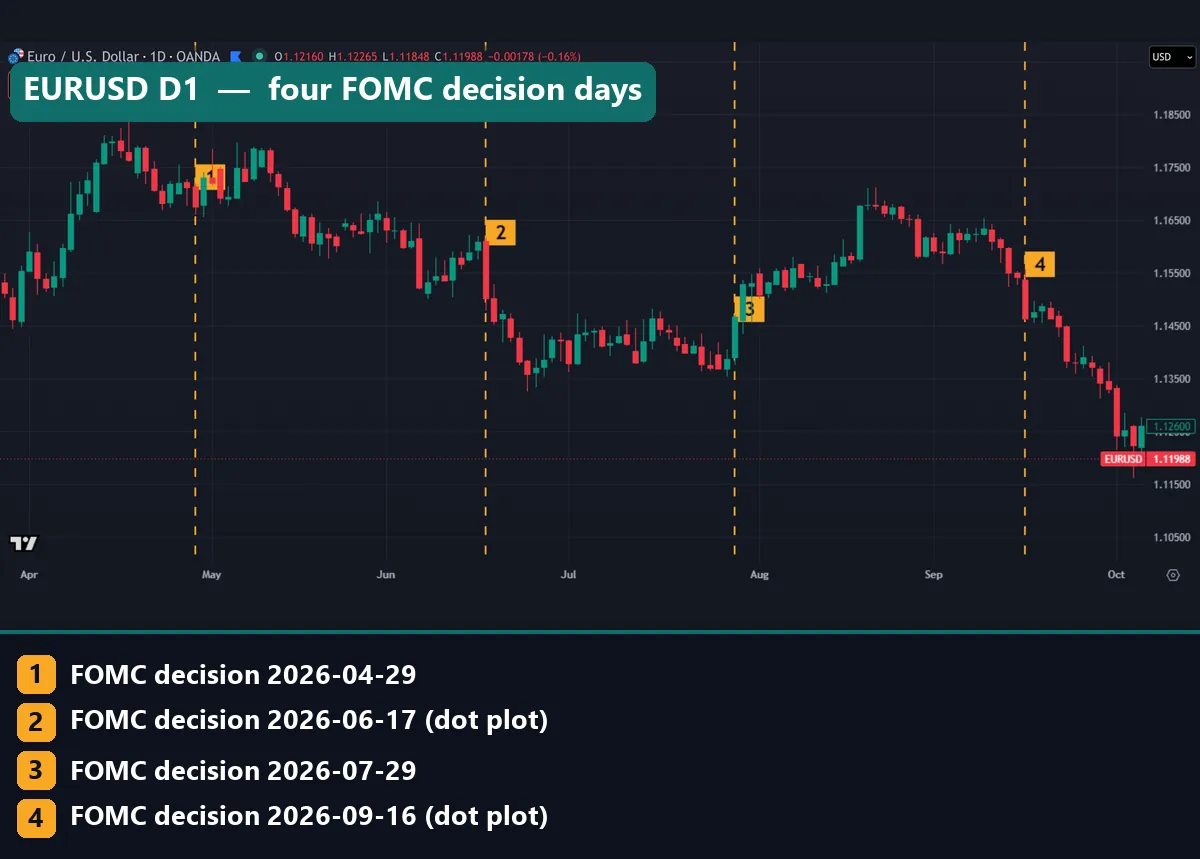
The price charts come from the TradingView web chart with OANDA daily data, captured on 23 October 2026. Gold dashed lines mark decision days from April to September 2026. Nothing here is a trading result, and any real trade would also pay spread, swap and commission. Our editorial testing policy explains how we pick and report tests.
Measurement settings
Each figure is a median, so one wild day cannot drag a result.
| Setting | Value |
|---|---|
| Data | MT4 build 1471, Capital Point Trading, 23 pairs |
| Decision day | Last day of each scheduled meeting, statement 14:00 New York |
| Range unit | High minus low, divided by the previous day’s ATR(14) |
| Baseline | All other Wednesdays |
| Extra checks | Day after, dot-plot meetings, March 2020 cuts |
| Intraday | M15 bars 13:45 to 15:00 New York vs other Wednesdays |
| M15 meetings | 9 for EURUSD, USDCAD, USDCHF, gold; 7 for GBPUSD; 3 for AUDUSD, USDJPY |
Reading a decision day on a chart
On the EURUSD chart at the top, one of the longest candles in view is the 17 June decision day itself.
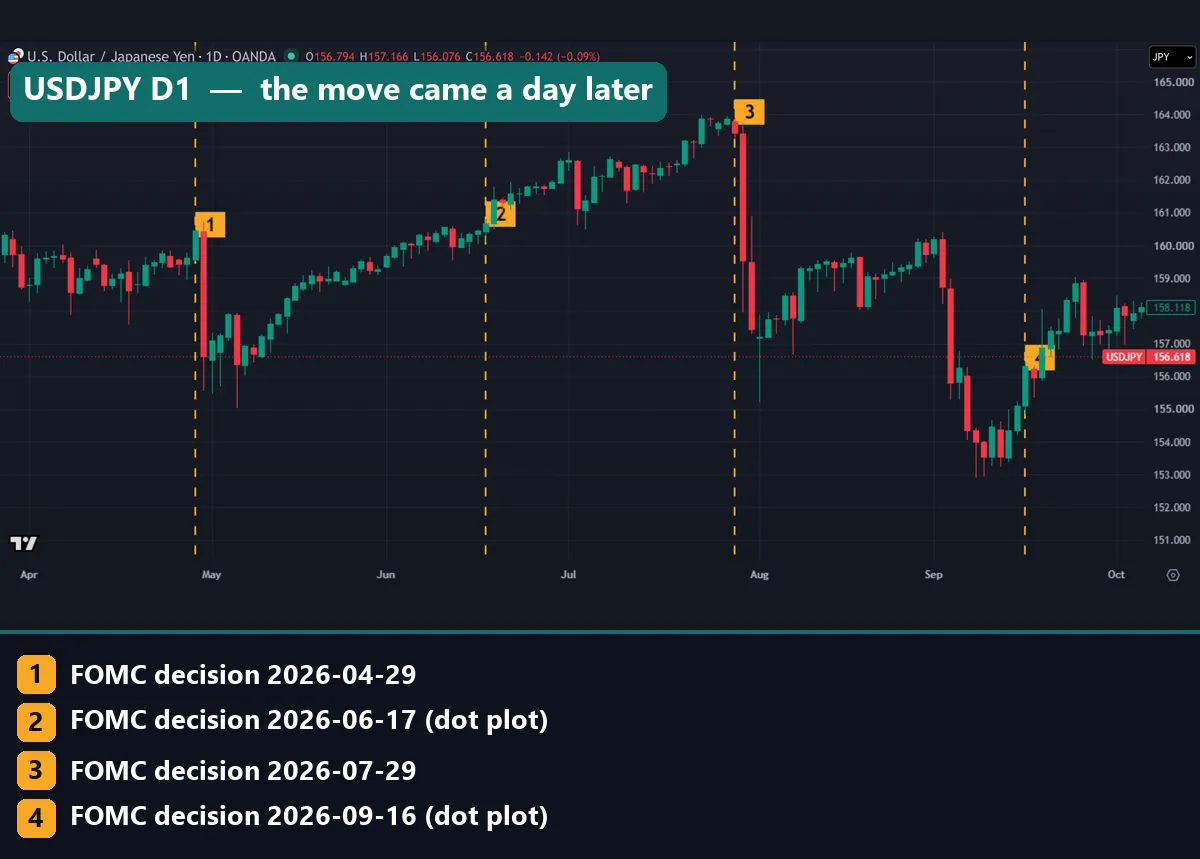
USDJPY is different. The April and July lines (1 and 3) sit on modest candles, and the two longest red candles come one bar later. That is the timing problem in plain sight. The statement lands three hours before the daily bar closes, so much of the reaction spills into the next bar. Still, a daily chart cannot tell you what drove those candles, because other news that week lands in the same bars.
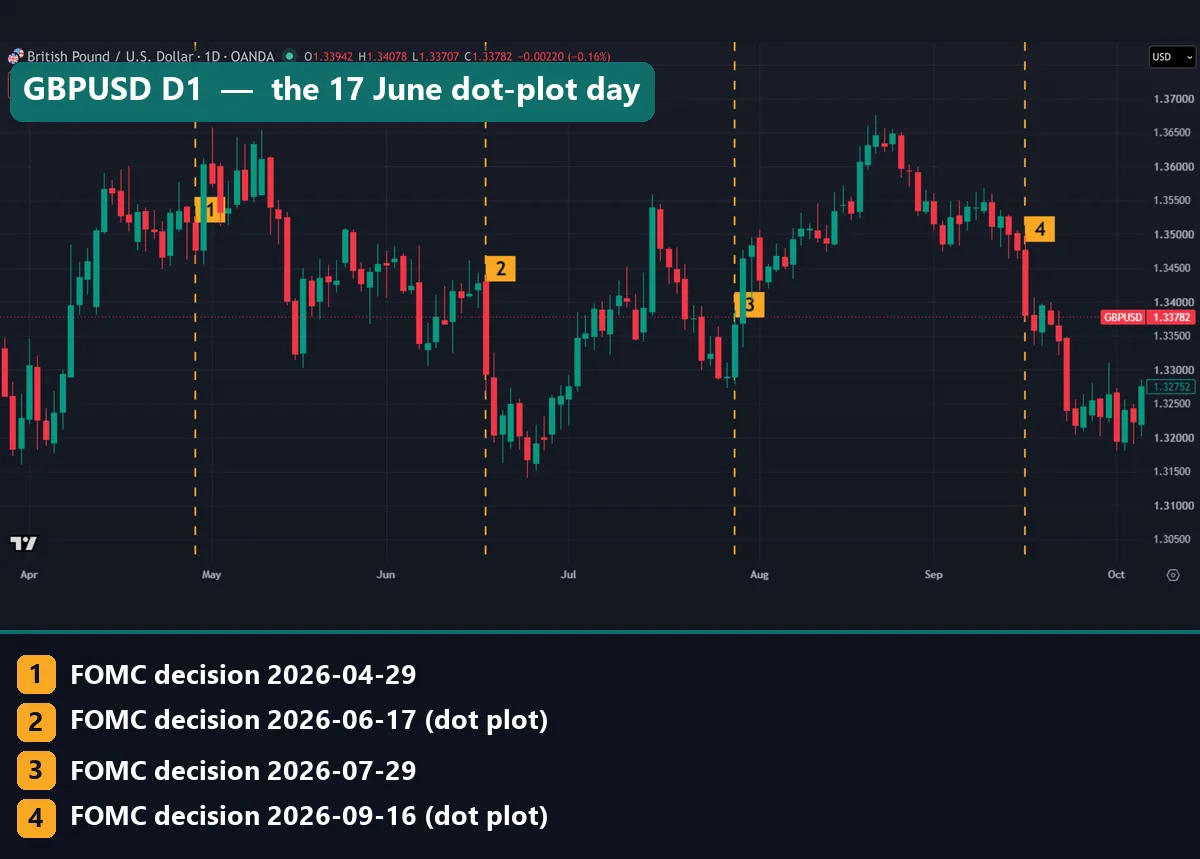
On GBPUSD, the 17 June decision (line 2, a dot-plot meeting) is a long red candle, from above the 1.34000 gridline to around 1.33000. The bars after it keep falling into late June. Yet GBPUSD had the smallest effect of the six USD majors, at 1.16 times a normal Wednesday. One big candle says little about the average.
So read a decision day in three steps. First, find the 14:00 bar on an intraday chart. Next, compare the decision-day candle with the one after it. Then check a cross like EURGBP to see whether the move belongs to the dollar or to the whole market.
Worked example: EURUSD across 49 decision days
EURUSD showed the largest effect of the 23 pairs. Figures are medians in ATR units.
| EURUSD, daily bar | Range in ATR |
|---|---|
| All days | 0.92 |
| Other Wednesdays | 0.90 |
| Decision days (49) | 1.34 |
| Dot-plot meetings | 1.48 |
| No dot plot | 1.32 |
| Day after | 1.33 |
A normal Wednesday spans 0.90 of the prior day’s ATR, while a decision day spans 1.34. Divide one by the other and you get the 1.49 ratio on our data chart. So the decision adds about 0.44 ATR, close to half a normal Wednesday’s range. The day after runs nearly as wide, at 1.33.
Now picture a stop one ordinary Wednesday’s range from entry, 0.90 ATR. On a median decision day the bar spans 1.34 ATR, so the range outgrows the stop. Our page on ATR stop loss distance shows how to size stops this way.
The M15 bars show where the extra range comes from. On the nine EURUSD meetings, the 14:00 bar ran 6.98 times the same bar on other Wednesdays, and the 14:30 bar ran 6.84 times. By contrast, the 13:45 bar ran only 1.39 times. In other words, the action starts at 14:00, not before.
All 23 pairs and the 15-minute bars
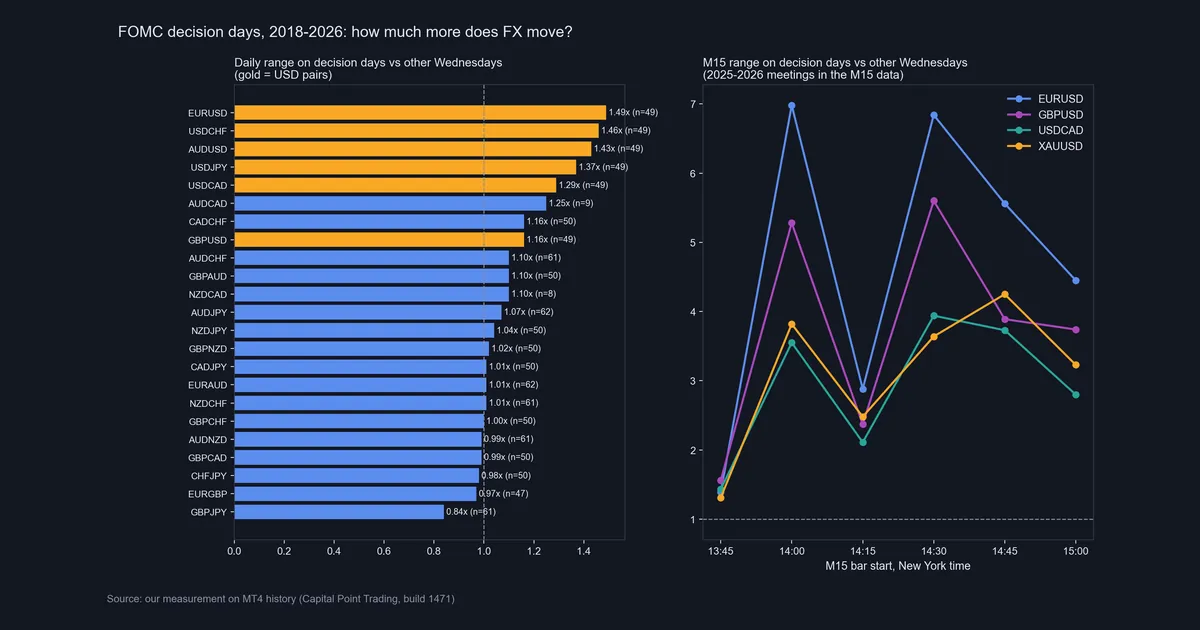
Our data chart shows all 23 pairs. Gold bars mark the USD majors, and five sit at the top: EURUSD 1.49, USDCHF 1.46, AUDUSD 1.43, USDJPY 1.37 and USDCAD 1.29. GBPUSD trails at 1.16. The blue crosses cluster around the dashed 1.0 line, with a median of 1.01, which means no effect. AUDCAD at 1.25 looks high, but it rests on only nine days.
The right panel zooms into the hour. Every line jumps at 14:00, dips at 14:15, then climbs again at 14:30, when the Chair starts speaking. On USDCHF the 14:30 bar even beat the statement bar, at 6.47 times normal against 5.07.
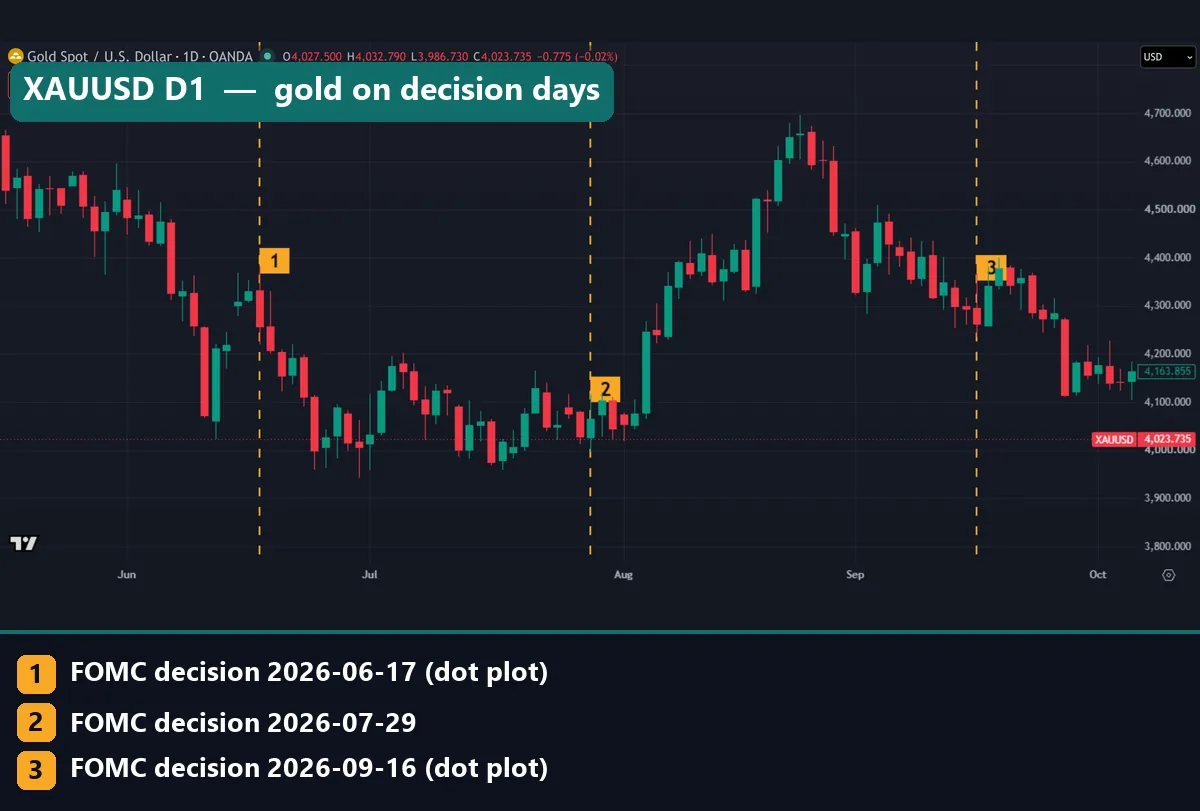
Gold reacts too, a little later. Its 14:00 bar ran 3.82 times normal, but its biggest bar came at 14:45, at 4.25 times. On the daily chart, the June line (1) sits on a long red candle, and the next bar falls further. Even so, several wider gold candles sit away from the lines.
Download the complete indicator database
Put these concepts on your charts. One email unlocks the full library of 1,380+ indicators with compiled MT4 and MT5 files, plus my TradingView scripts. No paywall, no spam, unsubscribe any time.
Get free access to my indicator database
One email unlocks 1,380+ free MT4, MT5 and TradingView indicators — the complete library. No single-tool download; you get the whole database.
Where it fails
Our numbers describe size, not trades, and the test has blind spots.
Direction is a coin flip. The decision day’s direction carried on over the next five days only 48.7% of the time.
The daily bar splits the reaction. Pooled across all 23 pairs, the day after ran 1.19 ATR, against 1.02 on decision day. We did not test a plain Thursday baseline, so part of that gap may belong to Thursdays in general.
Crosses ignore it. On EURGBP and AUDNZD, a decision day looks like any other Wednesday, at 0.97 and 0.99.
Samples are small. The M15 view rests on nine meetings at most. AUDUSD and USDJPY had only three, so their 14:30 readings of 7.21 and 4.93 could shift a lot.
The dot plot did not reliably widen the day. Pooled, dot-plot meetings ran 1.03 ATR and the rest 1.02. On USDJPY the order even flipped, at 1.09 against 1.30.
Emergencies behave differently. The March 2020 cuts produced far wider days, 1.51 ATR pooled, and rules built on scheduled meetings will not cover them.
Costs rise near 14:00. Spreads tend to widen around scheduled news, as our page on why spreads widen explains.
Big days without the Fed
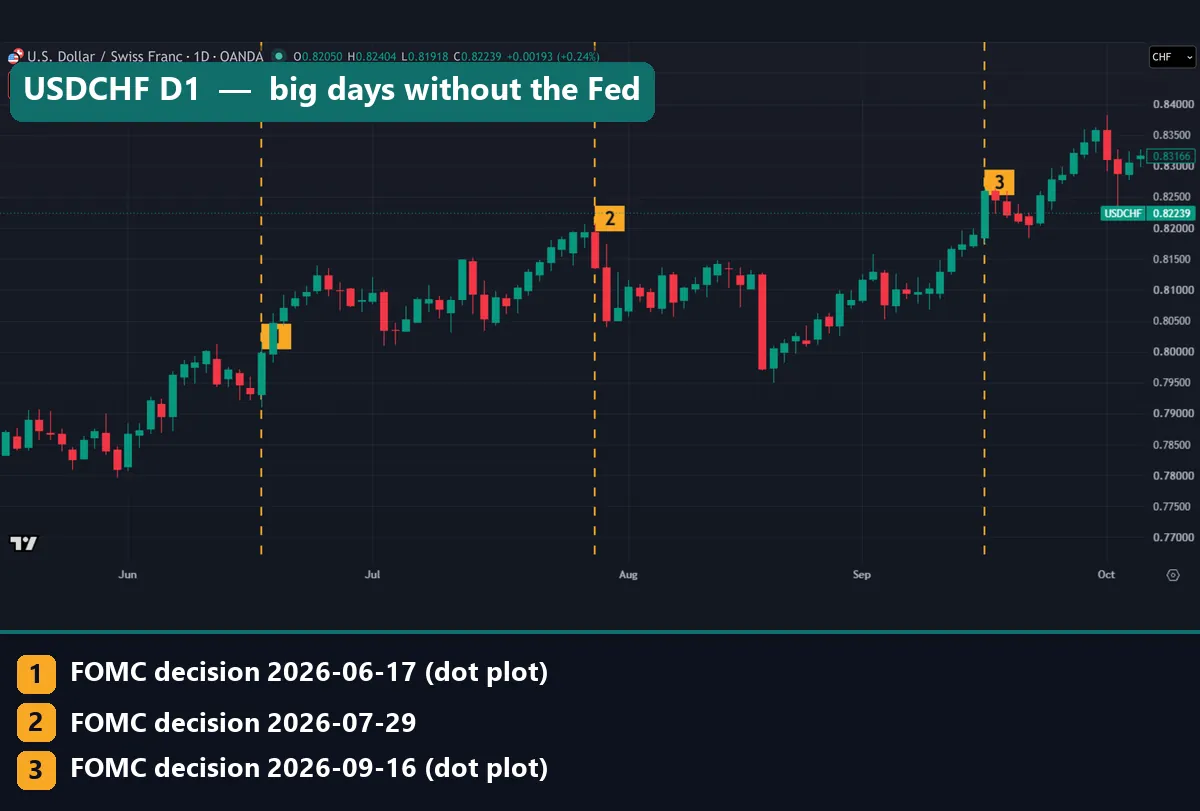
USDCHF has the second-largest effect in our data, at 1.46. Yet the tallest red candle in view, in mid August, sits on no line at all. At the July line (2), the decision-day candle closes lower, and a longer red candle follows the next day. Then the September line (3) brings a long green candle. At that meeting the statement raised the target range by a quarter point, to 3.75% to 4%, according to the official release on the calendar page.
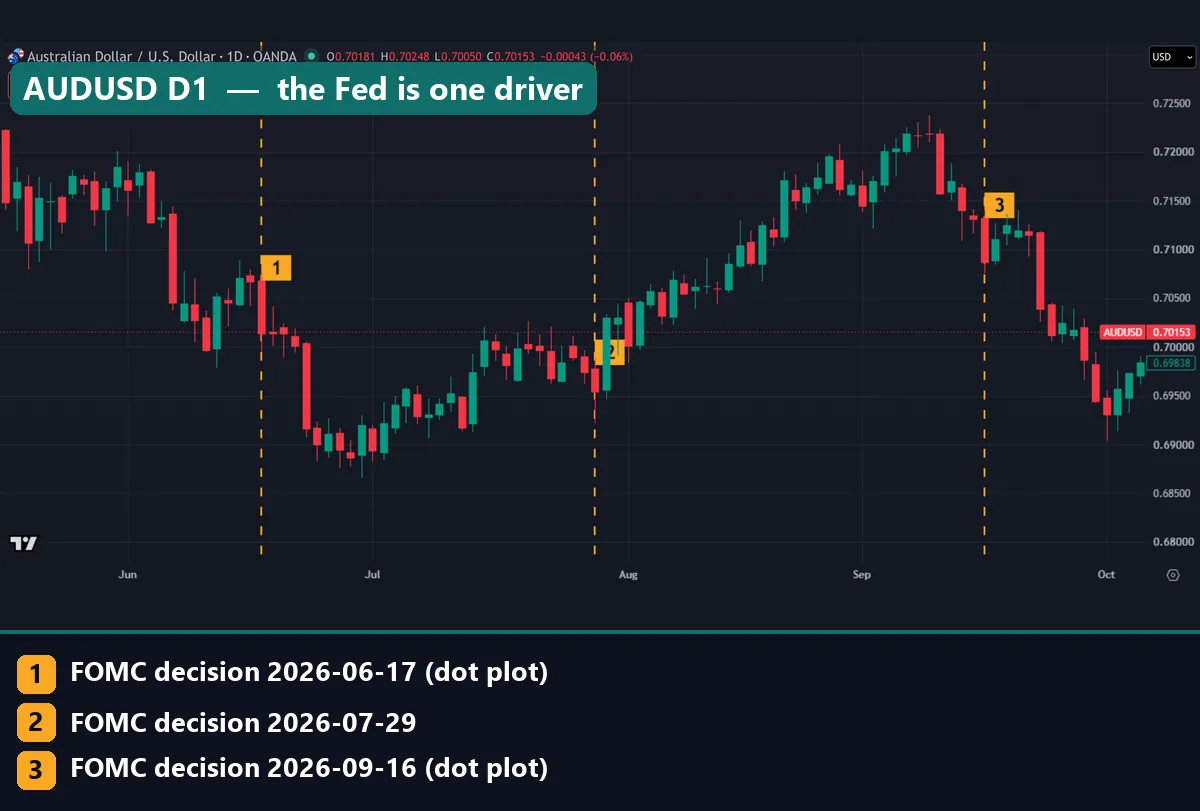
AUDUSD makes the same point. Its ratio is 1.43, yet its longest candles came on days without a meeting, in early June, late June and late September. So the averages hold, but single days do not line up with the calendar.
Treat the meeting as one known volatility window, not the only one. Our economic calendar lists the other big releases. For example, US initial jobless claims land every Thursday, the day after most decisions.
Common mistakes around FOMC meetings
Reading the daily candle as the whole reaction. The statement arrives three hours before the daily bar closes, so check an M15 chart and the next daily bar too.
Using the wrong clock. The 14:00 New York slot shifts in UTC terms twice a year, and broker clocks differ again. Check our forex news release times page first.
Leaving a tight stop through 14:00 and 14:30. On EURUSD both bars ran nearly seven times their normal size. Some prop firms also restrict trades around such news, so read our note on prop firm news trading rules.
Treating the first move as the trend. At 48.7%, the five-day follow-through is no better than a coin toss, so let the market settle first.
Where to go next
The Fed is one of several central banks that move currencies. Our guide to central bank rate decisions compares them, and the interest rate tracker shows where policy rates stand now. For the dollar’s broad moves, see the dollar index in forex.
Our guide to high-impact news in forex ranks the other releases that matter. To chart the policy rate itself, open the United States interest rate chart on TradingView.
FAQ: FOMC meeting questions
How often does the FOMC meet?
It holds eight scheduled meetings a year, plus extra ones when needed. Each regular meeting runs over two days.
What time is the FOMC announcement?
The statement comes out at 14:00 New York time, and the press conference starts at 14:30. That means 18:00 UTC in US summer time and 19:00 UTC in winter.
When is the next FOMC meeting?
It runs on 27 and 28 October 2026, with the decision on 28 October. The last one this year runs on 8 and 9 December and brings new projections.
What is the FOMC dot plot?
It is a chart in the Summary of Economic Projections, which comes out at four meetings a year. In our data, dot-plot meetings did not reliably move forex more than the rest.
Which currency pairs move most on FOMC days?
The USD majors. In our MT4 history, EURUSD ran 1.49 times a normal Wednesday’s range, USDCHF 1.46 and AUDUSD 1.43. Crosses came out at about 1.0.
Does the dollar rise after a rate hike?
We did not split meetings by hike, hold or cut. We did check whether the decision day’s direction carried on for five days, and it did only 48.7% of the time.
When do the FOMC minutes come out?
Three weeks after the decision, at 14:00 New York. For example, the minutes of the 16 September 2026 meeting came out on 7 October 2026.
Should I trade an FOMC meeting?
That depends on your plan and your risk limits. USD pairs range about 1.4 times wider, the 14:00 and 14:30 bars spike, and direction over five days is a coin flip. If you trade it, size for the wider range and set your exit first; results are not guaranteed; past performance is not indicative of future results.
Last updated: 23 October 2026.

About the author
Written by Dominic Walsh, a Forex trader and MT4/MT5 indicator, Expert Advisor and script developer. Every tool on forexmt4systems.com is tested on live charts before release and ships with ready-to-use compiled MT4 (.ex4) and MT5 (.ex5) files. Learn more about the trader and developer behind this site.
How we build, test and correct every tool: Editorial & Testing Policy. Trading carries risk; see the disclaimer.