
Initial jobless claims are the weekly count of new filings for US unemployment benefits. The report lands every Thursday at 08:30 New York time. This guide settles two questions: what the report measures, and what it does to a price chart. We measured the 08:30 bar on seven symbols in MetaTrader 4 history. In short, the release bar ran 1.26 to 1.49 times wider than the same bar from Monday to Wednesday. We measured size, not direction, so we make no claim about which way price goes.
What initial jobless claims measure
Each claim is a person filing for benefits for the first time. When someone loses a job, they file with their state unemployment office. States pass the totals to the US Department of Labor, which then publishes the national figure. Its weekly claims data page at the US Department of Labor puts it plainly: initial claims measure emerging unemployment.
The report covers the week that ended on the previous Saturday. So the release on Thursday 15 October 2026 covered the week to Saturday 10 October. That short lag is the main appeal. Payrolls come once a month, but claims come every week.
Traders mostly watch four numbers in the release.
- Initial claims: first-time filings, seasonally adjusted. This is the headline.
- Four-week average: the mean of the last four weekly figures.
- Continuing claims: people still drawing benefits, one week further behind.
- Insured unemployment rate: continuing claims as a share of the jobs that state insurance covers.
How the weekly report works
The mechanism is plain bookkeeping. A person files a first claim, and that adds one to the week’s initial claims. If they keep claiming in later weeks, they move into continuing claims. So rising first filings mean more people losing jobs. Rising continuing claims mean fewer people finding new work.
Two simple formulas cover most of what traders take from the report.
weekly change = this week's initial claims - last week's revised figurefour-week average = (sum of the last four weekly figures) / 4
The Department calls the headline the advance figure, because states revise it a week later. Economic calendars print a consensus forecast next to it. A print well above forecast reads as a softer labor market. Traders mostly react to that surprise, not to the level. Our guide to reading an economic calendar shows where those columns sit.
Why does a jobs count move a currency at all? The labor market shapes Federal Reserve policy, and rate expectations move the dollar. Our explainer on how interest rates affect forex covers that chain.
How we tested
We used M15 bars from MetaTrader 4, build 1471, with history from Capital Point Trading. For each symbol we took the bar that opens at 08:30 New York time. Then we compared Thursday’s bar with the same bar on Monday to Wednesday, and with the bar just before it. Every figure is a median, so one wild week cannot drag the result.
Seven symbols had enough M15 history: EURUSD, GBPUSD, USDCAD, USDCHF, AUDUSD, USDJPY and gold (XAUUSD). Volume means tick volume, the number of price updates in a bar. The iVolume reference in the MQL4 documentation confirms that MT4 bars carry tick volume.
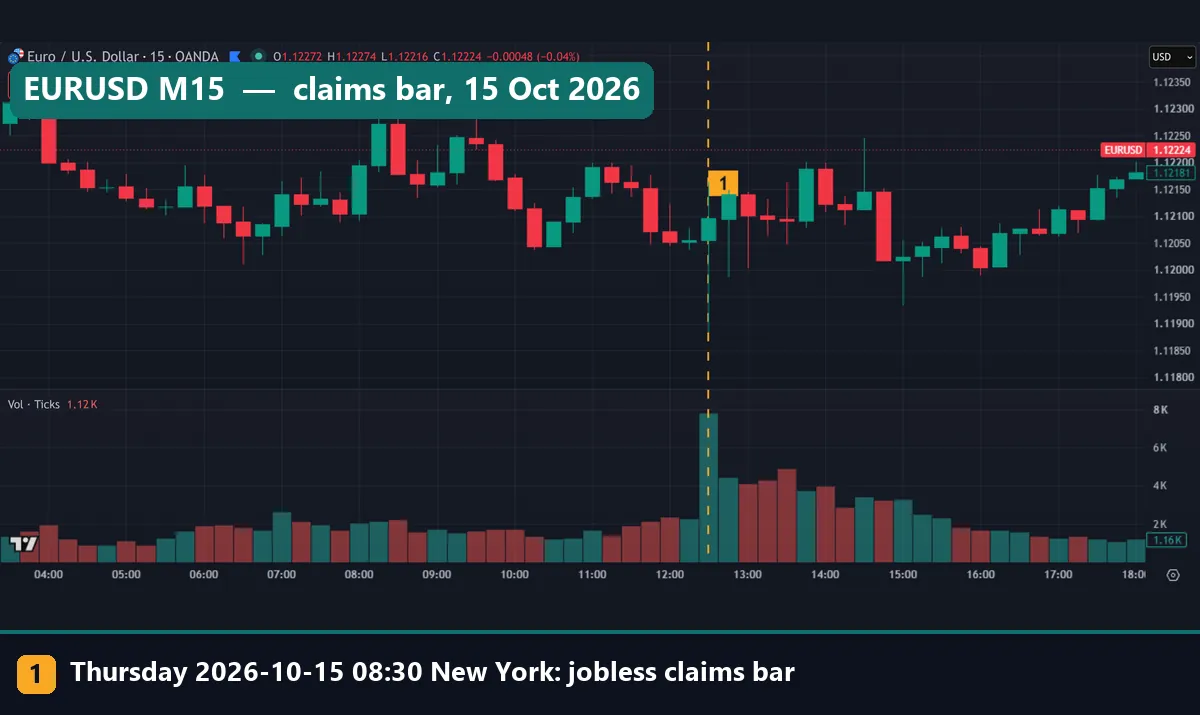
The chart images come from the TradingView web chart with OANDA data, captured on 19 October 2026. A gold dashed line marks the 08:30 New York bar on Thursday 15 October 2026, or on 8 and 15 October for the hourly charts. The chart clock runs on UTC, so on the M15 charts the line sits at 12:30. Nothing here is a trading result, and any trade would also pay spread, swap and commission. Our editorial testing policy explains how we pick and report tests.
Measurement settings
These are the exact settings behind every number in this guide.
| Setting | Value |
|---|---|
| Timeframe | M15 |
| Release bar | Opens 08:30 New York, US daylight time applied |
| Baseline | Same bar, Monday to Wednesday |
| Second check | The bar just before the release bar |
| First-hour move | Release bar’s open to the fourth bar’s close |
Each symbol has its own window and sample size.
| Symbol | Window | Thursdays | Mon to Wed bars |
|---|---|---|---|
| EURUSD | 1 Jul 2025 to 26 Aug 2026 | 58 | 180 |
| GBPUSD | 1 Oct 2025 to 26 Aug 2026 | 45 | 141 |
| USDCAD | 1 Jul 2025 to 12 Aug 2026 | 52 | 163 |
| USDCHF | 1 Jul 2025 to 12 Aug 2026 | 56 | 175 |
| AUDUSD | 25 Mar 2026 to 26 Aug 2026 | 22 | 66 |
| USDJPY | 25 Mar 2026 to 12 Aug 2026 | 20 | 61 |
| XAUUSD | 1 Jul 2025 to 14 Aug 2026 | 53 | 163 |
One rule needs a note. The release moves a day earlier in some holiday weeks, but our rule took every Thursday anyway. So a few Thursdays in the sample had no claims report at 08:30. If anything, that should shrink the gap we measured.
Reading the release on a chart
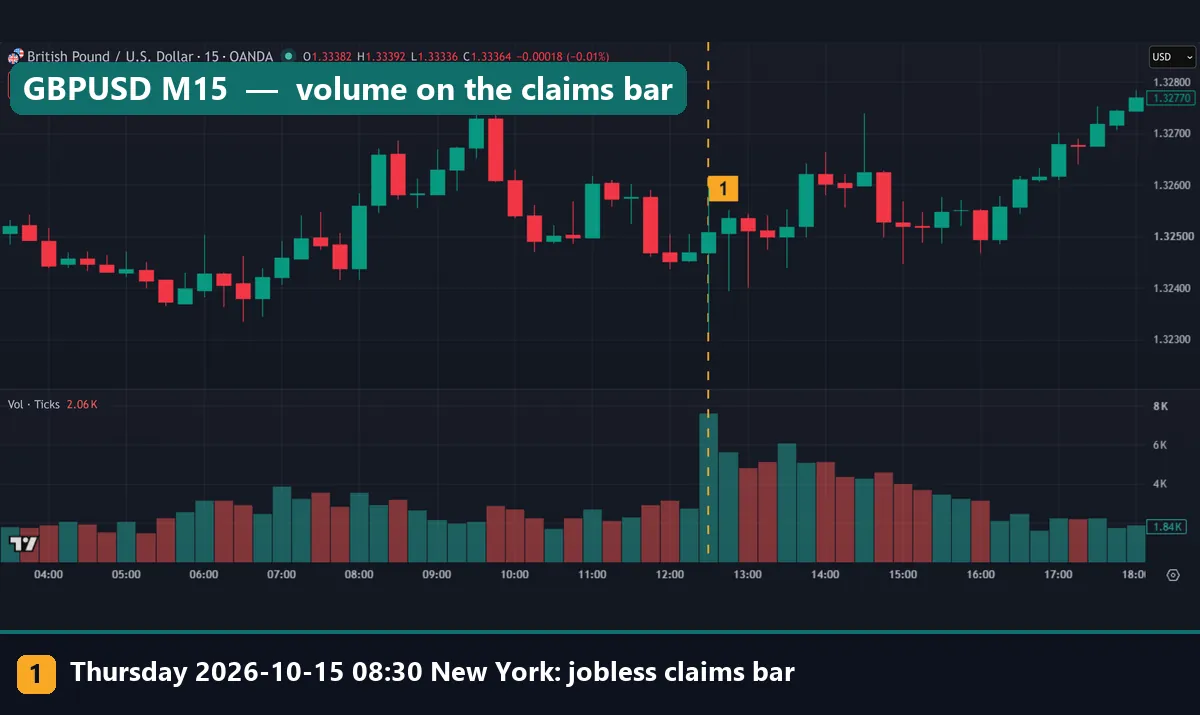
Start with tick volume, not price. On GBPUSD on 15 October, the volume bar on the dashed line towers over the London morning. It reaches close to the 8K gridline, while most earlier bars sit under 4K. Activity stays high for the next hour or two, then fades. One tall bar and a slow decay make the usual footprint of a scheduled release.
Price tells a messier story. The candles just after the line carry long lower wicks. Sellers pushed, and buyers took the ground back inside the same bars.
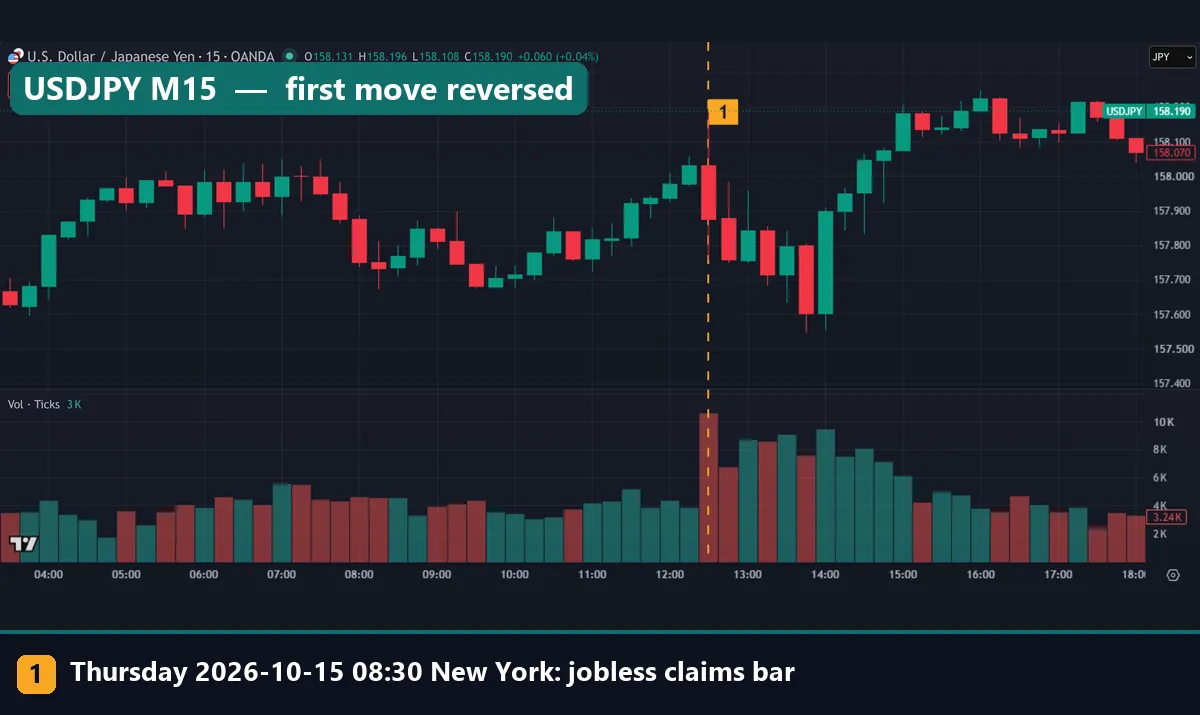
USDJPY took a different path on the same morning. The release bar closed lower, and selling carried on for about an hour. Then the pair turned and climbed back above the release bar’s open within about three hours. Its volume bar on the line stands as the tallest of the session, just above the 10K gridline.
So read the release in two steps. First, check that tick volume jumped on the 08:30 bar, which shows the market noticed. Next, wait a few bars before you read direction, because the first bar can fake. Our page on the forex news spike covers this kind of move in more detail.
Worked example: EURUSD on claims Thursdays
EURUSD has the longest sample, so it makes the clearest example. All figures are medians. One pip on EURUSD is 0.0001, as our pip guide explains.
| EURUSD, 08:30 New York M15 bar | Thursday | Monday to Wednesday |
|---|---|---|
| Bars in sample | 58 | 180 |
| Median range | 11.55 pips | 7.9 pips |
| Range of the bar before | 6.75 pips | 7.3 pips |
| Median tick volume | 1,902 | 1,478 |
| First-hour move | 5.8 pips | 6.3 pips |
On a normal Monday to Wednesday, the 08:30 bar spans 7.9 pips. On Thursday it spans 11.55 pips, which gives the 1.46 ratio on our data chart. The bar before the release spans only 6.75 pips on Thursdays. So the step up from the quiet bar to the release bar comes to 1.71 times. Tick volume rises too, from 1,478 ticks to 1,902.
The last row holds the surprise. One hour after the release, EURUSD sat a median 5.8 pips from the release bar’s open. On other days that figure was 6.3 pips. In other words, the claims bar runs wider, but price does not end up further away. That points to two-way movement inside the bar, not a lasting push.
Stops feel this first. Half of the Thursday release bars spanned more than 11.55 pips from high to low. So a stop closer than that to the 08:30 price sits within reach of a normal claims bar.
Seven symbols, one pattern
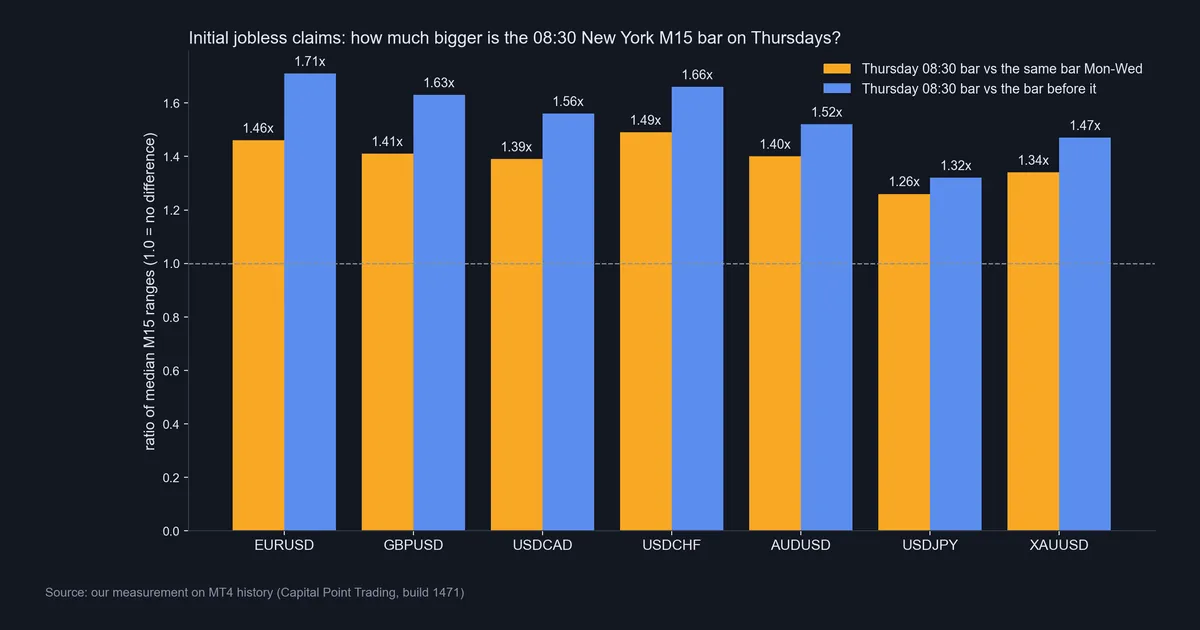
Our data chart puts all seven symbols side by side. Orange bars compare Thursday with Monday to Wednesday. Blue bars compare the release bar with the bar before it. Every bar clears the dashed 1.0 line, which would mean no difference.
The Monday to Wednesday ratio runs from 1.26 on USDJPY to 1.49 on USDCHF. Against the bar before, it runs from 1.32 on USDJPY to 1.71 on EURUSD. Tick volume rose on every symbol as well. For example, USDCHF went from a median of 1,148 ticks to 1,662.
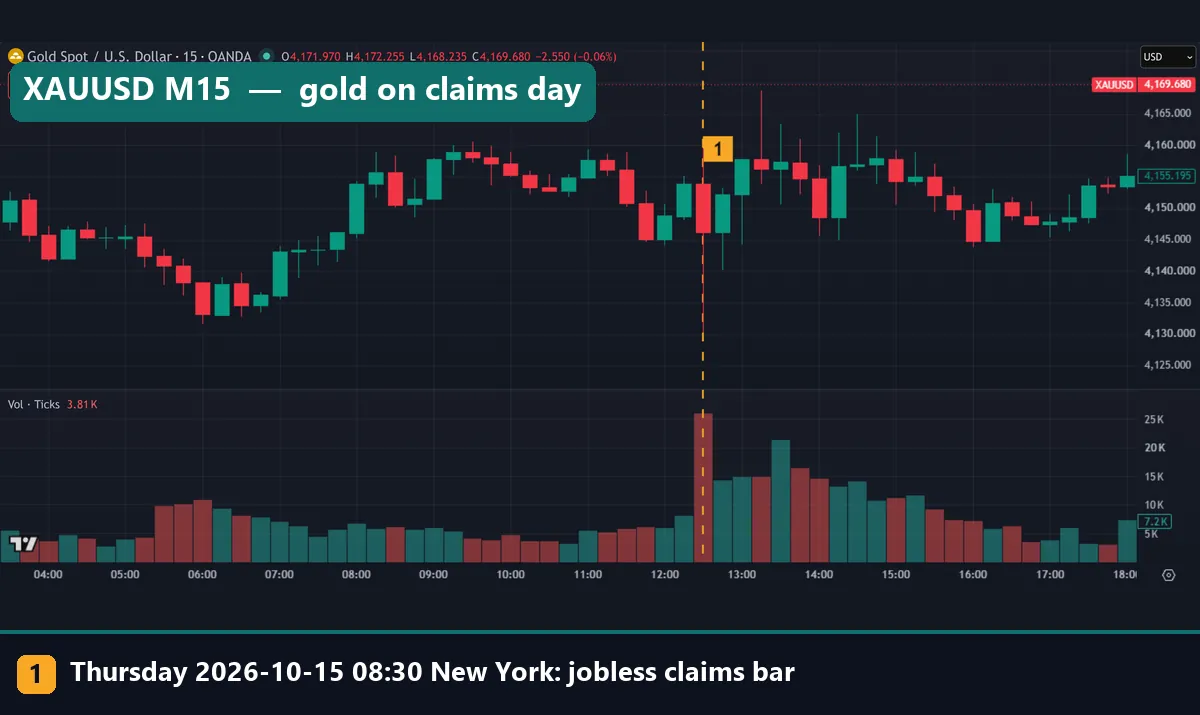
Gold follows the same pattern, quoted in dollars. Its Thursday release bar has a median range of $12.98, against $9.72 from Monday to Wednesday. That gives the 1.34 ratio on the chart. On 15 October the gold volume bar on the line rose just above the 25K gridline, the tallest in the window. Then the next bars printed long wicks on both sides. Our gold pip value guide turns those dollar ranges into money per lot.
Thursday versus Friday at 08:30
Thursday is not the only busy morning. Fridays at 08:30 also carry US data, and the first Friday of most months brings payrolls. So we measured Fridays as a check. On five of seven symbols, the Friday bar landed in between: wider than Monday to Wednesday, narrower than Thursday. EURUSD Fridays had a median range of 8.9 pips.
USDCAD breaks the pattern, with a 12.8-pip Friday bar against 10.3 pips on Thursdays. We did not split Fridays by report, so we cannot say what drove it. The first hour differs too. On all seven symbols, the Friday first-hour move beat the Thursday one. For the payroll side of the calendar, see our guide to NFP in trading.
Download the complete indicator database
Put these concepts on your charts. One email unlocks the full library of 1,380+ indicators with compiled MT4 and MT5 files, plus my TradingView scripts. No paywall, no spam, unsubscribe any time.
Get free access to my indicator database
One email unlocks 1,380+ free MT4, MT5 and TradingView indicators — the complete library. No single-tool download; you get the whole database.
Where it fails
Claims are a noisy weekly series, and our test has blind spots too.
We measured size, not direction. Nothing in our data says the dollar rises or falls after a high or low print. We did not record the actual or forecast figures, so we cannot tie a surprise to a move. A wider bar is not a signal to buy or sell.
The 08:30 slot is not only claims. Other US reports sometimes land in the same minute on a Thursday. So the effect belongs to the time slot, not to claims alone. Monday to Wednesday carry their own 08:30 releases too, so our baseline is not a quiet one either.
The first hour gives the extra range back. On six of seven symbols, the median first-hour move on Thursdays was no larger than on other days. USDJPY moved a median 3.75 pips in that hour on Thursdays, against 5.4 pips on other days.
The samples are small. USDJPY has only 20 Thursdays and AUDUSD 22. On samples that size, a handful of odd weeks can still shift a median.
The headline changes. States revise the advance figure the following week, after the market has traded the first print. Spreads also tend to widen around scheduled news, which raises the real cost of a trade in that bar. Our page on why spreads widen explains the mechanics.
Two claims weeks on the hourly chart
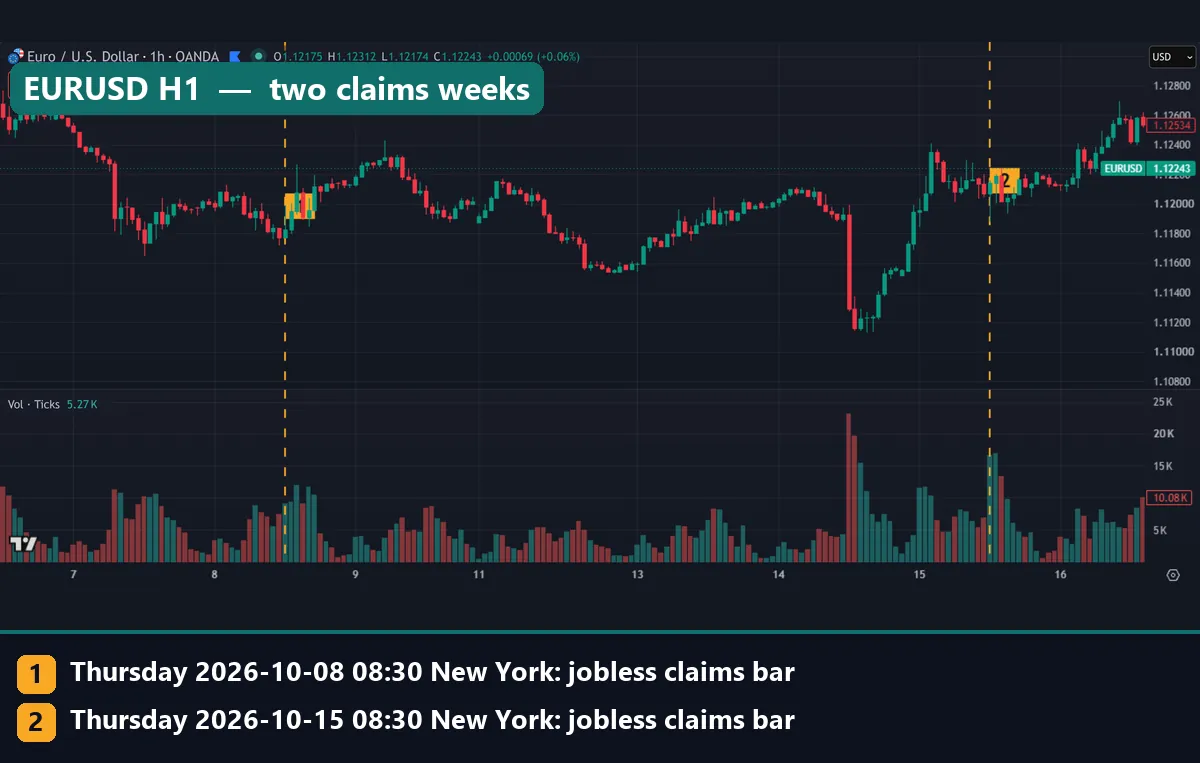
The hourly charts show how uneven the effect can look. On EURUSD, the claims hour on 8 October barely stood out from the hours around it. A week later, the 15 October claims hour printed a clear spike between the 15K and 20K gridlines. Yet the tallest bar of the window came on Wednesday 14 October, a day with no claims report. EURUSD dropped hard into that bar and recovered by the next day.
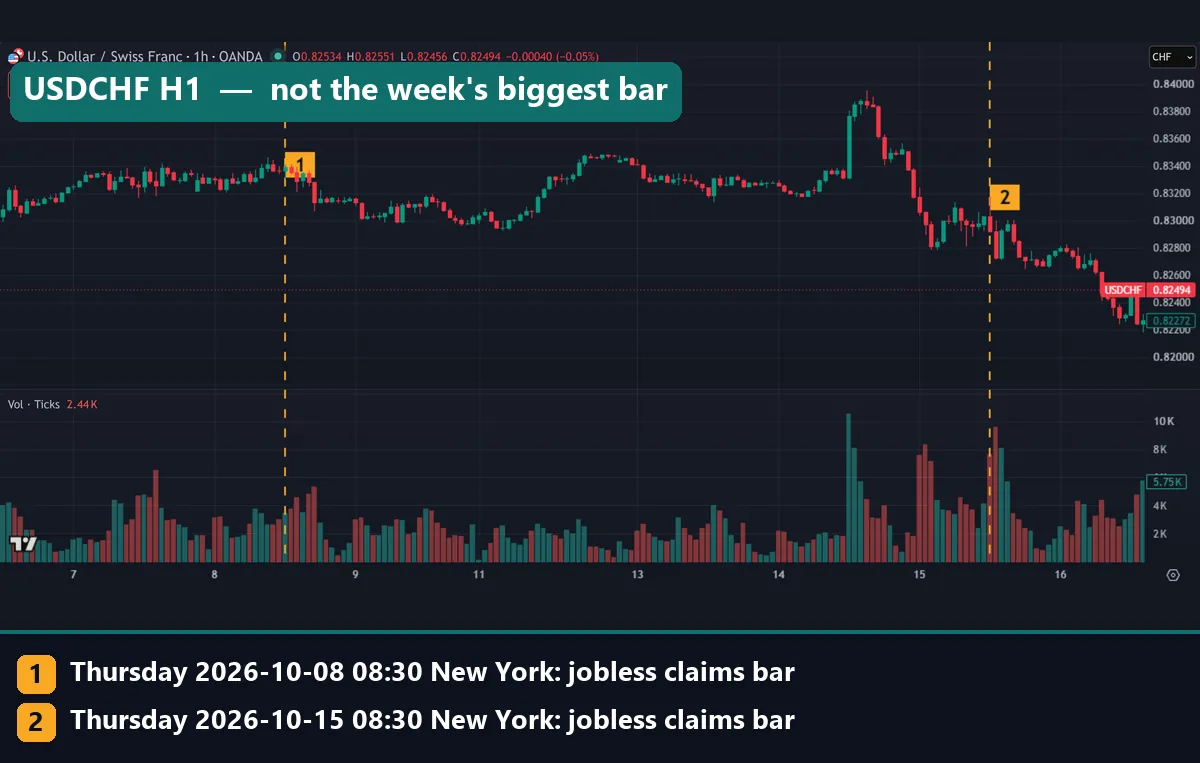
USDCHF tells the same story. On 8 October the claims hour shows only a modest rise in tick volume. A week later the claims hour and the hour after it both pass the 8K gridline. Still, the 14 October bar stands taller, just above 10K. So a claims Thursday makes a spike likely, not certain, and it may not bring the biggest bar of the week.
Common mistakes with the claims release
Trading the level, not the trend. One week tells you little, because the series jumps around. The four-week average and the path of continuing claims say more than a single print.
Using the wrong clock. The release time of 08:30 New York means 12:30 UTC during US daylight time and 13:30 UTC in winter. Your broker’s server clock may differ again. Check it with our forex time zone converter, or look up the slot on our forex news release times page.
Parking a tight stop in front of the bar. A stop inside 11.55 pips on EURUSD can get hit in the first 15 minutes for no lasting reason. Our guide on how to use a stop loss covers placement around events like this. Some prop firms also limit trading around news, so check our note on prop firm news trading rules too.
Trusting the first bar’s direction. USDJPY on 15 October fell on the release bar, then recovered within hours. Let a few bars pass before you read the market’s verdict.
Where to go next
Claims are one release among many. Our economic calendar tracks upcoming releases. Our guide to high-impact news in forex explains which ones tend to matter most. To chart the claims series itself, open United States Initial Jobless Claims on TradingView. For a plain definition from a second source, see initial claims at Investopedia.
The same habit fits every 08:30 release: check volume first, wait a few bars, and size the stop to the bar you measured.
FAQ: initial jobless claims
What time does the initial jobless claims report come out?
The US Department of Labor publishes it on Thursdays at 08:30 New York time. That means 12:30 UTC during US daylight time and 13:30 UTC in winter. In some holiday weeks it comes a day earlier.
How do initial claims differ from continuing claims?
Initial claims count first-time filings in the latest week. Continuing claims count people who keep drawing benefits, and they run one week further behind.
Is a high claims number bad for the dollar?
Many traders read a higher than expected print as a softer job market, which can weigh on the dollar. But our test measured the size of the move, not its direction, so we cannot confirm a reliable link.
How much does EURUSD move on jobless claims?
In our MT4 history, the median Thursday 08:30 M15 bar on EURUSD spanned 11.55 pips, against 7.9 pips from Monday to Wednesday. One hour later, though, the net move was no larger than on other days.
Do jobless claims move gold?
Yes, in range terms. Gold’s Thursday release bar had a median range of $12.98, against $9.72 on other days. The first-hour net move did not grow, at $6.77 against $7.79.
Why do traders watch the four-week average?
Single weeks jump around because of holidays and seasonal hiring. The four-week average divides the last four weekly figures by four, so one odd week moves it less.
Can I chart jobless claims on TradingView?
Yes. TradingView lists the series under the ticker ECONOMICS:USIJC, and continuing claims under ECONOMICS:USCJC. You can open either one beside a currency pair.
Should I trade the jobless claims release?
That depends on your plan and your risk limits. The release bar runs wider than usual, spreads can widen, and the first move can reverse within the hour. If you do trade it, size the position for the wider bar and define your exit first; results are not guaranteed; past performance is not indicative of future results.
Last updated: 19 October 2026.

About the author
Written by Dominic Walsh, a Forex trader and MT4/MT5 indicator, Expert Advisor and script developer. Every tool on forexmt4systems.com is tested on live charts before release and ships with ready-to-use compiled MT4 (.ex4) and MT5 (.ex5) files. Learn more about the trader and developer behind this site.
How we build, test and correct every tool: Editorial & Testing Policy. Trading carries risk; see the disclaimer.