
Nikkei futures are exchange-traded contracts on the Nikkei 225 stock index. We charted the two that trade on the Osaka Exchange and on CME. This guide settles three things: what the contracts are, how they differ from the cash index and a Japan 225 CFD, and when this market moves. We print contract facts only where we could load the exchange’s own page.
What Nikkei futures are
A Nikkei future is an agreement to settle the value of the Nikkei 225 on a set date. No shares change hands at the end. Instead, the Osaka contract settles in cash at a price called the Special Quotation, according to JPX’s contract specifications for Nikkei 225 Futures. So you hold a margined position on an index number, with a fixed end date.
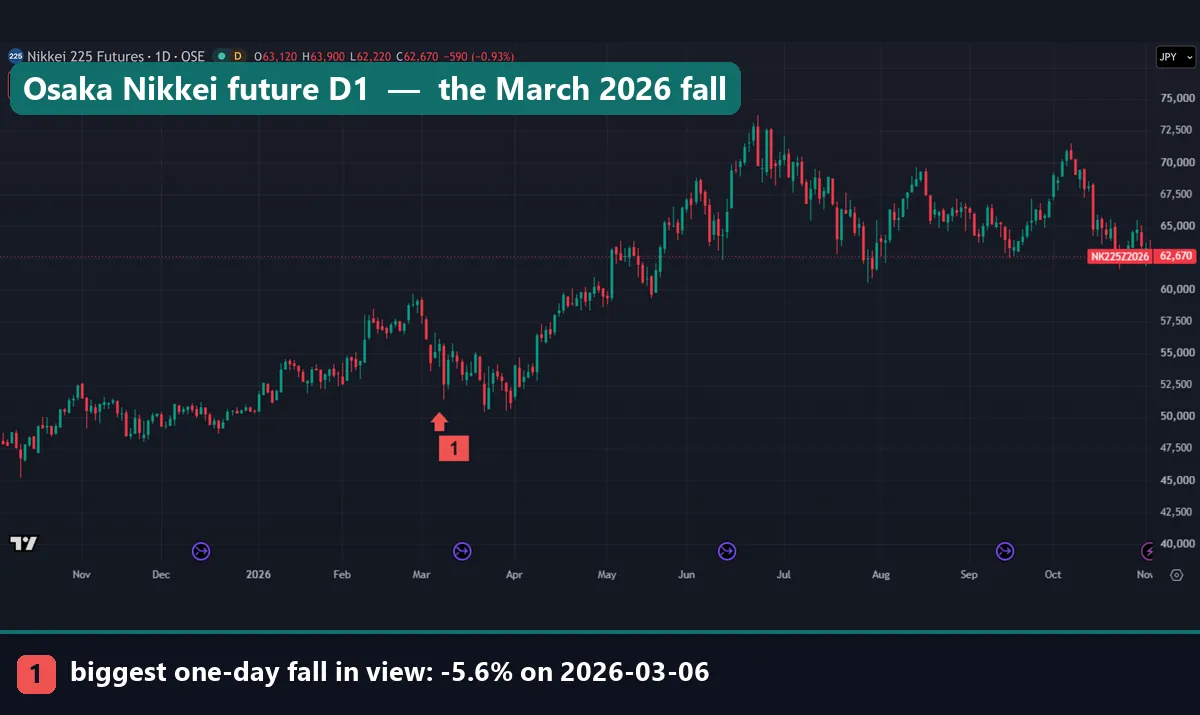
The chart above is that Osaka contract on TradingView, under the symbol OSE:NK2251!. The “1!” marks a continuous series. TradingView’s help page on 1! contracts describes it as an artificial instrument that links separate contracts with different expiry dates. The price tag, NK225Z2026, names the contract behind the series on capture day. We read the purple icons along the bottom, about three months apart, as the switches between contracts.
Both venues follow one index. Nikkei’s official index page calls it a price-weighted index of 225 stocks from the Prime Market of the Tokyo Stock Exchange. Price-weighted means a high-priced share moves the number more than a low-priced one, whatever the size of the company.
How the price is built
The index itself is plain arithmetic. Nikkei adds up the adjusted prices of the 225 members, then divides by a divisor it publishes. Its page listed a divisor of 29.66435840 when we checked, and it says the index recalculates every 5 seconds.
Nikkei 225 = sum of adjusted share prices / divisor
contract value = futures price x 1,000 yen
profit or loss = (exit price - entry price) x 1,000 yen
The last two lines use the Osaka large contract, whose unit JPX sets at the index times JPY 1,000. But a future has its own price. Buyers and sellers set it, so it can sit above or below the cash level, and traders call that difference the basis. Financing costs and expected dividends up to expiry shape the basis. News that lands while the Tokyo stock market is shut also pushes the future away from the last cash print.
At expiry the gap closes. JPX bases the final price on the opening prices of the 225 stocks on the SQ day.
How we tested
We used the TradingView web chart and pulled every bar on 3 November 2026, in line with our editorial testing policy. Four symbols carry this guide, on D1 and H1:
OSE:NK2251!(Osaka future): about 300 daily bars, 7 August 2025 to 2 November 2026.CME:NKD1!(CME dollar future): about 300 daily bars, 27 August 2025 to 3 November 2026.TVC:NI225(cash index): daily bars, May 2002 to 2 November 2026.OANDA:JP225USD(a Japan 225 CFD): daily bars from July 2003, and hourly bars from 14 June 2023 to 3 November 2026.
The futures history is too short for hourly and correlation work, so those statistics use the CFD and the cash index. That makes the CFD a proxy for the futures, not a copy of them. Median daily ranges for cash and the CFD cover the last 750 days. Correlations and opening gaps start in 2023. We placed no trades, and every figure comes before spread, swap and commission.
Osaka contract details and settings
A future has no inputs to tune, so these parameters are the contract’s own. These rows come from the JPX page linked above, for the large contract. JPX lists the smaller Nikkei 225 mini and micro in the same menu, each with its own unit. Read those pages before you size one.
| Item | Osaka large contract | Why it matters |
|---|---|---|
| Contract unit | Nikkei 225 x JPY 1,000 | One index point is JPY 1,000 |
| Tick size | JPY 10, worth JPY 10,000 per contract | The smallest step price can take |
| Trading hours (Tokyo) | 8:45-15:45 and 17:00-6:00 | Shut from 6:00 to 8:45 and from 15:45 to 17:00 |
| Contract months | Quarterly: March, June, September, December | The front contract changes four times a year |
| Last trading day | Business day before the second Friday of the month | The position ends here unless you close or roll it |
| Settlement | Cash, at the Special Quotation | No delivery of shares |
| Price limits | 8%, then 12%, then 16% | Trading can halt on an extreme day |
| Holiday trading | Available | The future can move while cash is shut |
Reading Nikkei futures on a chart
Put the future beside the cash index and the shapes look almost identical. So start with the boxes at the top left. On the cash chart both boxes read 63,081.64, with 0.00 between them, because nobody can trade the index itself. On the Osaka chart they read 62,670 and 62,680, one tick apart.
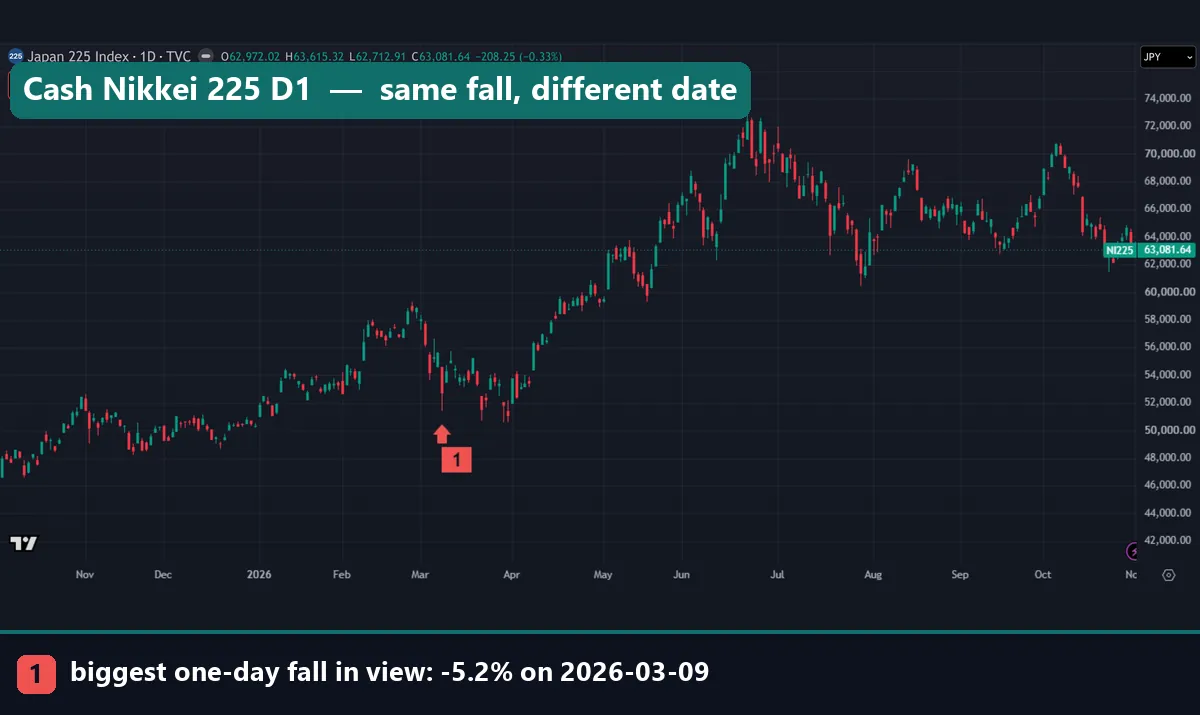
Next, check the dates. The Osaka chart marks its biggest fall in view, -5.6%, on 6 March 2026. The cash chart marks -5.2% on 9 March. We read those as one fall, with both wicks near 51,400 on the axis. Osaka’s daily bar starts at 17:00 Tokyo, when the night session opens, so the bar labelled Friday runs into Monday’s day session. A date on a futures bar and a date on a cash bar can therefore describe different hours.
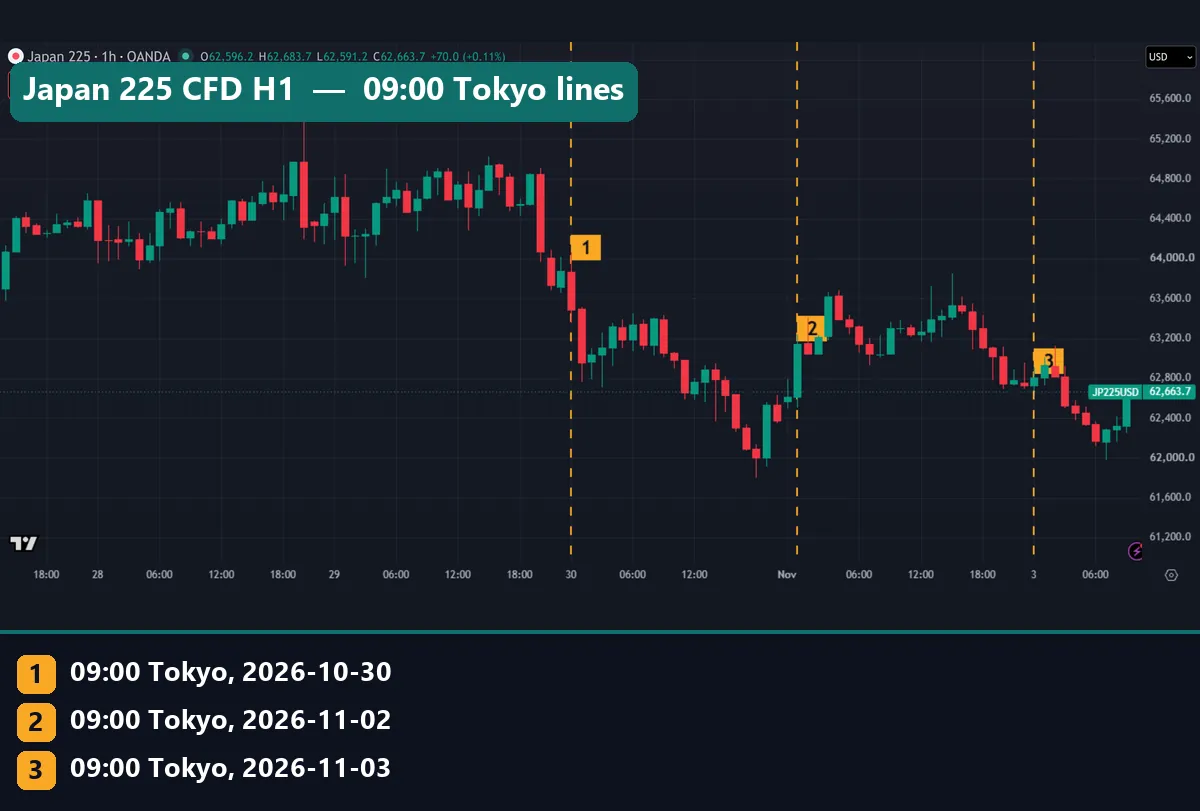
That hourly view is the CFD, with dashed lines at 09:00 Tokyo, the cash open. Its time axis shows UTC, so 09:00 Tokyo sits at 00:00 on the axis. Line 1 (30 October) crosses a tall red bar, from about 64,000 to 63,400. The 2 November line crosses a tall green one, from about 62,500 to 63,200. By contrast, line 3 (3 November) crosses a small bar. Our cash chart and Nikkei’s page still showed the 2 November close that day, so no cash open stood behind it. Three mornings prove nothing, of course, so the next sections use the full sample.
Worked example: what one day means on the large contract
Take the Osaka price on our first chart, 62,670. One large contract at that level has a value of 62,670 x JPY 1,000, which is JPY 62,670,000. Now apply the median Osaka daily range of 2.27%. That gives 62,670 x 0.0227, or about 1,423 points. At JPY 1,000 a point, an ordinary day’s high-to-low spans about JPY 1,423,000 on one contract. In ticks, that is about 142.
Now take a bad day. On 5 August 2024 the cash index opened at 35,249.36, reached 35,301.18, fell to 31,156.12 and closed at 31,458.35. High minus low comes to 4,145.06 points, or about 11.8% of the open. That is nearly ten times the 1.22% median cash range. At the same JPY 1,000 a point, it spans about JPY 4.1 million per contract. We use cash numbers as a yardstick here, because our Osaka bars do not reach that far back.
The lesson is about size, not direction. Multiply your stop distance in points by the contract unit, then compare the result with your account. Our position sizing guide and futures position size calculator handle that arithmetic. These are range figures, not trade results, and they sit before all costs.
Which hours carry the range
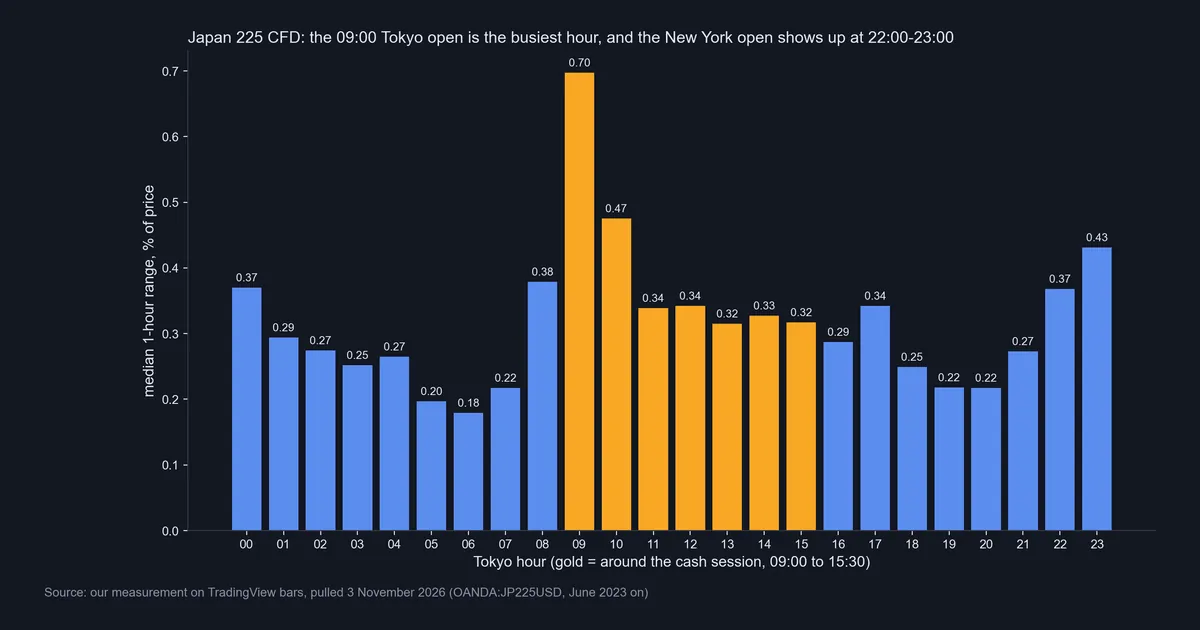
This is our own measurement: CFD hourly bars since June 2023, with UTC converted to Tokyo time. The 09:00 hour is the busiest at a median 0.70% of price, then 10:00 at 0.47%. That pair covers the cash open and the hour after it. The 08:00 hour, at 0.38%, contains the 8:45 futures open. Later, 17:00 lifts to 0.34%, which is the hour the night session opens.
The evening has its own peak. The 22:00 and 23:00 hours print 0.37% and 0.43%, and they hold the US cash open. New York’s 09:30 open fell at 22:30 Tokyo until 1 November 2026, then moved to 23:30 when US clocks changed. So the US open slides between those two bars through the year. The quietest hour is 06:00 at 0.18%, right after the Osaka night session closes.
In short, this market has two active windows. Our Asian trading session guide covers the first, and our New York session guide covers the second.
What the cash open answers to
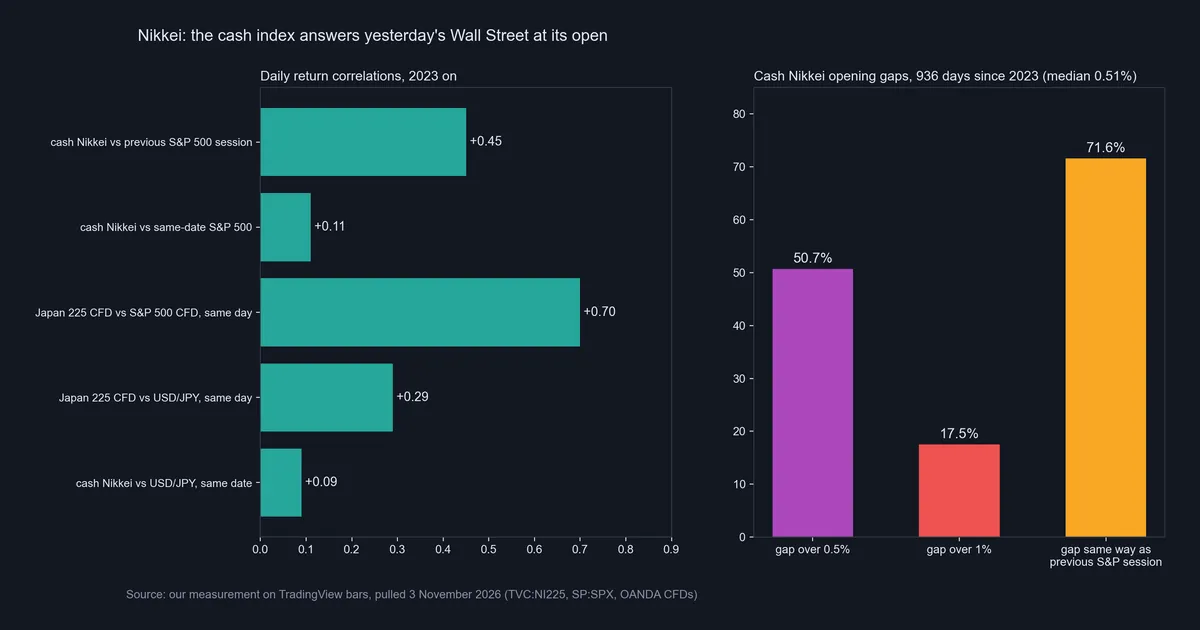
The left panel explains an odd result. Since 2023 the cash Nikkei has a correlation of only +0.11 with the S&P 500 on the same date. Yet Tokyo closes before New York opens, so that session has not happened yet. Against the previous S&P session the figure rises to +0.45. Meanwhile the CFD trades through both markets, and it shows +0.70 with the S&P 500 CFD on the same day.
The right panel covers opening gaps in the cash index, over 936 days since 2023. Their median is 0.51%. A gap tops 0.5% on 50.7% of days and 1% on 17.5%. It ran the same way as the previous S&P session on 71.6% of 902 days. The other 28.4% went against it. Note who owns that gap, though. The future has already traded through the night, so the move reached it hours earlier. Our guide to gap types covers the chart pattern.
The yen link is weaker than people say, on this data. USD/JPY shows +0.09 with the cash index and +0.29 with the CFD. Daily figures cannot rule out a stronger link inside single episodes, however.
Download the complete indicator database
Put these concepts on your charts. One email unlocks the full library of 1,380+ indicators with compiled MT4 and MT5 files, plus my TradingView scripts. No paywall, no spam, unsubscribe any time.
Get free access to my indicator database
One email unlocks 1,380+ free MT4, MT5 and TradingView indicators — the complete library. No single-tool download; you get the whole database.
Where it fails
The biggest limit is the proxy. Our hourly numbers come from a CFD, a broker product on its own feed, as our CFD guide explains. We hold only about 300 daily bars of each future and no hourly bars. So we could not test whether the hourly shape carries over.
The futures comparison is blunt too. Osaka’s median daily range is 2.27% and CME’s is 2.32%, against 1.92% for the CFD and 1.22% for cash. Those windows differ: about 300 bars for the futures and 750 days for the others. The median absolute close gap is 1.1% between Osaka and cash, and 0.82% between CME and Osaka. However, those closes come at different hours, so the gaps mix timing with the real price difference.
Correlations summarise; they do not signal. A figure of +0.45 leaves most of the variation unexplained. Also, the 71.6% gap figure describes a move that has already printed. We did not measure spreads, depth or fills at any hour. Finally, JPX suspends all contract months for at least 10 minutes after a trade at the price limit in the central contract month. A stop cannot fill during a halt, and a CFD provider sets its own rules.
The CME dollar contract on a chart
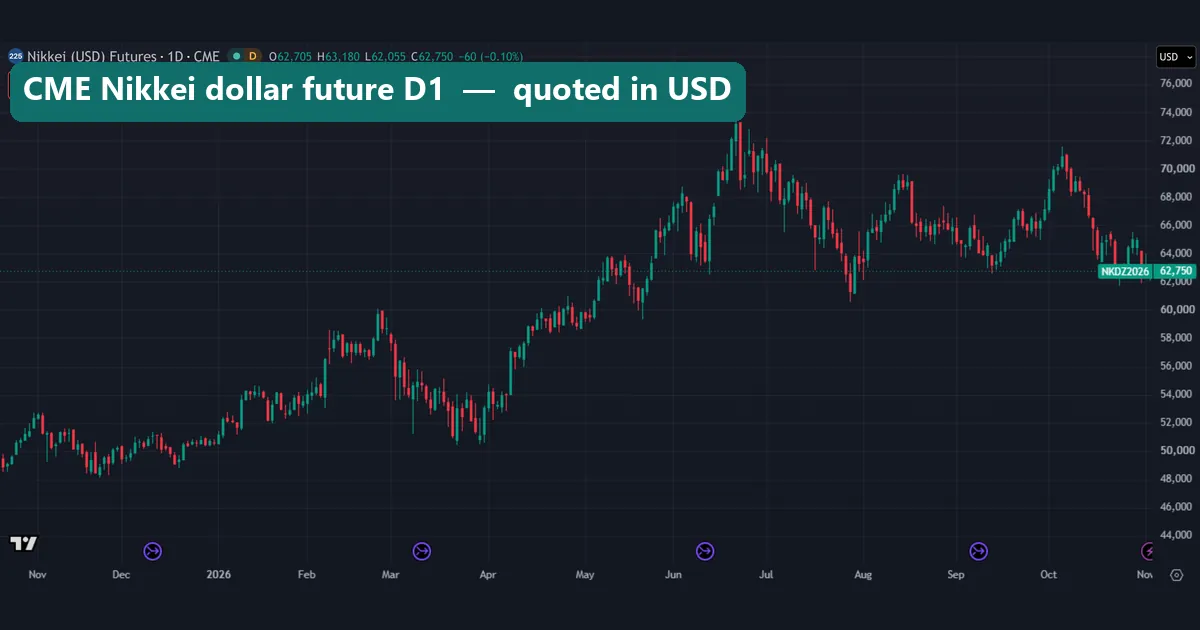
Here is CME:NKD1!, labelled “Nikkei (USD) Futures”, with USD in the currency box and NKDZ2026 on the price tag. It read 62,750 at capture, only 80 points from Osaka’s 62,670. Yet one header says yen and the other says dollars. A straight conversion of about 62,000 yen into dollars would give a far smaller number. So the quote is in index points, and the dollar label tells you the currency of the contract.
We stop there on purpose. CME Group’s pages would not load for our link check when we wrote this. So we leave out its multiplier and tick rather than quote them second hand. Read them on CME’s own site before you size a dollar contract. Our guide to Dow futures on TradingView shows the same chart habits on a US index contract.
The tail you size for: 5 August 2024
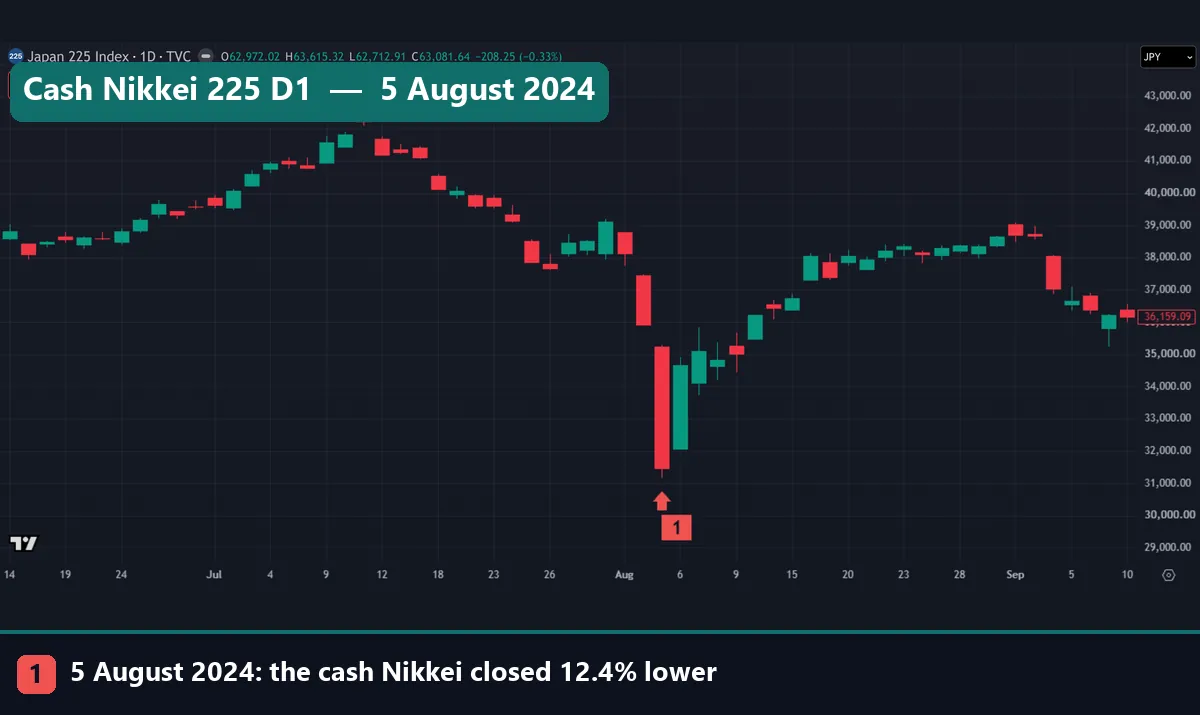
Marker 1 is the worst day in our cash file, which starts in May 2002. That day the index closed 12.4% lower. The next three are 16 October 2008 at -11.4%, 15 March 2011 at -10.6% and 10 October 2008 at -9.6%. One reading note: the header still shows the latest bar’s prices. The red tag at 36,159.09 is the last close in view.
The BIS bulletin on the August 2024 turbulence says the unwinding of leveraged trades in equity and currency markets amplified the reaction to a negative US macro release. It adds that FX carry trades took a heavy hit. We measured the move, not the cause, and our carry trade unwind guide covers the mechanism. The 12.4% fall also sits past JPX’s normal 8% price limit. We did not study how the limits played out that day.
Common mistakes with Nikkei futures
- Treating the CFD as the future. A Japan 225 CFD tracks the same index, yet the contract, the costs and the rules all differ.
- Comparing daily bars by date. Osaka’s bar starts at 17:00 Tokyo and the cash bar at 09:00. As March 2026 shows, one fall can carry two dates.
- Treating the cash gap as a futures gap. The future trades from 17:00 to 6:00, so much of that move is already in its price by 09:00. Watch the future’s own break from 6:00 to 8:45 instead.
- Sizing from a normal day. A median range of 1,423 points says nothing about the tail. August 2024 ran nearly ten times the median cash range.
Where to go next
If your futures quotes look late on the chart, read our guide to real-time data on TradingView. The CFD’s +0.70 with the S&P 500 CFD points to a shared mood, so read about risk-on and risk-off. For the yen side, start with what a carry trade is. Then compare this contract with Nasdaq 100 futures on TradingView and our forex versus futures comparison.
FAQ
What is the difference between Nikkei futures and the Nikkei 225?
The Nikkei 225 is a calculated number, and you cannot trade it directly. A Nikkei future is a contract with its own price, margin and expiry. The Osaka version settles in cash against that index.
Where do Nikkei futures trade?
We charted two venues: the Osaka Exchange, part of Japan Exchange Group, and CME. We did not cover any other listing.
What are the Osaka trading hours?
JPX lists 8:45-15:45 and 17:00-6:00 Tokyo time, with trading shut between those sessions. It also lists holiday trading as available, so check its page before you rely on a date.
How much is one point worth?
On the Osaka large contract one point is JPY 1,000, and one JPY 10 tick is JPY 10,000. CME’s values sit on CME’s own site.
Why does the future differ from the cash Nikkei?
They often print at different hours. Our charts showed Osaka at 62,670 and cash at 63,081.64, but that cash figure was the 2 November close. Financing, dividends and timing all feed the gap.
Does USD/JPY drive Nikkei futures?
On our daily data since 2023 the link is small: +0.09 with cash and +0.29 with the CFD. Those are not futures figures, and daily data can hide short episodes.
Is a Japan 225 CFD the same as a Nikkei future?
No. A CFD is a broker product, not an exchange-listed future. We use OANDA’s only as a proxy, because our futures history is short.
Do Nikkei futures predict the Tokyo open?
We did not measure how closely they point to the open. The nearest figure is the cash gap, which matched the previous S&P session on 71.6% of 902 days. Treat that as context, not a signal, and remember that results are not guaranteed; past performance is not indicative of future results.
Last updated: 3 November 2026.

About the author
Written by Dominic Walsh, a Forex trader and MT4/MT5 indicator, Expert Advisor and script developer. Every tool on forexmt4systems.com is tested on live charts before release and ships with ready-to-use compiled MT4 (.ex4) and MT5 (.ex5) files. Learn more about the trader and developer behind this site.
How we build, test and correct every tool: Editorial & Testing Policy. Trading carries risk; see the disclaimer.