
TradingView Nasdaq 100 futures charts start with one choice: which symbol to type. NQ1!, MNQ1!, NQZ2026 and NASDAQ:NDX all look alike at first glance. This guide settles which symbol does what, which hours move the market, and what one point is worth in dollars. We use our own charts and measured numbers from July 2025 to September 2026.
What TradingView Nasdaq 100 futures symbols are
Nasdaq 100 futures are contracts on the Nasdaq-100 index, listed by CME Group. The index itself holds 100 large non-financial companies on the Nasdaq exchange. Nasdaq’s own Nasdaq-100 index page lists the rules and members. The futures track it almost around the clock.
On TradingView you will meet four kinds of symbol. First, CME_MINI:NQ1! is the E-mini front month, stitched into one long chart. Second, CME_MINI:MNQ1! is the Micro E-mini, one tenth the size. Third, a dated contract such as NQZ2026 is one single expiry. Finally, NASDAQ:NDX is the cash index, which you cannot trade at all.
Coming from spot forex? Our guide on the difference between forex and futures covers margin and expiry.
How continuous contracts and expiry codes work
A futures contract has an end date. Nasdaq 100 futures expire each quarter, and each month has a letter code: H for March, M for June, U for September and Z for December. So NQZ2026 is the E-mini that expires in December 2026. Moving positions to the next contract before expiry is the roll.
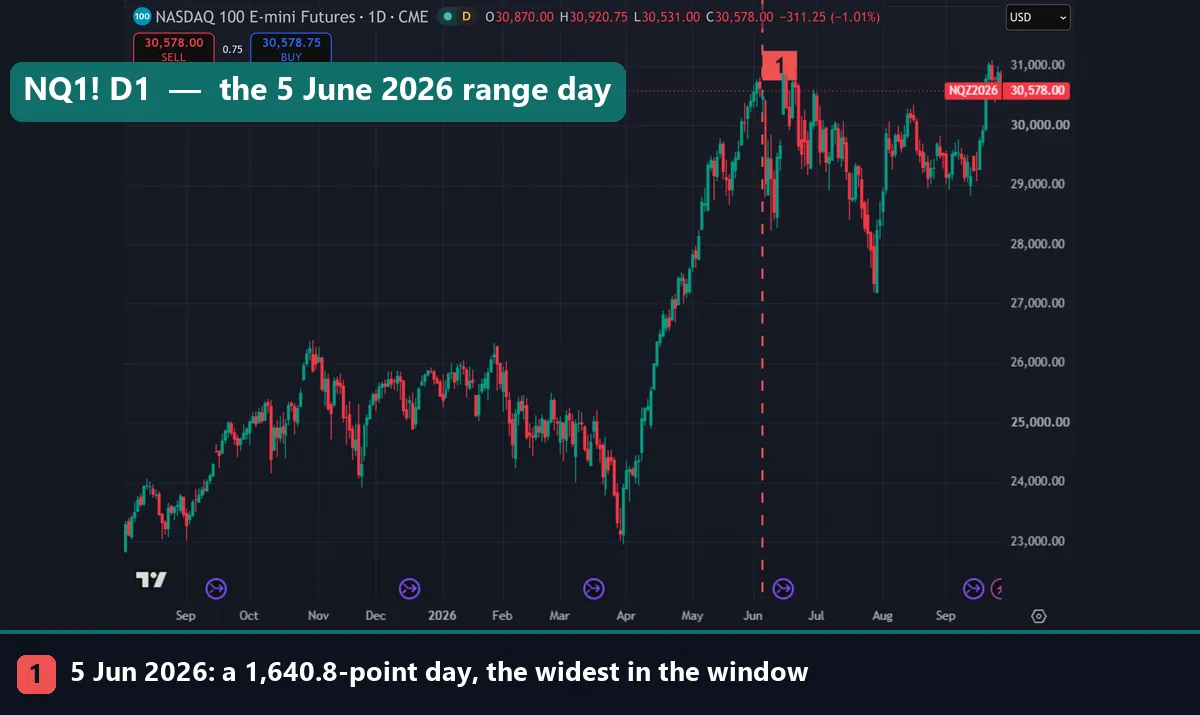
A continuous symbol hides the roll for you. NQ1! always shows the nearest contract, and NQ2! shows the one after it. For example, on our 28 September captures the price label on the right axis reads NQZ2026. That tells you the September contract had already rolled off, and NQ1! now follows December.
The money side needs one formula. Dollar move = points moved × point value × contracts. For NQ the point value is $20. For MNQ it is $2. TradingView’s NQ1! symbol page lists the $20 point value and names NQZ2026 as the front contract. Also, the smallest price step is 0.25 points, so one tick on NQ is worth $5 and one tick on MNQ is worth $0.50. Note that index traders talk in points, not pips; our page on pips vs points explains the gap between the two.
How we tested
We captured seven charts on the TradingView web chart on 28 September 2026. They show CME_MINI:NQ1! on the daily, hourly and weekly timeframes, plus CME_MINI:MNQ1! daily and NASDAQ:NDX daily. Two charts carry a study: the built-in Average True Range with length 14, and the built-in session VWAP.
Then we pulled the NQ1! bars and measured them. The daily set runs from 22 July 2025 to 25 September 2026, which is 299 bars. The hourly set runs from 9 to 28 September 2026, also 299 bars. From these we took closes, extremes, ATR(14), daily ranges and the average range for each UTC hour.
We did not place trades, and we report no profit or loss. Our charts use the data feed that a standard TradingView account shows, so the legend carries a delay flag. Our full method sits in our editorial testing policy.
Symbol and contract settings at a glance
This table maps the symbols we charted. Point values come from the symbol pages; the rest is arithmetic.
| Symbol | What it is | Point value | Tick (0.25 pt) | Best use |
|---|---|---|---|---|
| CME_MINI:NQ1! | E-mini, front month, continuous | $20 | $5.00 | Long history, daily and weekly study |
| CME_MINI:NQ2! | E-mini, next contract, continuous | $20 | $5.00 | Checking the roll before it happens |
| CME_MINI:MNQ1! | Micro E-mini, front month | $2 | $0.50 | Smaller position sizes |
| NQZ2026 | One dated E-mini contract (December 2026) | $20 | $5.00 | Exact levels on the contract you hold |
| NASDAQ:NDX | Cash index, not tradable | None | None | Index level during US cash hours |
Two chart settings matter too. First, TradingView can back-adjust a continuous chart, so old prices shift to remove the jump at each roll. Second, it can plot the settlement price as the daily close. Both change the numbers, so check them before comparing charts.
Reading NQ on a TradingView chart
Start with the legend line at the top left. On our hourly chart it reads “NASDAQ 100 E-mini Futures, 1h, CME”. Next to it sit a green dot and an orange D badge. The dot shows market status. The D badge means the feed is delayed, so the last candle trails the live market by some minutes.
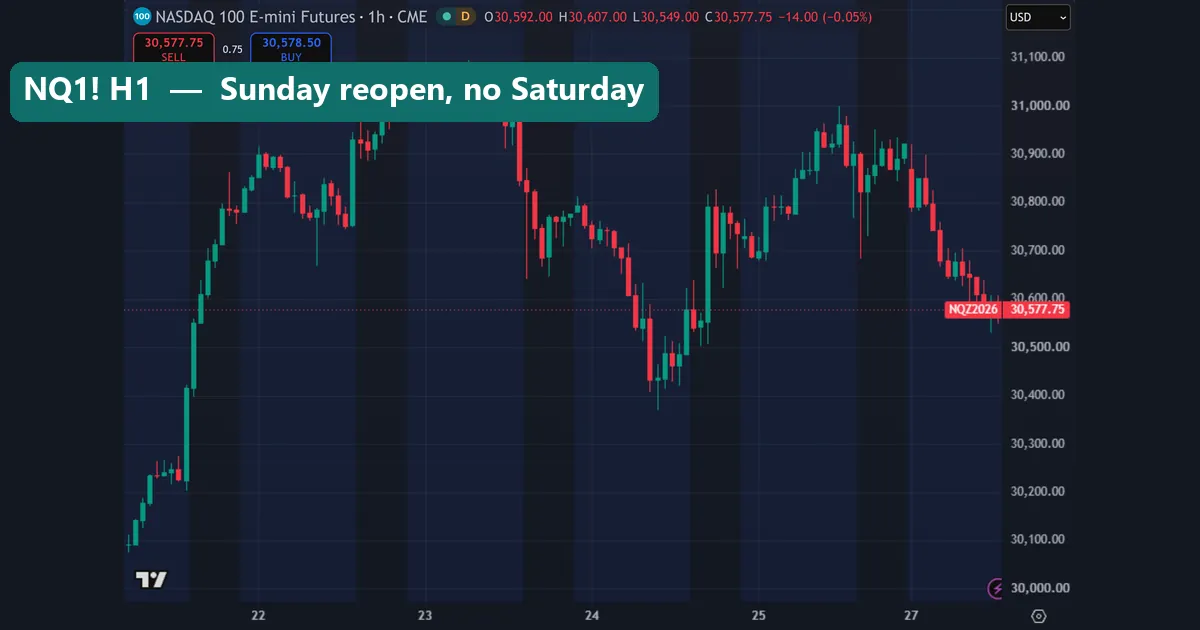
The hourly chart shows why futures feel different from the cash index. For example, the date axis runs 22, 23, 24, 25 and then 27 September. There is no 26, a Saturday, but there is a 27, a Sunday. That is because the futures reopen on Sunday evening US time. Our measured high of 31,094.75 printed on 23 September.
Now compare the micro contract. The MNQ1! daily chart below has the same shape as NQ, because both follow the same index. The legend reads “Micro E-mini Nasdaq-100 Index Futures, 1D, CME”, and the axis label says MNQZ2026. Its close on our capture was 30,577.50, while NQ read 30,578.00. So the level is nearly identical; only the dollar value per point changes.
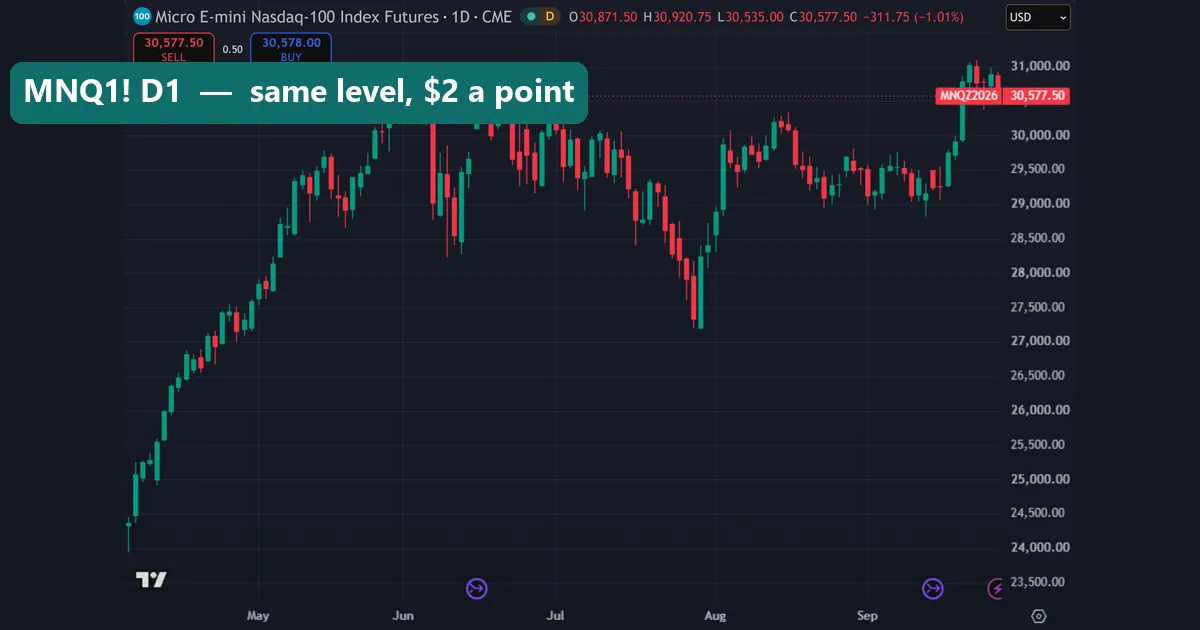
Also, the buy and sell boxes showed a 0.75 gap on NQ and 0.50 on MNQ. Those gaps move tick by tick, so treat them as a snapshot.
Which hours move Nasdaq 100 futures most
We split the hourly bars by UTC hour and took the average high-to-low range for each. The result is plain. The 13:00 UTC hour averaged 157.8 points and 14:00 UTC averaged 146.9 points. The US cash open, 9:30 New York time, falls at 13:30 UTC while New York runs on summer time.
The quiet end is just as clear. The 20:00 UTC hour averaged 45.9 points, and 02:00 UTC averaged 47.1 points. Also, the 21:00 UTC hour has no data at all, because CME pauses trading for about an hour each day. So an hourly chart of NQ has a real hole in it, every weekday.
In short, most of the day’s range tends to arrive around the US open. Our guide to the New York trading session covers that window, and the forex market hours tool shows where your local clock sits. However, these averages cover only three weeks of September, so they describe a pattern, not a timetable. In winter the cash open moves one hour later in UTC.
Worked example: one NQ day in dollars
Here is the arithmetic, using only our measured numbers. First, the big picture. NQ1! closed at 23,226.25 on 22 July 2025 and at 30,889.25 on 25 September 2026. That is a rise of 7,663 points, or 32.99%. On one E-mini contract that move equals $153,260. On one micro it equals $15,326.
Next, a normal day. ATR(14) stood at 463.0 points on 25 September, and the average daily range over the window was 472.2 points. So a normal day moved about $9,260 on one NQ contract, using the ATR, and about $926 on one MNQ.
Then the extreme. The widest day in our window was 5 June 2026, at 1,640.8 points from high to low. On one NQ contract that is $32,816. On one MNQ it is $3,281.60. That single day is the red dashed marker on our first chart.
Finally, the busy hour. The 13:00 UTC hour averaged 157.8 points. That is $3,156 per NQ contract, or $315.60 per MNQ, inside one hour. These figures explain why many smaller accounts start with MNQ. You can run your own numbers in our futures position size calculator.
NQ futures vs the NDX cash index
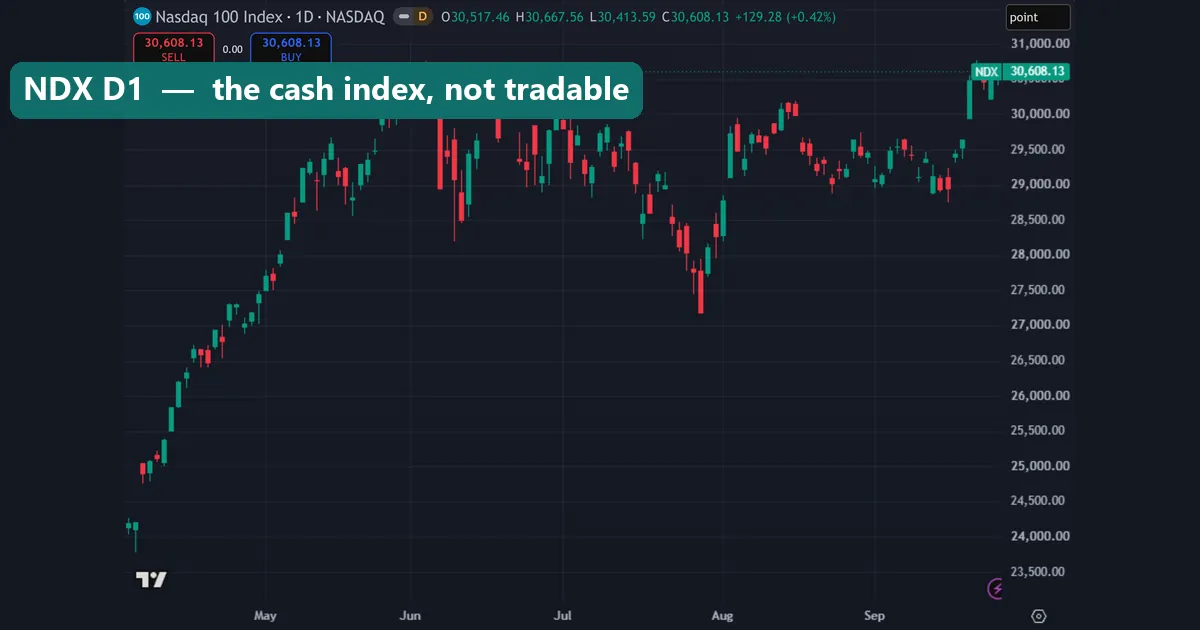
The NASDAQ:NDX chart looks almost the same as NQ, but three details give it away. First, the legend reads “Nasdaq 100 Index, 1D, NASDAQ” and the price scale unit says “point” instead of USD. Second, the buy and sell boxes both show 30,608.13 with a 0.00 gap, because nobody trades the index itself. Third, the status marker is grey, because the cash market was closed when we took the capture.
So why do the prices differ? The index only moves during US cash hours. The futures keep trading overnight, and their price also carries the cost of holding the index until expiry. On our capture, NDX showed 30,608.13 from its last cash session, while NQ1! was already trading in the new week at 30,578.00. That gap changes daily, so never copy levels between the two charts.
Sizing with ATR(14) on the daily chart
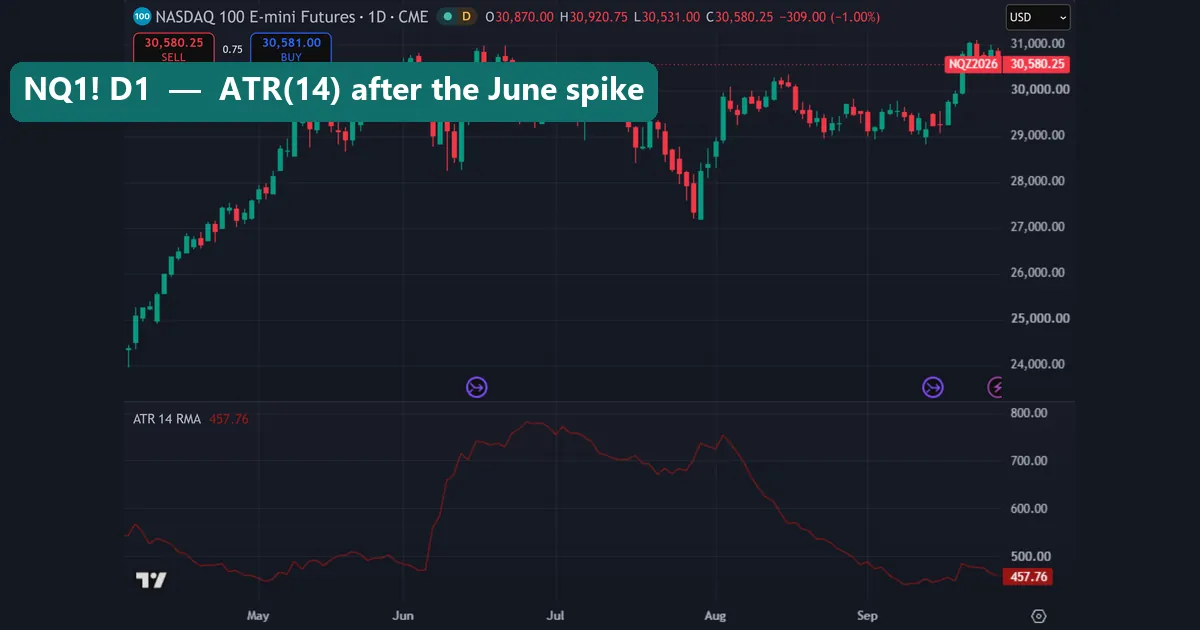
The Average True Range measures how far price travels in a bar, including gaps. TradingView’s default smooths it with RMA over 14 bars, and the pane label reads “ATR 14 RMA”. Our guide to ATR in trading walks through the formula.
The ATR pane on our chart shows a clear story. It sits near 500 in May, jumps in early June after the wide day, and holds just under 800 into late June. Then it drifts lower through August and September. The pane reads 457.76 on our capture, a little under the 463.0 we measured on 25 September, because the capture includes the unfinished 28 September candle. So always check which bar your ATR reading comes from. For stop placement, our page on how to use ATR as a stop loss and our note on ATR position sizing go further.
Download the complete indicator database
Put these concepts on your charts. One email unlocks the full library of 1,380+ indicators with compiled MT4 and MT5 files, plus my TradingView scripts. No paywall, no spam, unsubscribe any time.
Get free access to my indicator database
One email unlocks 1,380+ free MT4, MT5 and TradingView indicators — the complete library. No single-tool download; you get the whole database.
Where it fails
A continuous chart is a stitched chart. At each roll, the price can jump from one contract to the next, even if nothing happened in the market. With back-adjustment on, old prices shift to hide that jump, so the historic levels no longer match what traded at the time. With it off, you may see a fake gap. Neither view is wrong, but they disagree.
Delayed data is the next weak spot. Exchanges charge fees for real-time futures data, and a TradingView plan does not always include them, as TradingView’s own help centre explains. So the orange D badge means your last candle is late. That matters little on a daily chart, but it matters a lot on a one-minute chart near the US open.
Our own numbers have limits too. The hourly averages cover three weeks, and one busy week can tilt them. Also, ATR looks backward: after the June spike it stayed high for weeks, even as days calmed down. Finally, overnight hours are thin. A range that looks tidy at 02:00 UTC can break in seconds once New York opens.
Session VWAP and the weekly view
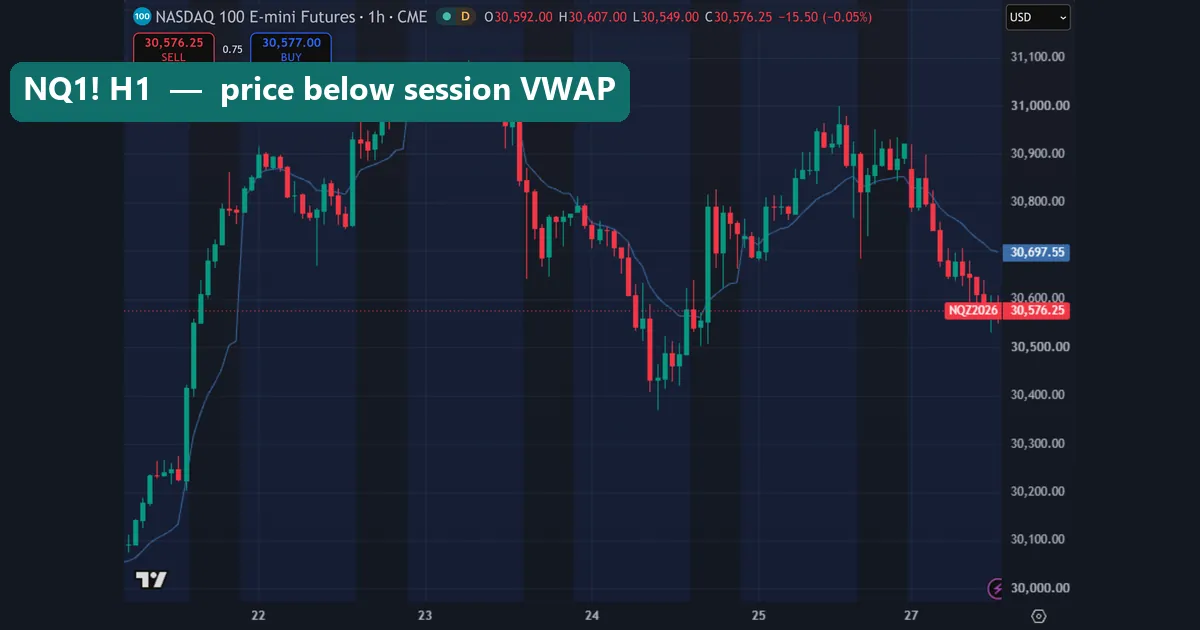
VWAP is the average price weighted by volume. On our hourly chart the legend reads “VWAP Session hlc3” at 30,697.55, while price sits lower at 30,576.25. So price was trading below the session average at that moment. That reset follows the futures session, which starts in the evening, not at the 9:30 cash open. For a line that starts where you choose, see our comparison of anchored VWAP vs VWAP, or check the math with our VWAP calculator.
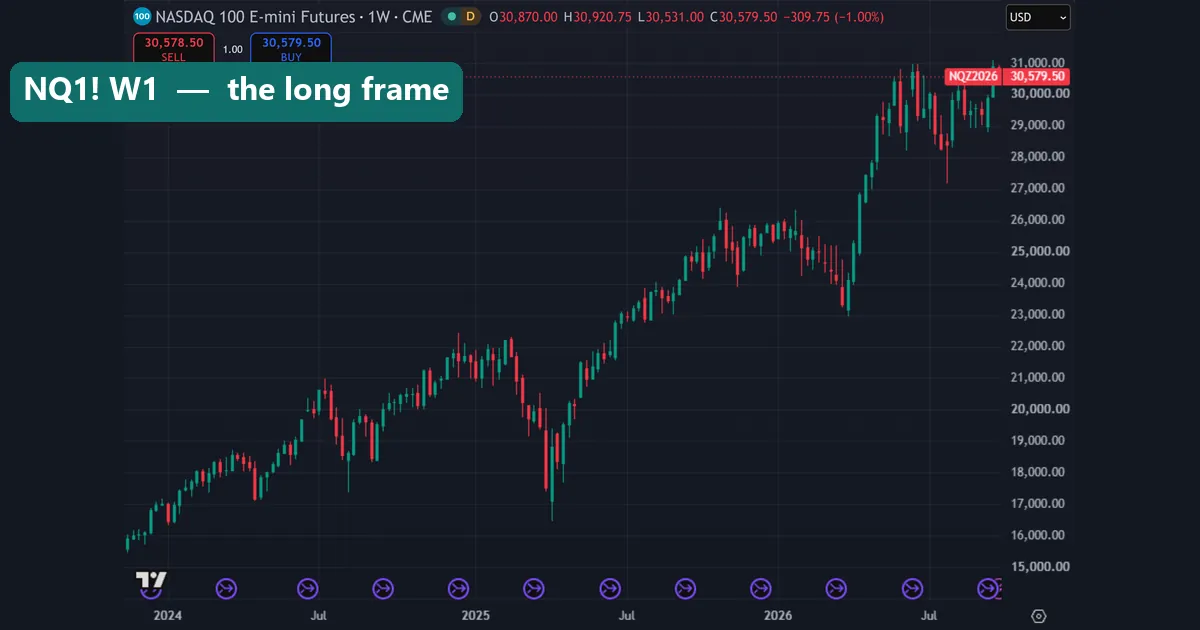
The weekly chart gives the long frame. It runs from early 2024 on the left, and the spring 2025 selloff is the deepest dip on it. Then comes the steep climb in April and May 2026, and a choppier range above 28,000 since June. Our measured low of 22,775 on 1 August 2025 and high of 31,094.75 on 23 September 2026 both sit inside this frame. In short, use the weekly for context and the hourly for timing.
Common mistakes
- Mixing NQ and MNQ dollar values. The chart levels match, but NQ pays $20 per point and MNQ pays $2. A stop of 100 points is $2,000 on NQ and $200 on MNQ.
- Drawing levels on NDX and trading them on NQ. The two prices differ, and the gap moves daily. Draw your levels on the symbol you trade.
- Ignoring the roll. NQ1! switches contract each quarter. If you hold a dated contract, check NQ2! before expiry, and note that back-adjustment changes old prices.
- Reading a delayed feed as live. The D badge means late data. For entries near the US open, that delay can cost more than the spread.
Also, watch the Sunday reopen. Futures can open away from Friday’s close, much like the weekend gap in forex.
Where to go next
If you trade the open, an opening range breakout indicator marks the first range of the session for you. To line up the 13:00 and 14:00 UTC hours with your own clock, use our forex time zone converter.
For outside reading, the CFTC’s basics of futures trading covers margin, expiry and risk from the regulator’s side. For the general mechanics of expiry and settlement, see the futures contract article on Wikipedia.
FAQ: TradingView Nasdaq 100 futures
What is the TradingView symbol for Nasdaq 100 futures?
Use CME_MINI:NQ1! for the E-mini front month and CME_MINI:MNQ1! for the micro; a dated contract such as NQZ2026 shows one expiry only.
What does the 1! in NQ1! mean?
It marks a continuous chart of the nearest contract, so NQ1! follows the front month and NQ2! follows the next one.
How much is one point on NQ and MNQ?
One point is $20 on NQ and $2 on MNQ, and one 0.25-point tick is $5 on NQ and $0.50 on MNQ.
Why does NQ1! differ from NASDAQ:NDX?
NDX is the cash index and moves only in US cash hours, while NQ trades nearly all day and its price also reflects the time left to expiry.
Why does my NQ chart show a D next to the symbol?
The orange D badge means the exchange feed is delayed, because real-time CME data needs a separate data subscription on TradingView.
Which hours are the busiest for Nasdaq 100 futures?
In our September sample the 13:00 and 14:00 UTC hours were the widest, at 157.8 and 146.9 points on average, around the US cash open.
How big is a normal day on NQ?
ATR(14) was 463.0 points on 25 September 2026 and the average daily range was 472.2 points, which is about $9,260 per NQ contract.
Can I trade Nasdaq 100 futures from TradingView charts alone?
The chart shows the market, but trading needs a futures account with a regulated firm, and you should size each position for the swings shown above, because results are not guaranteed; past performance is not indicative of future results.
Last updated: 28 September 2026.

About the author
Written by Dominic Walsh, a Forex trader and MT4/MT5 indicator, Expert Advisor and script developer. Every tool on forexmt4systems.com is tested on live charts before release and ships with ready-to-use compiled MT4 (.ex4) and MT5 (.ex5) files. Learn more about the trader and developer behind this site.
How we build, test and correct every tool: Editorial & Testing Policy. Trading carries risk; see the disclaimer.