
TradingView real time data is free for some markets and late for others, and the chart tells you which one you have if you know where to look. This guide settles three things. First, which feeds ran live and which ran late on our own account on 1 October 2026. Next, how to spot a delayed feed on the chart in two seconds. Finally, why this matters more for a forex trader than most people expect. The short answer: our spot FX, crypto and two TVC feeds showed no delay. Every futures contract we opened, plus the S&P 500, the DAX and Apple, showed a delay notice.
What real-time and delayed mean on TradingView
A real-time feed sends each new price to your chart as soon as the source publishes it. A delayed feed sends the same prices, but only after a set wait. So the candles look normal. They are simply behind the market.
The source matters here. Exchanges such as CME own their price data and charge fees for live access. That trade in prices is a business of its own, as the market data article on Wikipedia explains. Spot forex works differently. There is no central exchange for currencies. Instead, banks and brokers quote each other over the counter, and the BIS Triennial Survey of OTC foreign exchange turnover shows how large that dealer market is. So an FX feed on TradingView is a broker’s or data vendor’s own quote stream, not an exchange tape.
That split explains most of what we saw. Broker FX feeds and crypto exchange feeds reached our chart live. Exchange-owned data for futures, indexes and stocks reached it late.
How TradingView decides which feed you get
Every TradingView symbol has two parts: a feed prefix and a ticker. For example, OANDA:EURUSD is the OANDA feed for EURUSD. CME_MINI:NQ1! is the CME feed for the front Nasdaq 100 E-mini contract. If your account has no live package for that exchange, TradingView swaps in a delayed version of the same feed.
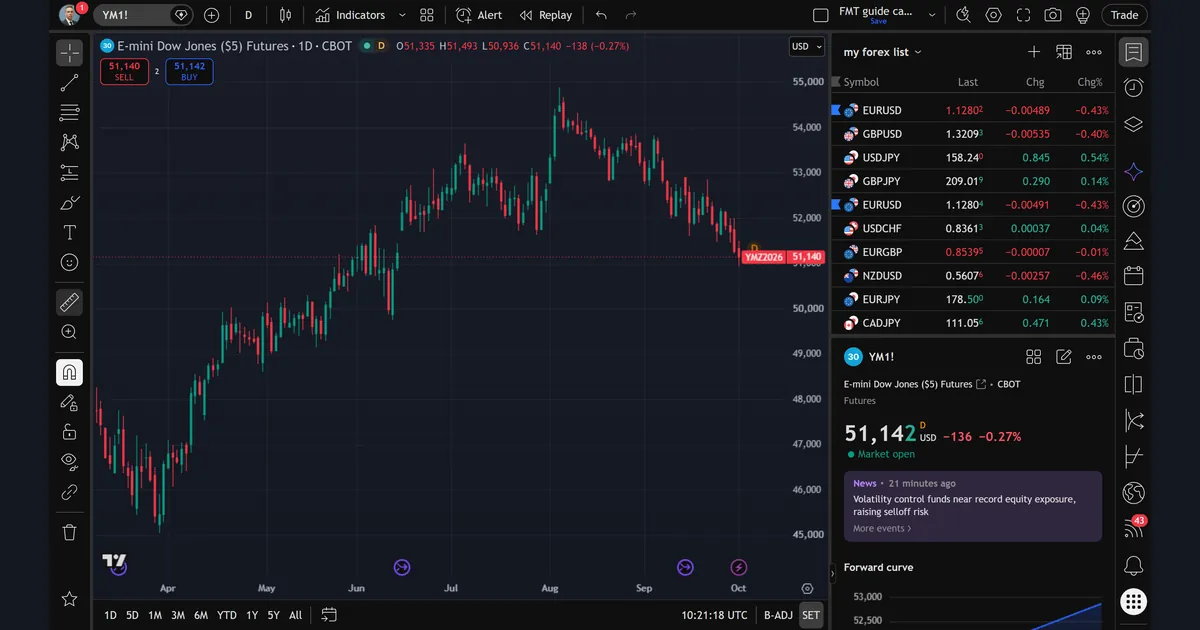
You can see the swap in the symbol name. We asked for CBOT_MINI:YM1!, but the chart resolved it to CBOT_MINI_DL:YM1!. The “_DL” suffix marks the delayed copy. Likewise, SP:SPX became SP_DLY:SPX and XETR:DAX became XETR_DLY:DAX.
The age of a quote is simple arithmetic. If a feed carries a delay of d minutes, the price you see at time t is the price the market printed at t minus d. So a delayed candle closes d minutes after the real one. Your indicators, alerts and drawings all work on that older price.
TradingView sells live packages per exchange, and its help page on buying additional market data at TradingView lists how that works. It also notes that most stock and futures exchanges charge for live data, while its crypto exchanges stream live. We do not quote prices or delay lengths here, because they change and differ by exchange.
How we tested TradingView real time data
On 1 October 2026 we opened 15 symbols on the site’s own TradingView account. We used the TradingView web chart with no extra data packages. For each symbol we recorded the feed name the chart resolved to and the status text TradingView displayed next to it.
Then we took seven screenshots between 10:21:18 and 10:21:59 UTC, as the clock in each image shows. They cover CBOT_MINI:YM1! daily, OANDA:EURUSD daily, CME_MINI:NQ1! hourly, SP:SPX daily, the symbol search box, NASDAQ:AAPL daily and BINANCE:BTCUSDT hourly. Also, we added no indicators, so the legend shows only price and status. Our editorial testing policy describes how we capture and check every chart.
One limit applies from the start. This is one account, one day and one region. Your account may show different results, because data rights depend on your plan, your country and any packages you hold.
What each feed showed on 1 October 2026
The “status” column is the exact text TradingView showed for each symbol at the time we read it.
| Market | Symbol we asked for | Feed the chart used | Status text |
|---|---|---|---|
| Spot FX | OANDA:EURUSD | OANDA:EURUSD | Market open |
| Spot FX | FX:EURUSD | FX:EURUSD | Market open |
| Crypto | BINANCE:BTCUSDT | BINANCE:BTCUSDT | Market open |
| Volatility index | TVC:VIX | TVC:VIX | Market open |
| Crude oil CFD | TVC:USOIL | TVC:USOIL | Market open |
| Dow index | TVC:DJI | TVC:DJI | Market closed |
| Dow futures | YM1! | CBOT_MINI_DL:YM1! | Market open, Data is delayed |
| Nasdaq 100 futures | NQ1! | CME_MINI_DL:NQ1! | Market open, Data is delayed |
| S&P 500 futures | ES1! | CME_MINI_DL:ES1! | Market open, Data is delayed |
| Crude oil futures | CL1! | NYMEX_DL:CL1! | Market open, Data is delayed |
| Gold futures | GC1! | COMEX_DL:GC1! | Market open, Data is delayed |
| Euro FX futures | 6E1! | CME_DL:6E1! | Market open, Data is delayed |
| S&P 500 index | SP:SPX | SP_DLY:SPX | Market closed, Data is delayed |
| DAX index | XETR:DAX | XETR_DLY:DAX | Market open, Data is delayed |
| Apple stock | NASDAQ:AAPL | BATS:AAPL | Quotes are delayed by 15 min |
Note the euro row. OANDA:EURUSD ran live, but the euro futures contract 6E1! ran late. So the same currency pair can be live or late, depending on the feed you pick.
Reading the delay badge on a chart
The fastest check sits in the legend, the line of text at the top left of the chart. A live feed shows the symbol name, a small coloured dot for market status and the OHLC values. A delayed feed adds a small orange “D” right after that dot.
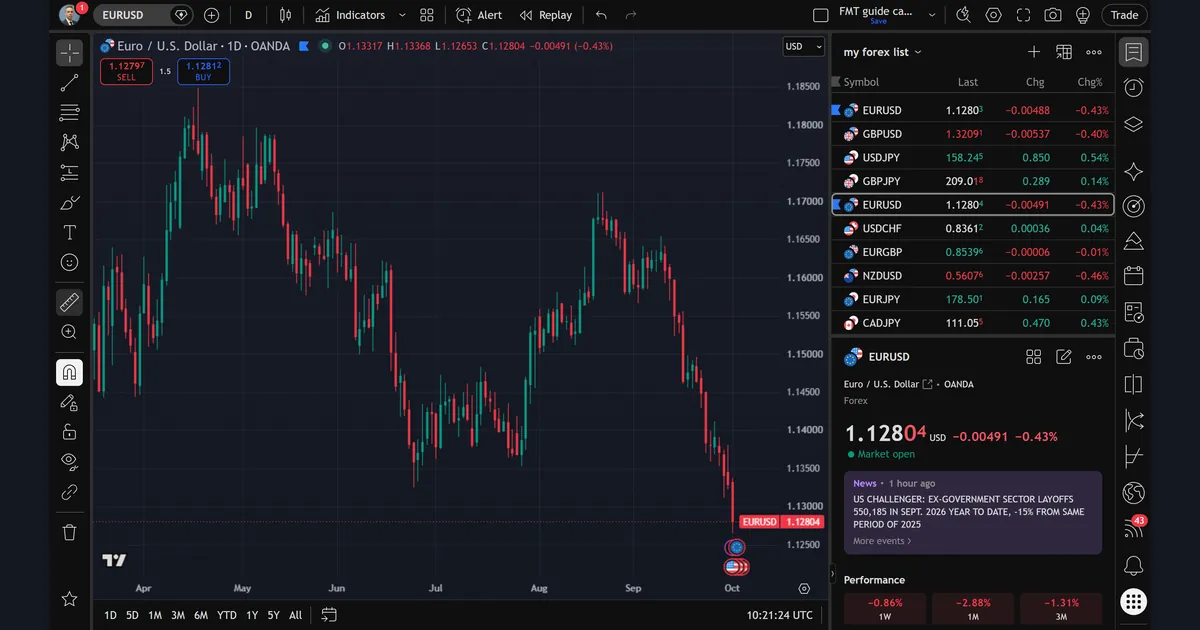
On OANDA EURUSD daily, the legend reads “Euro / U.S. Dollar, 1D, OANDA”, then a green dot, then the prices. There is no “D”. The side panel says “Market open”, and the last price, 1.12804, also has no letter beside it.
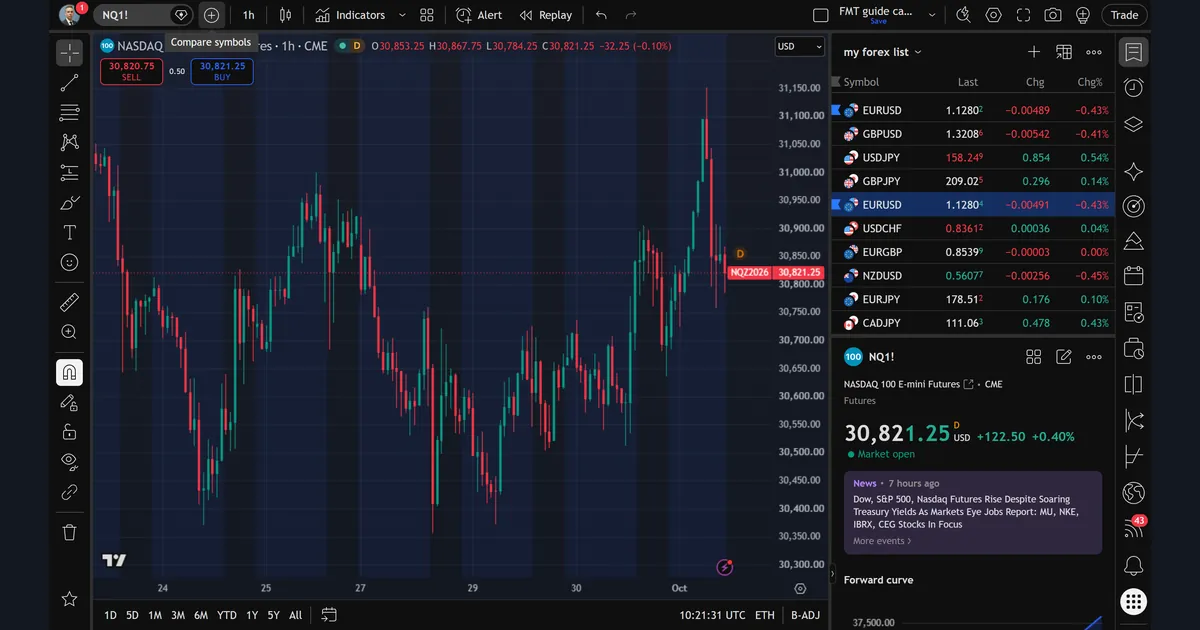
Now compare the Nasdaq 100 E-mini on the hourly chart. The orange “D” sits in the legend after the green dot. It shows again as a small superscript beside the panel price of 30,821.25. A third “D” floats next to the last candle. Also, the price label on the axis names the contract, NQZ2026, so you know which expiry the chart follows. One note on this image: a “Compare symbols” tooltip covers part of the title. The badge is still in plain view.
In short, check three spots: the legend, the panel price and the right edge of the chart. If none of them shows a “D”, the feed ran live on our account.
Worked example: what a delay hides on a fast chart
Numbers make the problem clear. Take the NQ1! hourly bar in our screenshot. It printed a high of 30,867.75 and a low of 30,784.25. That is a range of 83.50 points inside one hour.
Next, look at the stock row in our table. For Apple, TradingView told us the quotes ran 15 minutes late. A 15-minute delay is one quarter of an hour bar. So on a bar like that NQ candle, a quarter of the hour’s travel can be missing from your screen. We did not measure the delay length on the futures feeds, so we will not guess it. Still, the logic is the same for any delay you see.
Now compare EURUSD on the live OANDA feed. The daily bar ran from 1.13368 down to 1.12653, a range of 71.5 pips. Our chart showed that move as it happened. Also, the trading buttons showed 1.12797 to sell and 1.12812 to buy, a 1.5 pip gap. Those are live bid and ask prices, so the spread you read is the spread that existed at that moment.
The lesson is plain. A delayed chart is fine for study, but not for timing. If your entry depends on the last few minutes, you need the live feed.
Why delayed data matters for forex traders
Most forex traders chart spot pairs, and those ran live for us. So why care? Because many FX setups lean on other markets.
For example, traders watch the Dow, the S&P 500 and the Nasdaq for risk mood. They watch gold and oil for commodity currencies. Some also watch the euro futures for volume. Every one of those futures charts ran late on our account. So a trader who sees “the Nasdaq just broke out” on a delayed chart is reading old news, while the EURUSD chart beside it is current.
That mismatch hurts most around data releases. During a forex news spike, prices move in seconds. A delayed index chart cannot confirm what a live FX chart is doing. Then there are alerts. An alert can only see the prices its own feed receives. So an alert on a delayed NQ1! feed fires when the delayed price touches your level, not the real one. TradingView’s help centre also notes that the alerts manager marks delayed symbols with the same “D”.
There is a simple fix for cross-market checks. Use the live TVC or broker CFD symbols where they exist. For instance, TVC:USOIL and TVC:VIX both showed no delay for us, while NYMEX_DL:CL1! did. Our guides to crude oil on TradingView and the TradingView VIX chart cover those symbols in detail.
Closed markets and the symbol search
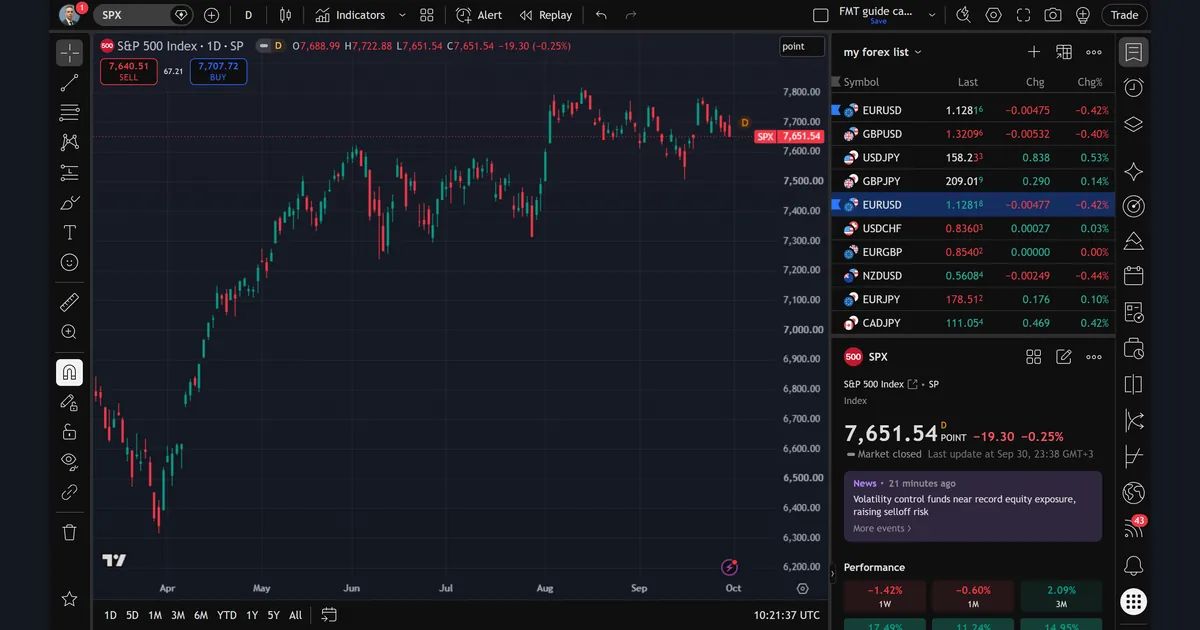
A delayed feed and a closed market are two different states, and the S&P 500 chart shows both at once. The legend has a grey dash instead of a green dot, which means closed. The orange “D” still follows it. The panel reads “Market closed” and “Last update at Sep 30, 23:38 GMT+3”. So the last price, 7,651.54, was the prior session’s close.
The trading buttons on that chart showed 7,640.51 and 7,707.72, a 67.21 point gap. Do not read that as a real spread. The cash index was not trading, so those figures tell you nothing about live prices.
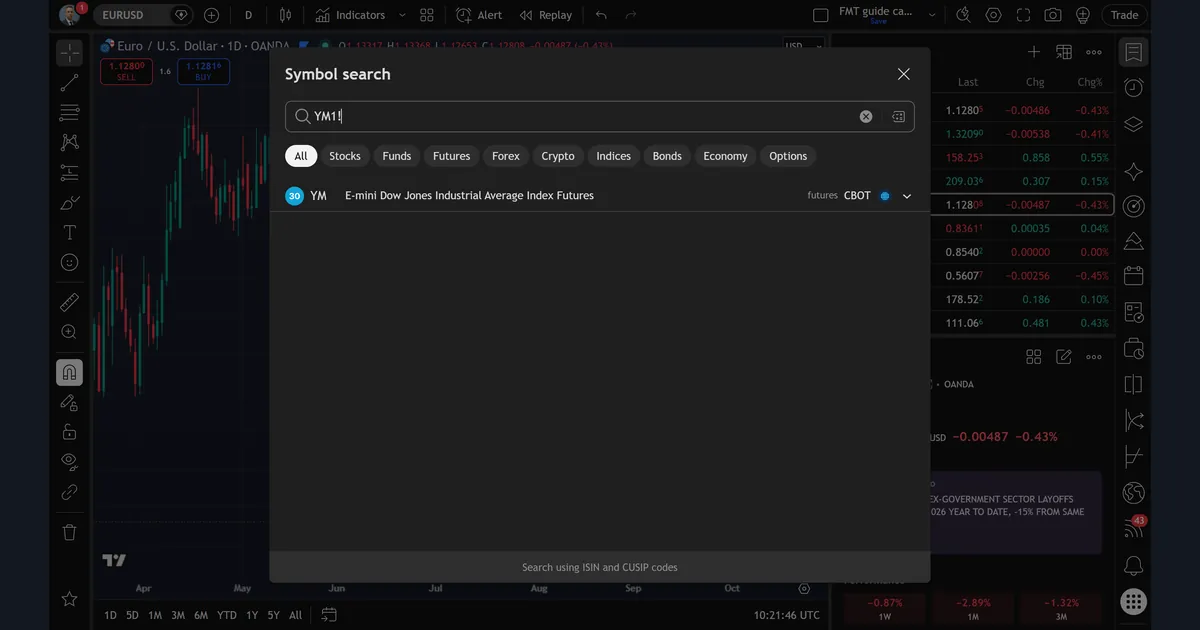
The symbol search does not warn you either. We typed “YM1!” and got one result: E-mini Dow Jones Industrial Average Index Futures, futures, CBOT. Nothing in that row says “delayed”. You only learn it after the chart loads and the “D” appears. So always check the legend after you switch symbols. Our TradingView chart walkthrough covers symbol search and feeds step by step.
Download the complete indicator database
Put these concepts on your charts. One email unlocks the full library of 1,380+ indicators with compiled MT4 and MT5 files, plus my TradingView scripts. No paywall, no spam, unsubscribe any time.
Get free access to my indicator database
One email unlocks 1,380+ free MT4, MT5 and TradingView indicators — the complete library. No single-tool download; you get the whole database.
Where it fails: limits of this check
The badge check is quick, but it has real gaps.
First, “no D” does not mean “no lag”. A live broker FX feed still depends on that broker’s quotes. Two FX feeds can differ by a fraction of a pip at the same second. Your own broker in MetaTrader may also differ from any TradingView feed.
Second, our test is one snapshot. We read the status once per symbol on one day. Data rights change, and a different plan or country may give different results.
Third, the screenshots cannot show delay length. The “D” says “late”, not “how late”. We only saw an exact figure for Apple, where the status text said 15 minutes.
Fourth, the Apple screenshot does not show a delay badge in the legend. The status text we read for BATS:AAPL said the quotes ran 15 minutes late. Yet the image shows a pre-market quote with a recent update time. We cannot square those from the picture alone, so we rely on the status text.
Finally, a closed market can hide the question. On a closed index, live and delayed look the same until the session opens.
Stocks and crypto: two more cases
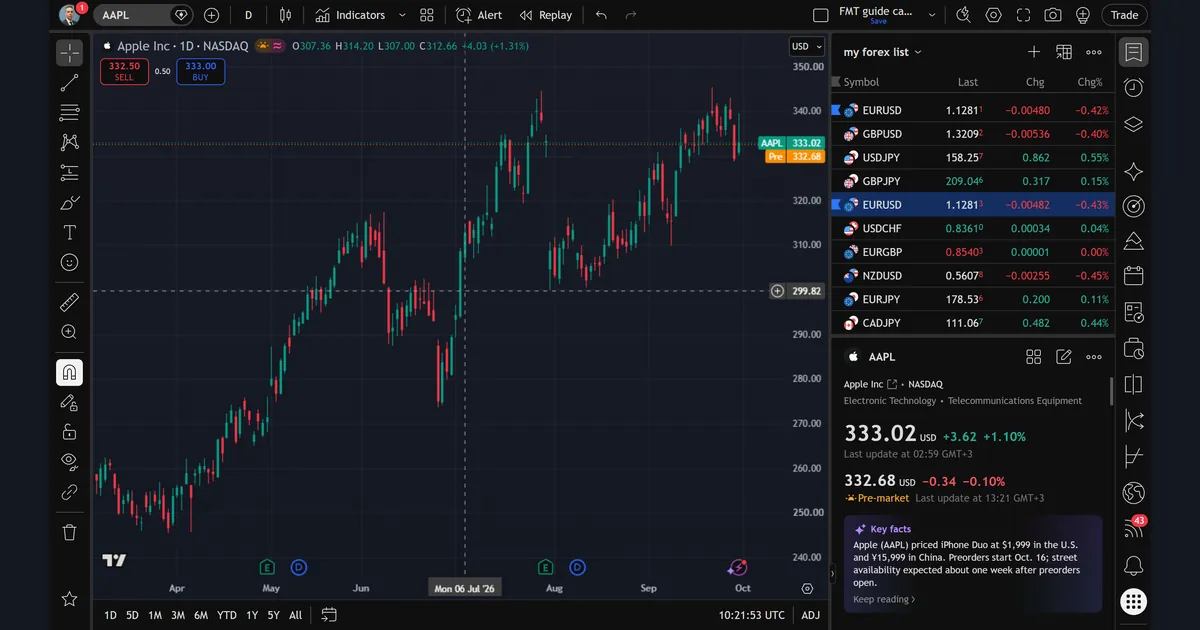
Apple shows how stock charts add another layer. The legend reads “Apple Inc, 1D, NASDAQ”, followed by a small sun icon for the pre-market session. The side panel shows two prices. The regular close was 333.02, up 3.62 or 1.10%, with a last update at 02:59 GMT+3. Below it, the pre-market price was 332.68, down 0.34 or 0.10%, last updated at 13:21 GMT+3. The OHLC values in the legend belong to 6 July 2026, because our crosshair sat on that bar.
So on a stock chart, read the panel, not just the legend. It tells you which session the price comes from and when it last changed.
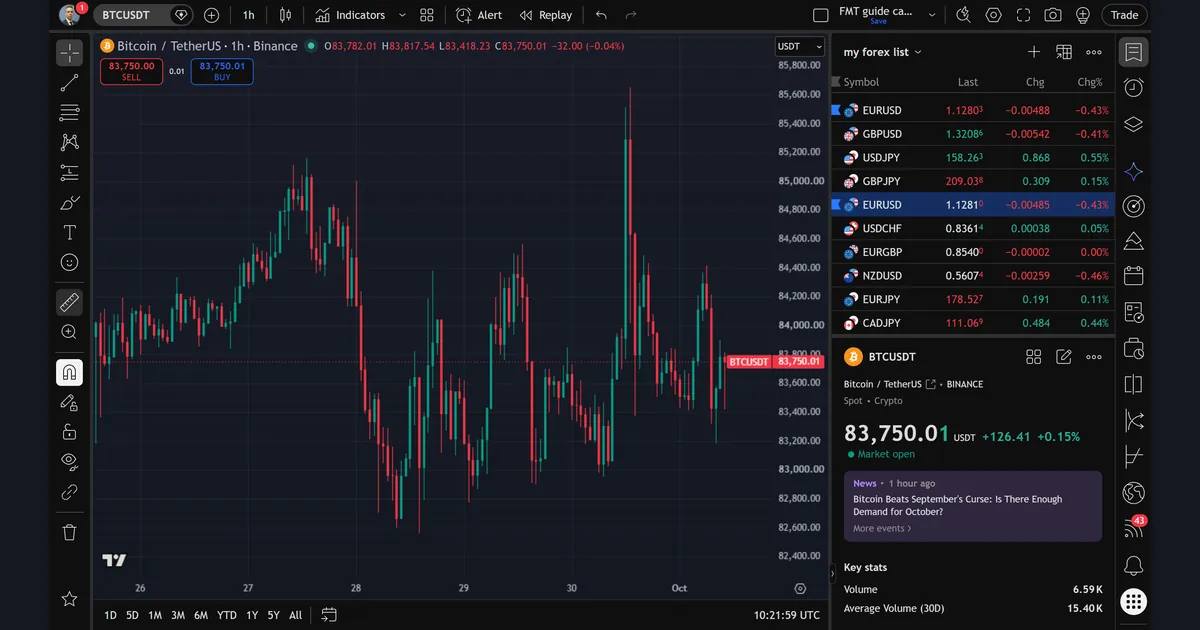
Bitcoin on Binance is the clean case. The hourly legend shows a green dot and no “D”. The panel says “Market open” at 83,750.01, and the buttons showed 83,750.00 and 83,750.01, one cent apart. That matches TradingView’s own statement that its crypto exchanges stream live.
Common mistakes with delayed data
We see four errors again and again.
- Trusting the symbol search. The search row does not flag a delay. Check the legend after the chart loads, every time.
- Timing FX entries off a delayed index. A late Nasdaq or Dow chart can lag your live EURUSD chart. Use it for direction over hours, not for a trigger.
- Setting alerts on a “_DL” feed. The alert fires on delayed prices. If timing matters, move the alert to a live symbol. Our guide to planning risk and reward on TradingView shows how to set levels you can act on.
- Treating a closed market as live. A grey dash means no trading. Any buy and sell figures on that chart are not a tradable spread.
Where to go next
If futures are your context market, read our Nasdaq 100 futures on TradingView guide first, because it explains the contract roll that NQ1! follows. Then see how the VIX relates to forex, since TVC:VIX ran live for us.
For news timing, our page on trading the NFP release and the economic calendar help you know when seconds matter. Also, slippage in trading explains the cost of acting on a stale price.
If you write your own scripts, the Pine Script documentation guide is a good start. For a ready-made tool that marks gaps on a TradingView chart, see the Gap Hunter Pro TradingView indicator. For the index behind the VIX symbol, Cboe’s own VIX index page at Cboe is the primary source.
FAQ: TradingView real time data
Is TradingView forex data real-time?
On our account, yes. OANDA:EURUSD and FX:EURUSD both showed “Market open” with no delay badge on 1 October 2026. Euro futures (6E1!) ran late, though.
How do I know if a TradingView chart is delayed?
Look for a small orange “D” after the status dot in the legend. It also appears beside the panel price and near the last candle.
Why does my symbol name end in _DL or _DLY?
That suffix marks the delayed copy of an exchange feed. We saw it on CME, CBOT, NYMEX, COMEX, the S&P index and the Xetra DAX.
Is crypto data on TradingView delayed?
Not in our test. BINANCE:BTCUSDT showed a green dot and no “D”, and TradingView states that its crypto exchanges stream live.
How long is the delay on futures?
We did not measure it, and it varies by exchange. TradingView’s help pages on market data list the details for each feed.
Do alerts work on delayed symbols?
Yes, but an alert reads the same feed as the chart. So an alert on a “_DL” feed fires on the delayed price, after the real market touched your level.
Can I chart oil or the VIX live without a data package?
On our account TVC:USOIL and TVC:VIX showed no delay, while NYMEX_DL:CL1! did. Check the legend on your own account to confirm.
Should I trade off a delayed chart?
Use delayed charts for study and context, not for entry timing; trading involves risk, and results are not guaranteed; past performance is not indicative of future results.
Last updated: 1 October 2026.

About the author
Written by Dominic Walsh, a Forex trader and MT4/MT5 indicator, Expert Advisor and script developer. Every tool on forexmt4systems.com is tested on live charts before release and ships with ready-to-use compiled MT4 (.ex4) and MT5 (.ex5) files. Learn more about the trader and developer behind this site.
How we build, test and correct every tool: Editorial & Testing Policy. Trading carries risk; see the disclaimer.