
Pine Script documentation is two separate things, and most people only find one of them. TradingView publishes a v6 Reference Manual that lists every built-in function, and a User Manual that explains how the language runs. This guide settles which one to open for which question, how to read a single entry, and which sections a working indicator author opens most. We base it on the 102 Pine sources behind our own published TradingView scripts, not on guesswork.
What Pine Script documentation actually is
Pine Script is TradingView’s own language for indicators and strategies. So its documentation lives on tradingview.com, not on a third-party site. It comes in two parts, and each has a different job.
First, the Reference Manual is a dictionary. It lists types, variables, constants, functions, keywords, operators and annotations. Each entry is short and follows the same layout. Open it when you need an exact signature.
Second, the User Manual is a textbook. It covers the execution model, the type system, visuals, alerts, errors and migration between versions. Open it when a script compiles but acts oddly.
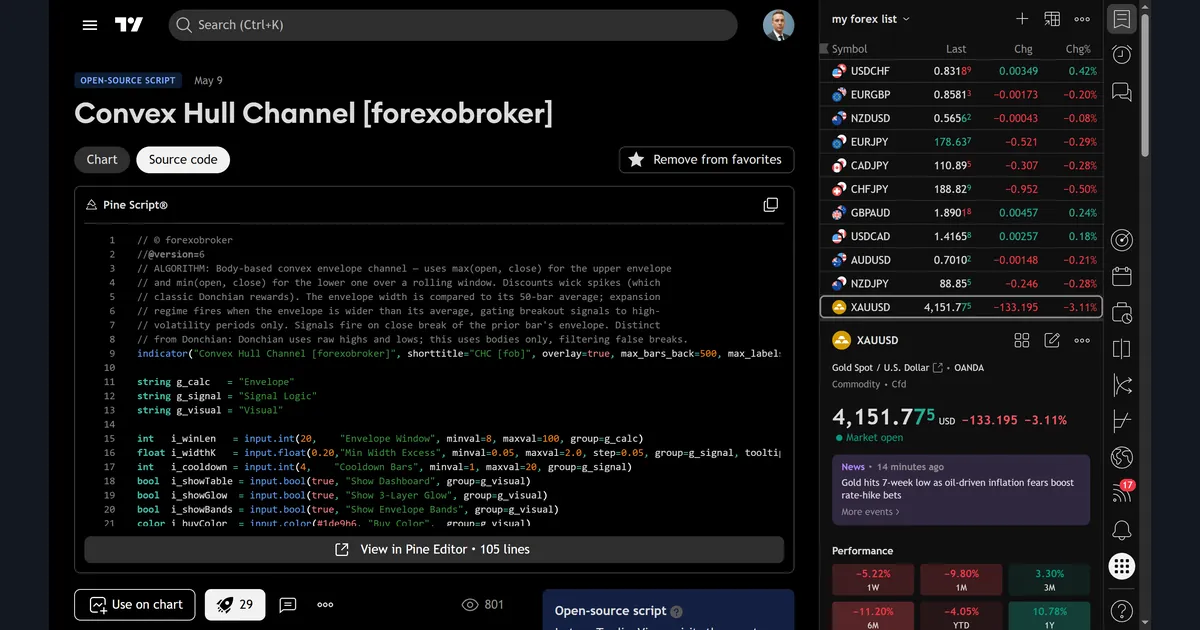
Many readers miss a third source: open-source community scripts. Every open-source script page has a “Source code” tab. For example, the page for our Convex Hull Channel shows the code with a “View in Pine Editor” button and a line count of 105. Our own write-up of that script sits on the Convex Hull Channel TradingView indicator page.
How the Pine Script documentation is organised
The key idea is the namespace. Functions that belong together share a prefix, so ta.atr() sits in the ta namespace for technical analysis, and math.max() sits in math. Once you know the prefix, you know where to look.
Each function entry then answers five questions in a fixed order:
- Syntax: the call and its return type, for example
ta.atr(length) → series float. - Arguments: each parameter with its qualifier and type, such as
length (simple int). - Example: a short, runnable v6 script.
- Returns: what comes back, in plain words.
- Remarks: the edge cases, such as how
navalues are handled.
Some entries also carry the formula. The ATR entry, for instance, states that ATR is the RMA of true range, where true range is max(high - low, abs(high - close[1]), abs(low - close[1])). That matches the definition of average true range on Wikipedia, which traces it back to J. Welles Wilder.
Finally, the version matters. Both manuals have a version selector, and ours showed “Version 6”. All 102 of our scripts start with //@version=6, so that is the manual we read.
How we tested
We scanned the 102 Pine files we keep for our published TradingView scripts. The profile has 114 public scripts; 102 of the sources sit on our disk. For each file we recorded the version line, the line count and every namespaced call. Then we counted how many scripts use each call at least once.
Next, we opened the documentation itself. On 28 September 2026 we captured the v6 Reference Manual start page, the ta.atr() entry, the User Manual welcome page and the “Built-ins” page. We also captured the Convex Hull Channel script page, both its “Source code” and “Chart” tabs, and the Indicators dialog on a TradingView web chart.
The script page chart shows EURUSD on the 30-minute timeframe from FXCM, with the axis running from early May to 10 May. The Indicators dialog sits on an OANDA EURUSD daily chart. We describe only what those captures show. The rules we follow for every test are on our editorial testing policy page.
Which reference sections a working author opens most
Here is the scan result. All 102 scripts use version 6. The median script is 176 lines long, the shortest 99 and the longest 656. The table maps each namespace to its manual section.
| Namespace | Scripts using it (of 102) | Reference Manual section | Typical use in our scripts |
|---|---|---|---|
| input | 102 | Functions: input.* | Settings panel: input.bool, input.int, input.float, input.color |
| table | 102 | Functions: table.* | On-chart dashboard via table.new and table.cell |
| str | 102 | Functions: str.* | str.tostring for numbers in the dashboard |
| color | 101 | Functions: color.* | color.new for transparency |
| ta | 97 | Functions: ta.* | ta.atr, ta.ema, ta.sma, ta.crossover |
| math | 86 | Functions: math.* | math.max, math.abs, math.min |
| label | 40 | Types and Functions: label | Text markers on bars |
| array | 29 | Types and Functions: array | Rolling lists of pivots or levels |
| line | 21 | Types and Functions: line | Drawn levels |
| box | 19 | Types and Functions: box | Zones |
| request | 6 | Functions: request.* | Data from other timeframes |
| strategy | 1 | Functions: strategy.* | Backtest orders |
Two more facts stand out. First, all 102 scripts call alertcondition and use the var keyword, so the Annotations and Keywords sections matter too. Second, plotshape appears in 94 scripts. By call volume, table.cell leads with 2,006 calls, then color.new with 1,531 and str.tostring with 1,100.
Reading the docs against a live chart
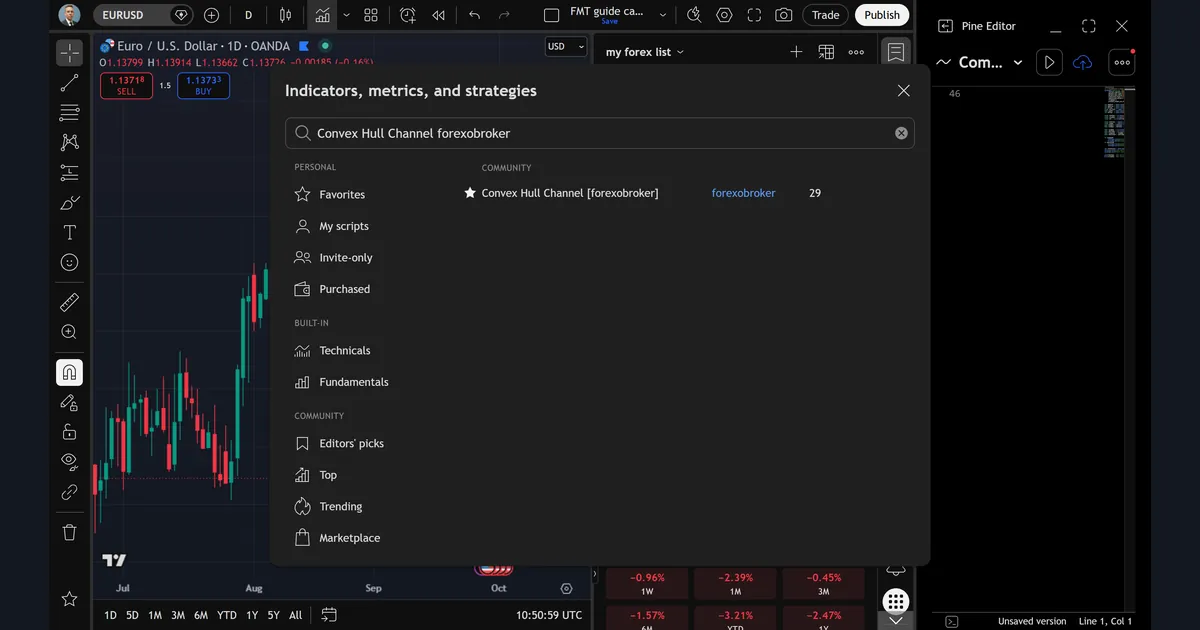
The manual makes more sense when a script is running in front of you. So the first step is to load a published script. Open the Indicators dialog, type the name, and look under “Community”. Our search for “Convex Hull Channel forexobroker” returned one community result, with the author name and a count of 29 next to it.
Next, look at the script page’s “Chart” tab. It shows the script running with its default inputs. The status line reads CHC [fob] 20 0.2 4, which are the three numeric inputs: an Envelope Window of 20, a Min Width Excess of 0.20 and a Cooldown of 4 bars.
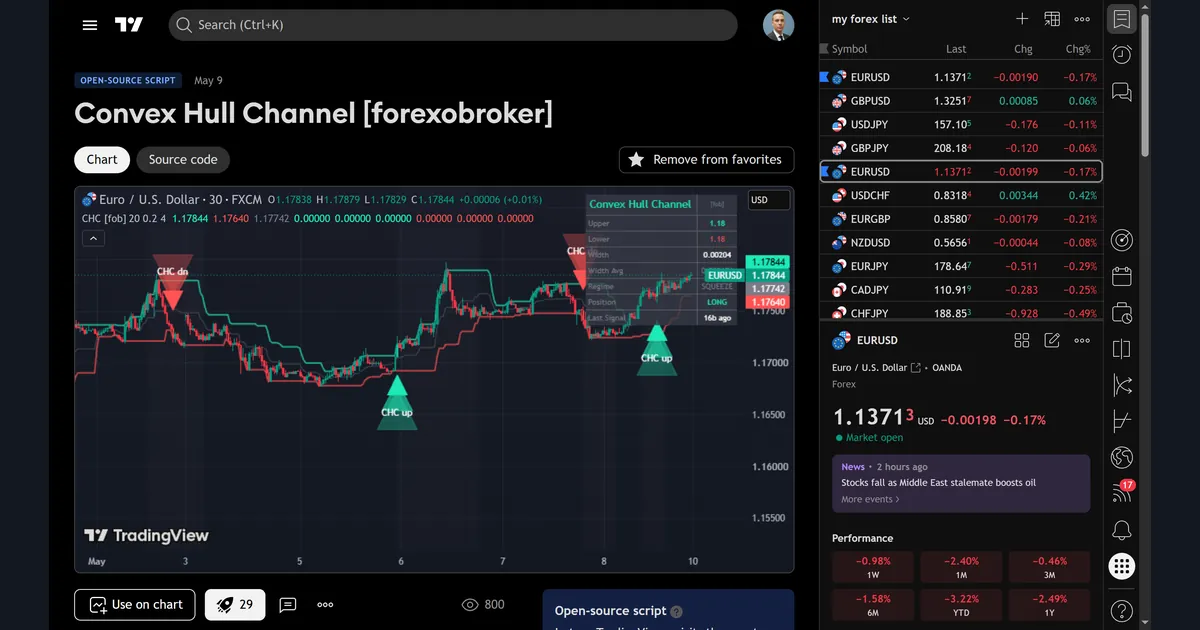
Because the inputs are visible there, you can check each one against its input.int or input.float entry in the manual. That is how you learn what minval, maxval and step do. If you trade from TradingView charts, our guide to setting risk and reward on TradingView covers the drawing tools that sit next to scripts.
Worked example: tracing one script through the manual
Here is the core of Convex Hull Channel, taken from our own open-source file:
int   i_winLen = input.int(20, "Envelope Window", minval=8, maxval=100, group=g_calc)
float bodyHi   = math.max(open, close)
float upper    = ta.highest(bodyHi, i_winLen)
float lower    = ta.lowest(bodyLo,  i_winLen)
float width    = upper - lower
float widthMa  = ta.sma(width, 50)
bool  crossUp  = ta.crossover(close, upper[1])
To read it, we opened five entries: input.int, math.max, ta.highest, ta.sma and ta.crossover. Each one answers a specific question. For example, math.max tells you it returns the larger of its arguments, so bodyHi is the top of each candle body. Then ta.highest returns the highest value over the last 20 bars, which gives the upper envelope.
Now check it with the numbers on our chart. The status line shows the upper band at 1.17844 and the lower band at 1.17640. So the width is 1.17844 minus 1.17640, which is 0.00204. The dashboard prints exactly that: Width 0.00204. The midline is the average of the two bands, 1.17742, and the status line shows 1.17742 too.
The dashboard also reads Regime SQUEEZE, Position LONG and Last Signal 16b ago. SQUEEZE means the width is not above its 50-bar average by the 0.20 excess. You confirm that by reading ta.sma and then the comparison line in the source. In short, five reference entries explain the whole signal. The same body-versus-wick idea is explained for MetaTrader in our Donchian channel indicator post, and StockCharts has Donchian trading guidelines at StockCharts ChartSchool.
Anatomy of one reference entry
The Reference Manual opens on “Types”, with array highlighted first. The sidebar then lists Variables, Constants, Functions, Keywords, Operators and Annotations. A search box sits at the top, and a version picker at the bottom.
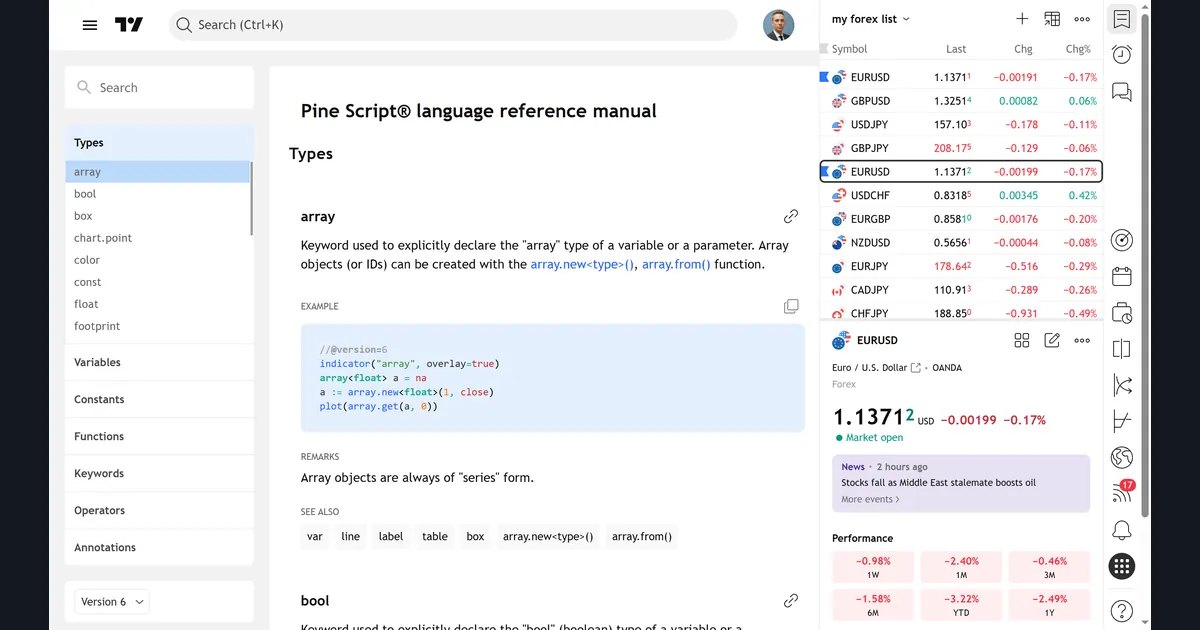
Look at the array entry. It has a description, a short example, a remark that array objects are always of “series” form, and a “See also” row. That row links to var, line, label, table and box.
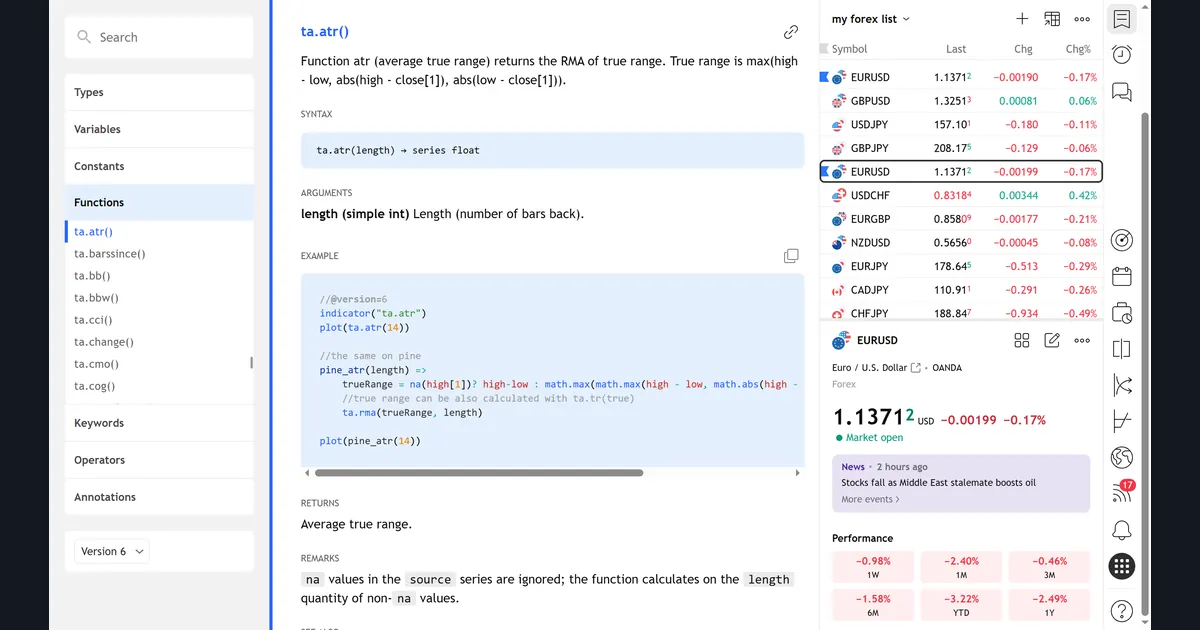
The ta.atr() entry shows the full layout. The syntax line is ta.atr(length) → series float. The single argument is length (simple int), described as the number of bars back. The example plots ta.atr(14), then rebuilds it by hand with ta.rma. The Returns line says “Average true range”. Finally, the Remarks explain that na values are ignored. With 71 of our 102 scripts calling ta.atr, this is one of the entries we open most. For the trading side of ATR, see what ATR is in trading.
Series vs simple: the qualifier that trips people up
Every argument in the manual carries a qualifier in brackets. The common ones are const, input, simple and series. They describe when a value is known.
- const: fixed when the script compiles, such as a literal
14. - input: set by the user in the settings panel.
- simple: known on the first bar and then unchanged.
- series: can change on every bar, such as
close.
The order matters because a weaker qualifier fits where a stronger one is allowed, but not the reverse. So ta.atr accepts an input.int for its length, because an input is fixed for the run. However, a length you compute bar by bar is a series value, and the compiler will reject it there. When you hit that error, read the qualifier in brackets first.
Return types follow the same rule, so a series float result can be plotted or compared. If you work in MetaTrader as well, the MQL5 docs describe the same idea differently: the iATR function in the MQL5 documentation returns a handle, not a value.
Download the complete indicator database
Put these concepts on your charts. One email unlocks the full library of 1,380+ indicators with compiled MT4 and MT5 files, plus my TradingView scripts. No paywall, no spam, unsubscribe any time.
Get free access to my indicator database
One email unlocks 1,380+ free MT4, MT5 and TradingView indicators — the complete library. No single-tool download; you get the whole database.
Where it fails
The documentation is accurate, but it has real gaps. First, the Reference Manual tells you what a function returns, not when to use it. It will not say that ta.crossover can fire on a bar that has not closed yet. Our own script guards against that with barstate.isconfirmed, and you learn that from the User Manual’s execution model page, not from the entry.
Second, the examples are tiny. The array example is five lines. Those limits exist: the User Manual welcome page lists limits on data requested from other symbols, execution time, memory use and script size.
Third, the manual cannot catch a bad formatting choice. Our own dashboard is a clear case. It prints the Upper and Lower values with str.tostring(upper, "#.##"), so on EURUSD both show as 1.18. The format string rounds to two decimals, and that hides the real levels. The entry for str.tostring explains the format argument, but it cannot warn you that two decimals are too few for a currency pair. Only testing on a chart shows it.
Finally, the docs track the current version. Older scripts in v4 or v5 syntax will not match the v6 entries one for one. So you need the migration guides as well.
When to open the User Manual instead
Open the User Manual when the question is “why”, not “what”. Its welcome page states that Pine Script runs on TradingView’s servers, and that the community has published more than 150,000 scripts, half of them open-source. The sidebar lists the primer, Language, Visuals, Concepts, Writing scripts, Errors and warnings, FAQ, Release notes and Migration guides.
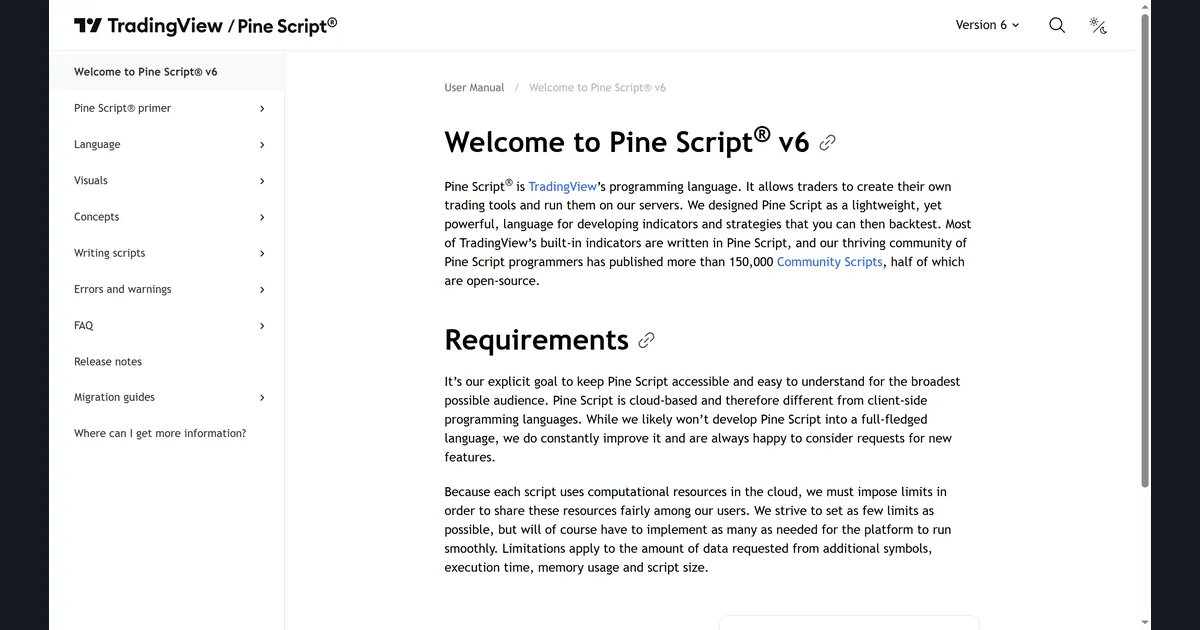
The Language section is where most “why” answers sit. Its sub-pages include the execution model, the type system, script structure, operators, loops, built-ins, user-defined functions, objects and enums.
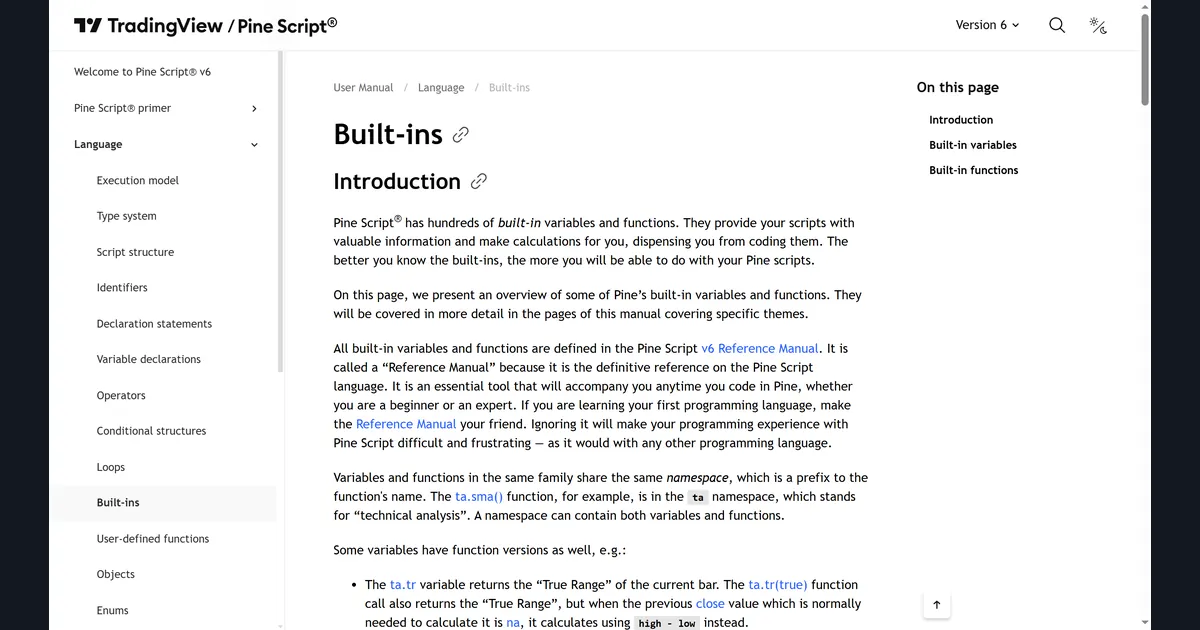
The Built-ins page is a good bridge between the two manuals. It explains that functions in the same family share a namespace, and it names ta.sma() as an example from the ta namespace. It also points back to the Reference Manual as the full list. Our comparison of SMA vs EMA explains the maths behind the two averages our scripts call most after ATR.
Common mistakes when reading the docs
- Reading the wrong version. The manual defaults to the latest, but a search engine may land you on an old page. Check the version picker before you copy anything.
- Skipping the qualifier. People read
lengthand miss(simple int). Then they pass a series value and cannot see why it fails. - Ignoring Remarks. The Remarks hold the edge cases. For
ta.atr, they explain hownavalues are treated, which changes the first bars of your plot. - Copying the example as a finished tool. Reference examples show one call in isolation. A usable indicator also needs inputs, alerts and a check for closed bars, as our scan of 102 scripts shows.
Also, Pine does not behave like MQL. Our guide to the difference between MetaTrader 4 and 5 covers the MetaTrader side.
Where to go next
Start with the official Pine Script v6 Reference Manual at TradingView, and keep it open in a second tab while you code.
For practice material, several of our TradingView scripts use the same small set of calls in different ways. See the Volatility Regime Bands script. The Choppiness Breakout Filter gates signals by regime, much like Convex Hull Channel. And the Squeeze Memory Cone is another squeeze-based design.
On the concept side, read how to use ATR as a stop loss and leading vs lagging indicators. If you also run MetaTrader, our page on how to install MT4 and MT5 indicators covers that platform.
FAQ: Pine Script documentation
Where is the official Pine Script documentation?
It is on tradingview.com, in two parts: the Pine Script v6 Reference Manual for every built-in, and the User Manual for concepts, visuals, errors and migration.
What is the difference between the Reference Manual and the User Manual?
The Reference Manual is a dictionary of functions, types and keywords, while the User Manual explains how scripts run and why they behave as they do.
Which Pine Script version should I read about?
Read the version your script declares on its //@version= line; all 102 of our scripts use version 6, so we read the v6 manuals.
What does “simple int” mean in an entry?
It means the argument must be an integer that is known on the first bar and does not change, such as a literal or an input, but not a per-bar series value.
Which reference entries do indicator authors use most?
In our scan, input, table and str appear in all 102 scripts, color in 101 and ta in 97, with ta.atr in 71 scripts and ta.ema in 65.
Can I read the source of other people’s scripts?
Yes, if the script is open-source: its page has a “Source code” tab and a “View in Pine Editor” button, as our Convex Hull Channel page shows.
Does the documentation explain trading strategy?
No, it explains the language; it tells you what ta.crossover returns but not whether a crossover is a good trade, so you still need to test on charts.
Will learning the docs make my scripts profitable?
No, the docs help you write correct code, but a correct indicator can still give poor signals in live markets; results are not guaranteed; past performance is not indicative of future results.
Last updated: 28 September 2026.

About the author
Written by Dominic Walsh, a Forex trader and MT4/MT5 indicator, Expert Advisor and script developer. Every tool on forexmt4systems.com is tested on live charts before release and ships with ready-to-use compiled MT4 (.ex4) and MT5 (.ex5) files. Learn more about the trader and developer behind this site.
How we build, test and correct every tool: Editorial & Testing Policy. Trading carries risk; see the disclaimer.