
Breakouts fail most often inside ranges. Also, choppiness Breakout Filter is a choppiness index indicator TradingView traders can use as a regime gate. It computes the classic Choppiness Index over 14 bars. Indeed, it then lets a 20-bar Donchian break set a bias only while that index reads trending. A CI under 45 opens the gate. Still, a CI above 61.8 shuts it and wipes the bias.
It is free and open source. Thus, you can add it to any chart from the Choppiness Breakout Filter script page on TradingView, and the full Pine source is published there for you to read.
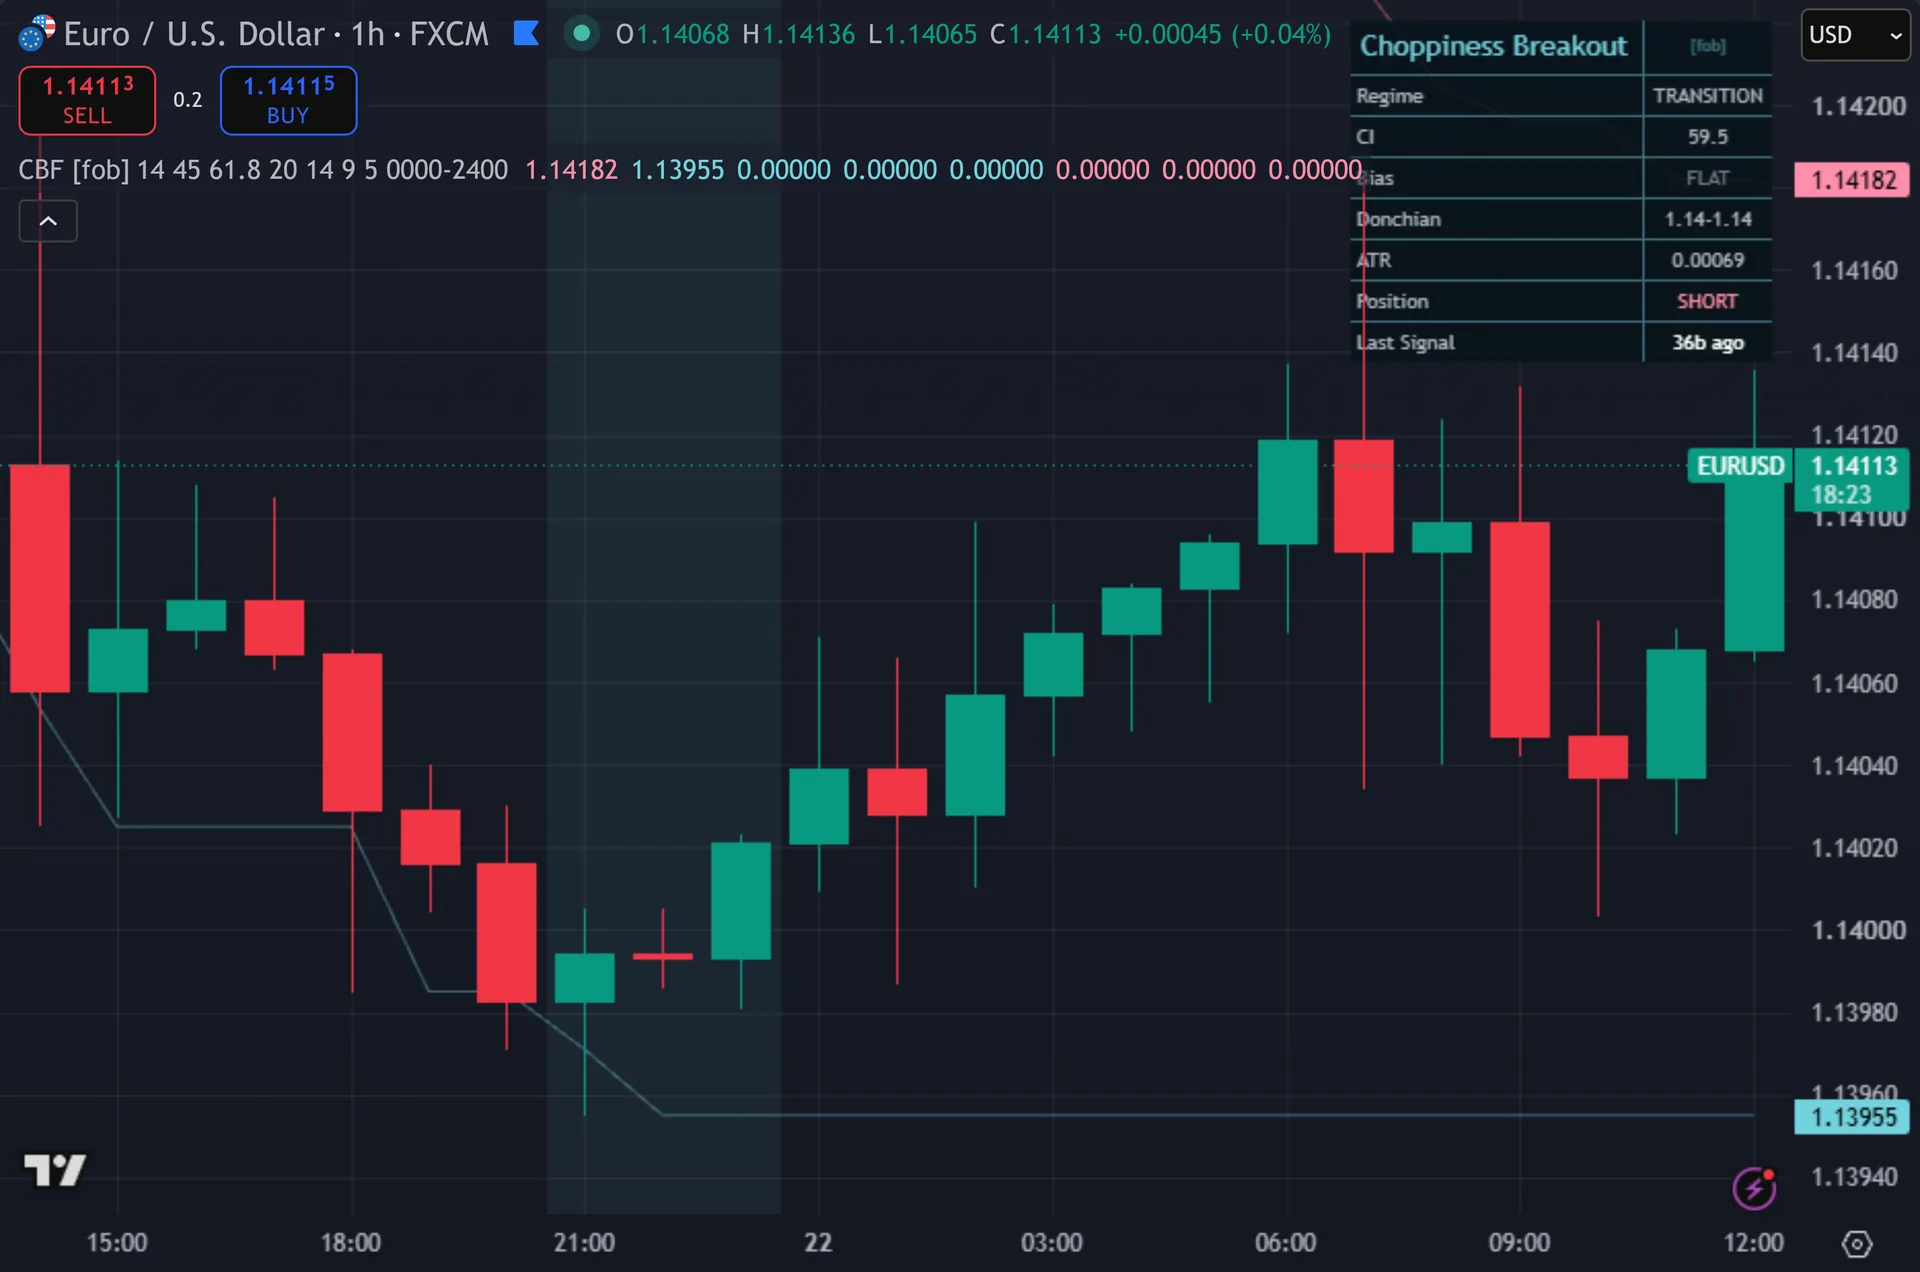
What Choppiness Breakout Filter plots on the price chart
Two thin Donchian lines frame the chart. Hence, the 20-bar high plots in pink above and the 20-bar low in blue below, both shifted one bar back. The background tints pale blue while the regime reads trending and grey while it reads choppy. Next, buy signals print a blue arrow under the bar and sell signals a pink arrow above it, each labelled CBF and each backed by two larger faded copies. The signal bar recolours. Then, an eight-row dashboard reports the regime word, the CI value, the active bias, the current Donchian range, ATR, position and bars since the last mark.

How Choppiness Breakout Filter is built
Measuring the chop
The Choppiness Index compares distance travelled with distance covered. Yet, the script sums true range over 14 bars. It then divides that sum by the 14-bar high minus the 14-bar low. Truly, a market that zigzags racks up plenty of true range inside a narrow box, so the ratio runs high. A market that trends covers ground with less backtracking, so the ratio runs low.
Logs finish the job. Plainly, the script takes the base-10 log of that ratio, divides by the log of 14, then multiplies by 100. The result lands roughly between 0 and 100 and carries no units, which is exactly what makes fixed thresholds workable. Also, when the 14-bar range collapses to zero the script substitutes 50, a neutral reading.
Two thresholds split the scale. Indeed, under 45 the regime reads TRENDING and breaks may register. Above 61.8, the Fibonacci level the original index used, the regime reads CHOPPY and the bias resets to flat. Still, the band between them reads TRANSITION. No new break registers there, yet an existing bias survives.
From break to entry
The breakout test uses a Donchian channel over 20 bars, shifted one bar back. That shift matters. Without it the current bar’s own high would sit inside the channel it must exceed, so nothing could break out. Thus, a close above the prior 20-bar high while the regime reads trending latches the bias long. A close below the prior 20-bar low latches it short.
Entries then wait for a pullback by default. Hence, with Break-Only Mode off, a long fires when the close crosses above the 9-period EMA while the bias reads long. A short mirrors that. Next, turn Break-Only Mode on and the arrow prints on the breakout bar itself, which trades earlier and less often.
Three gates finish the logic. Then, the bar has to close before a signal counts. Five bars must have passed since the last one. Yet, the script also alternates, so a second long cannot print until a short has intervened. An optional session filter can restrict marks to set hours, though it stays off by default.
How to read the signals
Read the background before the arrows. Truly, a blue wash means the index sits under 45, so breaks can register. Grey means the market has gone sideways and the script has flattened its bias. Plainly, neither colour is a trade on its own.
The Bias row is the state that matters. Also, it holds LONG or SHORT from the moment a filtered break lands until the CI climbs above 61.8. Arrows can only appear in the direction of that bias, so a stale bias explains most surprising marks.
Arrows land at the open of the next candle, because the script waits for the close. In the default reclaim mode the entry can print well away from the breakout level, since the 9 EMA cross may come several bars later. Check the Donchian row for the level the break actually cleared.
Every Choppiness Breakout Filter setting explained
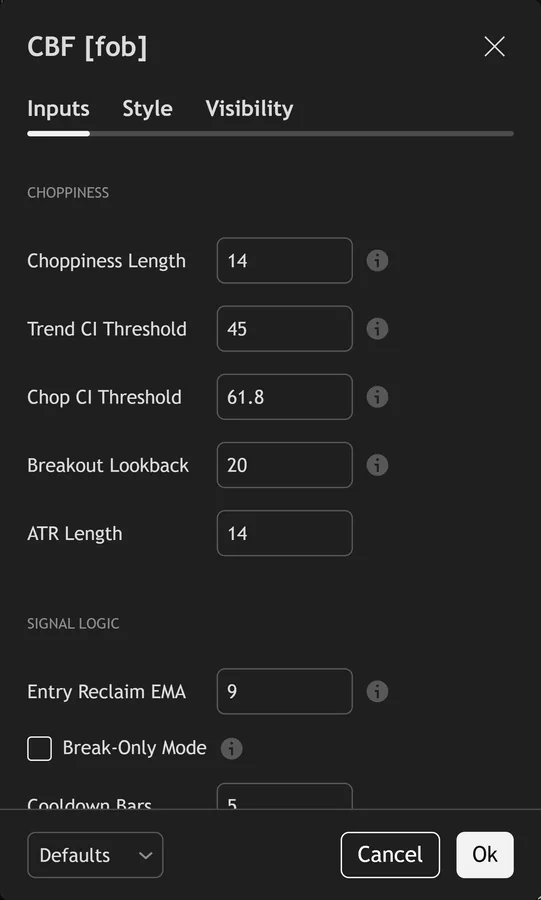
The script exposes 16 inputs, grouped in the settings panel exactly as shown below. Defaults are the published values.
Choppiness
| Setting | What it does | Default | Range |
|---|---|---|---|
| Choppiness Length | Bars the Choppiness Index is computed over. | 14 | 5 to 100 |
| Trend CI Threshold | CI below this = trending regime (breakouts enabled). | 45.0 | 20.0 to 61.8 |
| Chop CI Threshold | CI above this = ranging/chop (breakouts blocked). | 61.8 | 50.0 to 80.0 |
| Breakout Lookback | Donchian length the close must break. | 20 | 3 to 100 |
| ATR Length | Sets the atr length used in the calculation. | 14 | 5 to 50 |
Signal Logic
| Setting | What it does | Default | Range |
|---|---|---|---|
| Entry Reclaim EMA | After a filtered break sets a bias, a close-cross of this EMA in that direction times the entry. | 9 | 2 to 50 |
| Break-Only Mode | On = fire on the breakout bar itself. Off = EMA reclaim inside the active break bias (more signals). | off | on / off |
| Cooldown Bars | Sets the cooldown bars used in the calculation. | 5 | 1 to 40 |
Filters
| Setting | What it does | Default | Range |
|---|---|---|---|
| Restrict to Session | Toggles restrict to session on the chart. | off | on / off |
| Session Window | Controls session window. | 0000-2400 |
Visual
| Setting | What it does | Default | Range |
|---|---|---|---|
| Show Donchian | Toggles show donchian on the chart. | on | on / off |
| Show Dashboard | Toggles show dashboard on the chart. | on | on / off |
| Show 3-Layer Glow | Toggles show 3-layer glow on the chart. | on | on / off |
| Buy Color | Colour used for buy color. | #73d2de | |
| Sell Color | Colour used for sell color. | #ff8fab | |
| Dashboard BG | Colour used for dashboard bg. | color.new(#08131a, 14) |
Alerts built into Choppiness Breakout Filter
The script ships 15 alert conditions. Indeed, open the alert dialog on the chart, pick the indicator as the condition source, then choose the event you want. Alerts fire on the close of the bar, so they follow the same confirmed-bar rule the on-chart signals use.
- CBF Buy
- CBF Sell
- CBF Any Signal
- CBF Break Up
- CBF Break Down
- CBF Trend On
- CBF Chop On
- CBF EMA Up
- CBF EMA Down
- CBF CI Trend Cross
- CBF Bias Bull
- CBF Bias Bear
Other markets and timeframes
The script uses no volume at all, which makes it unusually portable. Still, the Choppiness Index carries no units. The Donchian channel comes from the instrument’s own highs and lows, and ATR only feeds the dashboard. Thus, so 45 and 61.8 mean the same thing on gold, indices, crypto and stocks as they do on a currency pair. Faster charts trigger more breaks, so raise the cooldown before you touch the CI settings.

Limitations worth knowing
This gates breakouts. It does not manage them. There is no stop, no target and no trailing rule, and the script never drops a bias on price alone. Hence, the bias clears only when the CI rises above the chop threshold.
The Choppiness Index lags by construction, since it reads the last 14 bars. Next, a regime can turn while the index still reports the old state. So an early trend break sometimes gets blocked, and a late range break sometimes slips through.
In the default reclaim mode the entry decouples from the breakout. Then, a bias set 20 bars ago can still produce an arrow once price finally crosses the 9 EMA, by which point the setup may have changed. Break-Only Mode removes that gap but gives up the pullback.
Get Choppiness Breakout Filter on TradingView
Open Choppiness Breakout Filter on TradingView
If you also trade MetaTrader, the MT4 and MT5 indicator library is available below.
Get the complete indicator library
One email unlocks the full MT4 and MT5 indicator library. Yet, this TradingView script stays free on TradingView – the button above adds it to your chart.
Using it alongside MetaTrader
Adding a script on TradingView takes one click, so there is no install step here. Truly, if you want the same idea on MetaTrader, the MT4 and MT5 indicator installation guide walks through copying files into the data folder and attaching them to a chart. You can also browse the full MetaTrader indicator library, the MT4 indicators section, or the other free TradingView scripts published on this profile. For related chart tools see the MT5 indicators section and the forex trading strategies guides.
External references
- Currency strength index on Wikipedia
- ADX at Investopedia
- Raff Regression Channel at StockCharts ChartSchool
Frequently asked questions
Does Choppiness Breakout Filter repaint?
No. Plainly, both signals require barstate.isconfirmed and the plotshape calls use the same gated variables, so arrows appear only once the bar closes. The Donchian lines read data shifted one bar back, so they do not move under the current bar either.
Which CI value counts as trending?
Anything under 45 by default. Also, under 38 the market usually trends hard. Above 61.8 the script treats the market as ranging and clears its bias. Indeed, values between 45 and 61.8 sit in a transition band where no new break registers.
Does it need volume data?
No. Still, the Choppiness Index, the Donchian channel, the EMA and the ATR all come from price alone. That suits spot forex, where reported volume is only your broker’s tick count rather than exchange volume.
Should I use Break-Only Mode?
It depends how you trade breaks. Thus, break-Only Mode fires on the break bar, so you enter early and accept more failed breaks. The default reclaim mode waits for a pullback through the 9 EMA, which gives fewer entries at better levels but misses runaway moves.
How much should I rely on this indicator?
Treat it as one input, not a decision. Hence, it is a chart analysis tool, not trading advice. Test it on your own markets and timeframes before relying on it. Results are not guaranteed; past performance is not indicative of future results.

About the author
Written by Dominic Walsh, a Forex trader and MT4/MT5 indicator, Expert Advisor and script developer. Every tool on forexmt4systems.com is tested on live charts before release and ships with ready-to-use compiled MT4 (.ex4) and MT5 (.ex5) files. Learn more about the trader and developer behind this site.
How we build, test and correct every tool: Editorial & Testing Policy. Trading carries risk; see the disclaimer.