
Convex Hull Channel is a price channel indicator TradingView traders can use to frame breakouts. It ignores wicks. The upper band tracks the highest body top over 20 bars, and the lower band tracks the lowest body bottom. Also, that single choice keeps one-off spikes out of the channel. A volatility gate then decides when a break counts. Indeed, width must reach at least 1.20 times its own 50-bar average before any arrow can print.
It is free and open source. Still, you can add it to any chart from the Convex Hull Channel script page on TradingView, and the full Pine source is published there for you to read.
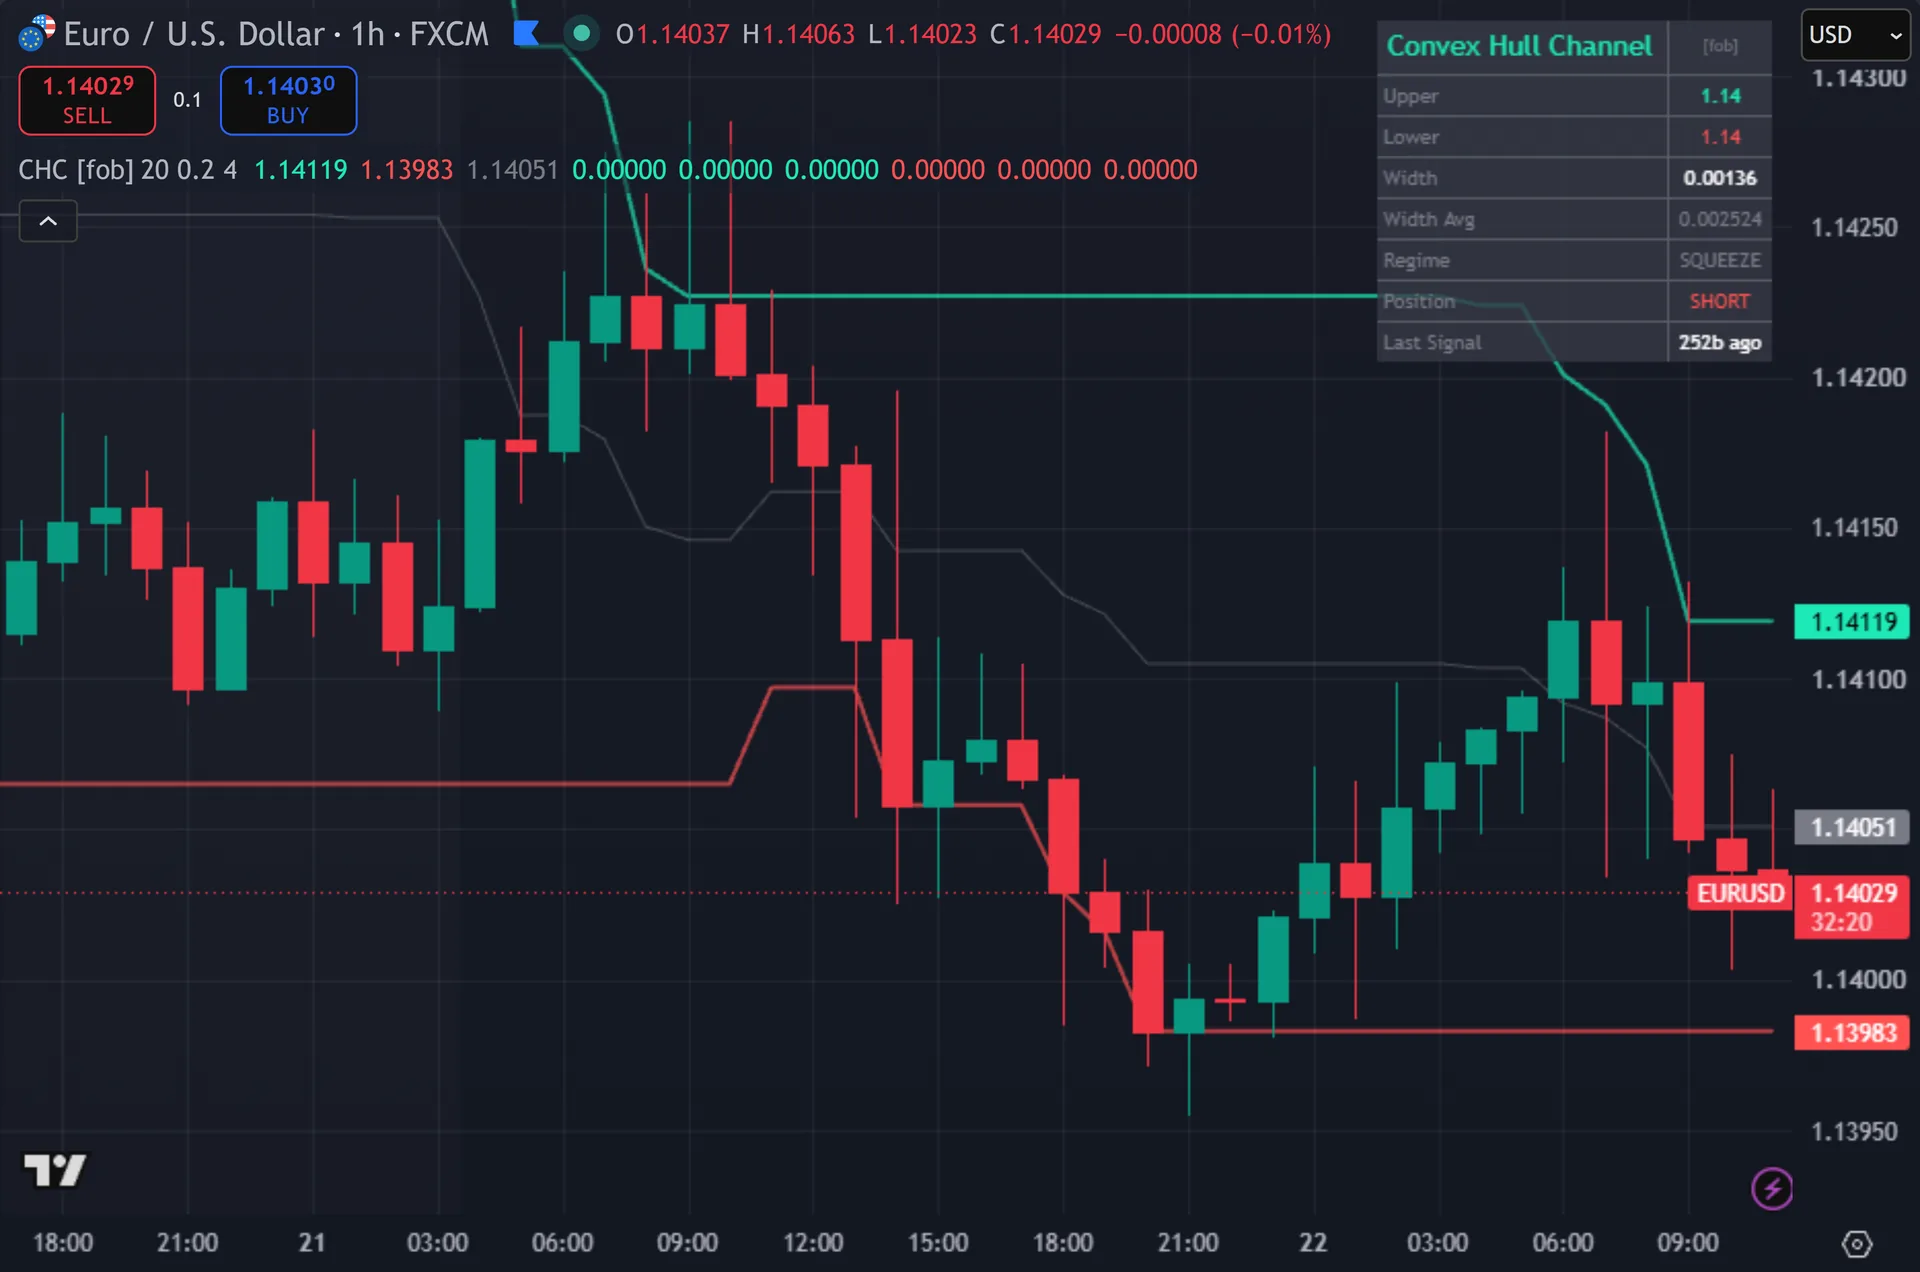
What Convex Hull Channel plots on the price chart
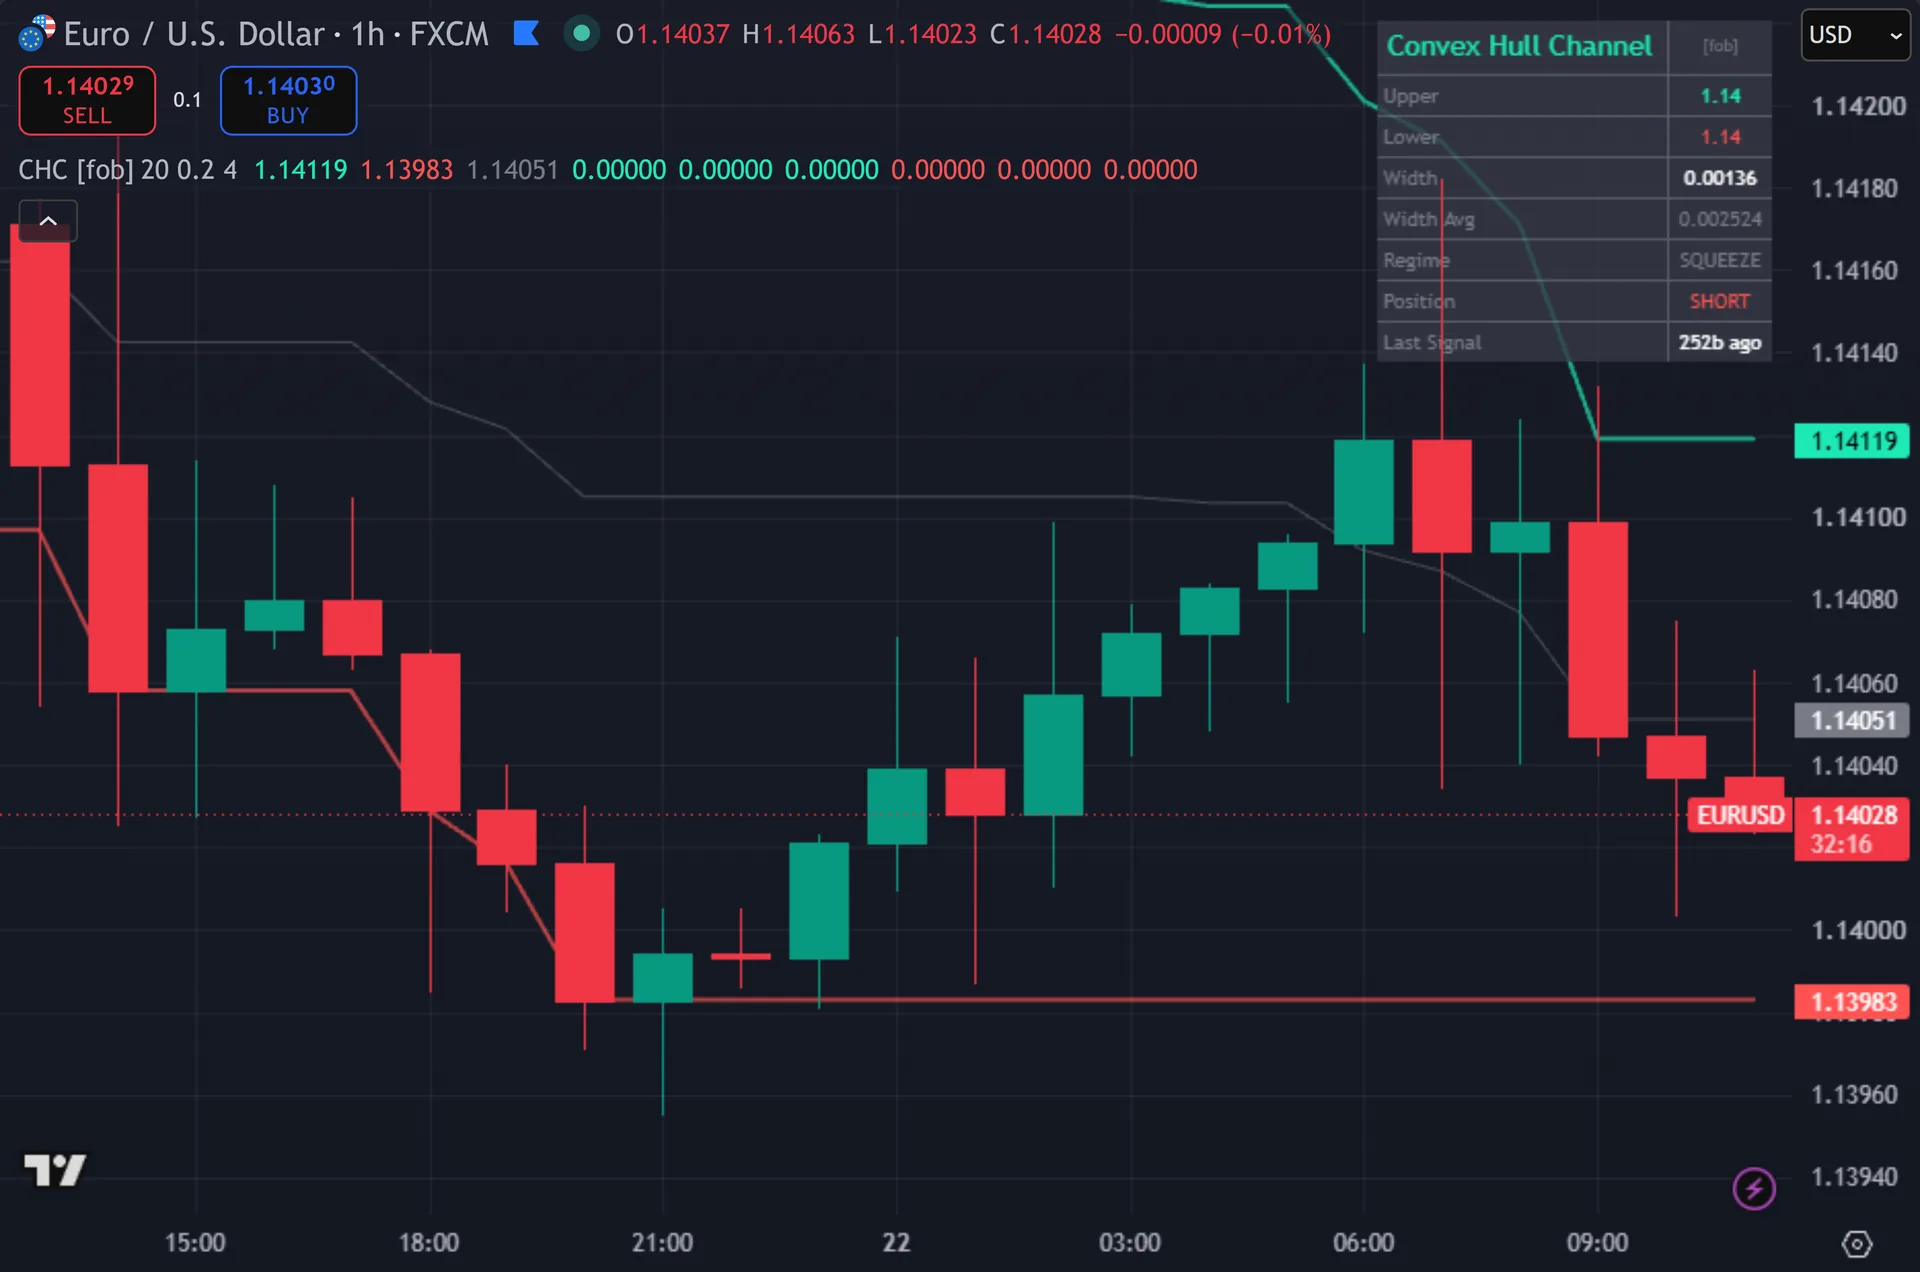
Three lines run across the chart: an upper band in teal, a lower band in red, and a gray midline between them. Thus, triangles mark signals below or above the bar, labelled CHC up and CHC dn, each backed by two larger glow layers. The signal bar itself gets a color wash. Hence, a faint gray background marks every bar in the expansion regime. The top-right dashboard prints current upper and lower values, raw width, the 50-bar width average, the regime word, position state, and bars since the last signal.
How Convex Hull Channel is built
The body-based envelope
Despite the name, the script never computes a geometric convex hull. Next, it builds a rolling envelope from candle bodies. Each bar contributes two values: the higher of open and close, and the lower of the two. Then, the upper band is the highest body top across the last 20 bars. The lower band is the lowest body bottom. Yet, the midline sits at their average.
That is where it parts company with Donchian. Truly, donchian uses raw highs and lows, so one long wick pins a band for the whole lookback. Bodies ignore that wick. Plainly, the envelope then sits closer to where the market actually settled, and a single spike no longer sets the level a breakout has to clear.
The expansion gate and signal rules
Width is the distance between the two bands. Also, the script smooths width with a 50-bar simple average, then compares the two figures. Expansion turns on when current width reaches at least 1.20 times that average, which is the default Min Width Excess of 0.20. Indeed, anything under that reads as a squeeze, and the dashboard says SQUEEZE.
Breaks use the prior bar’s bands, not the current ones. Still, a buy needs the close to cross above the previous bar’s upper band. A sell needs the close to cross below the previous lower band. Thus, that one-bar offset matters, because the close feeds the body envelope itself. Comparing a close to a band that already contains it would be circular.
Three more gates apply. Hence, expansion must be active, so the script skips squeeze breaks entirely. At least 4 bars must have passed since the last signal. Next, and direction must alternate, because an internal position state blocks a second buy until a sell fires. Every arrow also waits for barstate.isconfirmed, so signals settle on the bar close.
How to read the signals
Start with the regime word in the dashboard. In SQUEEZE the script will not fire, whatever price does at the band. In EXPANSION it is live. Then, the faint background tint shows the same state across chart history.
Use the bands as context, not only as triggers. Yet, a market riding the upper band with a rising midline is trending. A market rolling between bands with flat width is ranging, and breaks there are exactly what the width filter aims to skip.
Watch the Width and Width Avg rows together. Truly, their ratio drives the whole gate. As width climbs toward 1.20 times the average, the script moves close to arming. Plainly, that gives you warning before the first arrow prints.
Every Convex Hull Channel setting explained
The script exposes 8 inputs, grouped in the settings panel exactly as shown below. Defaults are the published values.
Envelope
| Setting | What it does | Default | Range |
|---|---|---|---|
| Envelope Window | Sets the envelope window used in the calculation. | 20 | 8 to 100 |
Signal Logic
| Setting | What it does | Default | Range |
|---|---|---|---|
| Min Width Excess | Channel width must exceed (1 + k) x its 50-bar average to qualify as expansion. Filters squeezes. | 0.20 | 0.05 to 2.0 |
| Cooldown Bars | Sets the cooldown bars used in the calculation. | 4 | 1 to 20 |
Visual
| Setting | What it does | Default | Range |
|---|---|---|---|
| Show Dashboard | Toggles show dashboard on the chart. | on | on / off |
| Show 3-Layer Glow | Toggles show 3-layer glow on the chart. | on | on / off |
| Show Envelope Bands | Toggles show envelope bands on the chart. | on | on / off |
| Buy Color | Colour used for buy color. | #1de9b6 | |
| Sell Color | Colour used for sell color. | #ff5252 |

Alerts built into Convex Hull Channel
The script ships 11 alert conditions. Also, open the alert dialog on the chart, pick the indicator as the condition source, then choose the event you want. Alerts fire on the close of the bar, so they follow the same confirmed-bar rule the on-chart signals use.
- CHC Buy
- CHC Sell
- CHC Any Signal
- CHC Expansion On
- CHC Expansion Off
- CHC Upper Cross
- CHC Lower Cross
- CHC Outside
- CHC Webhook JSON
Other markets and timeframes
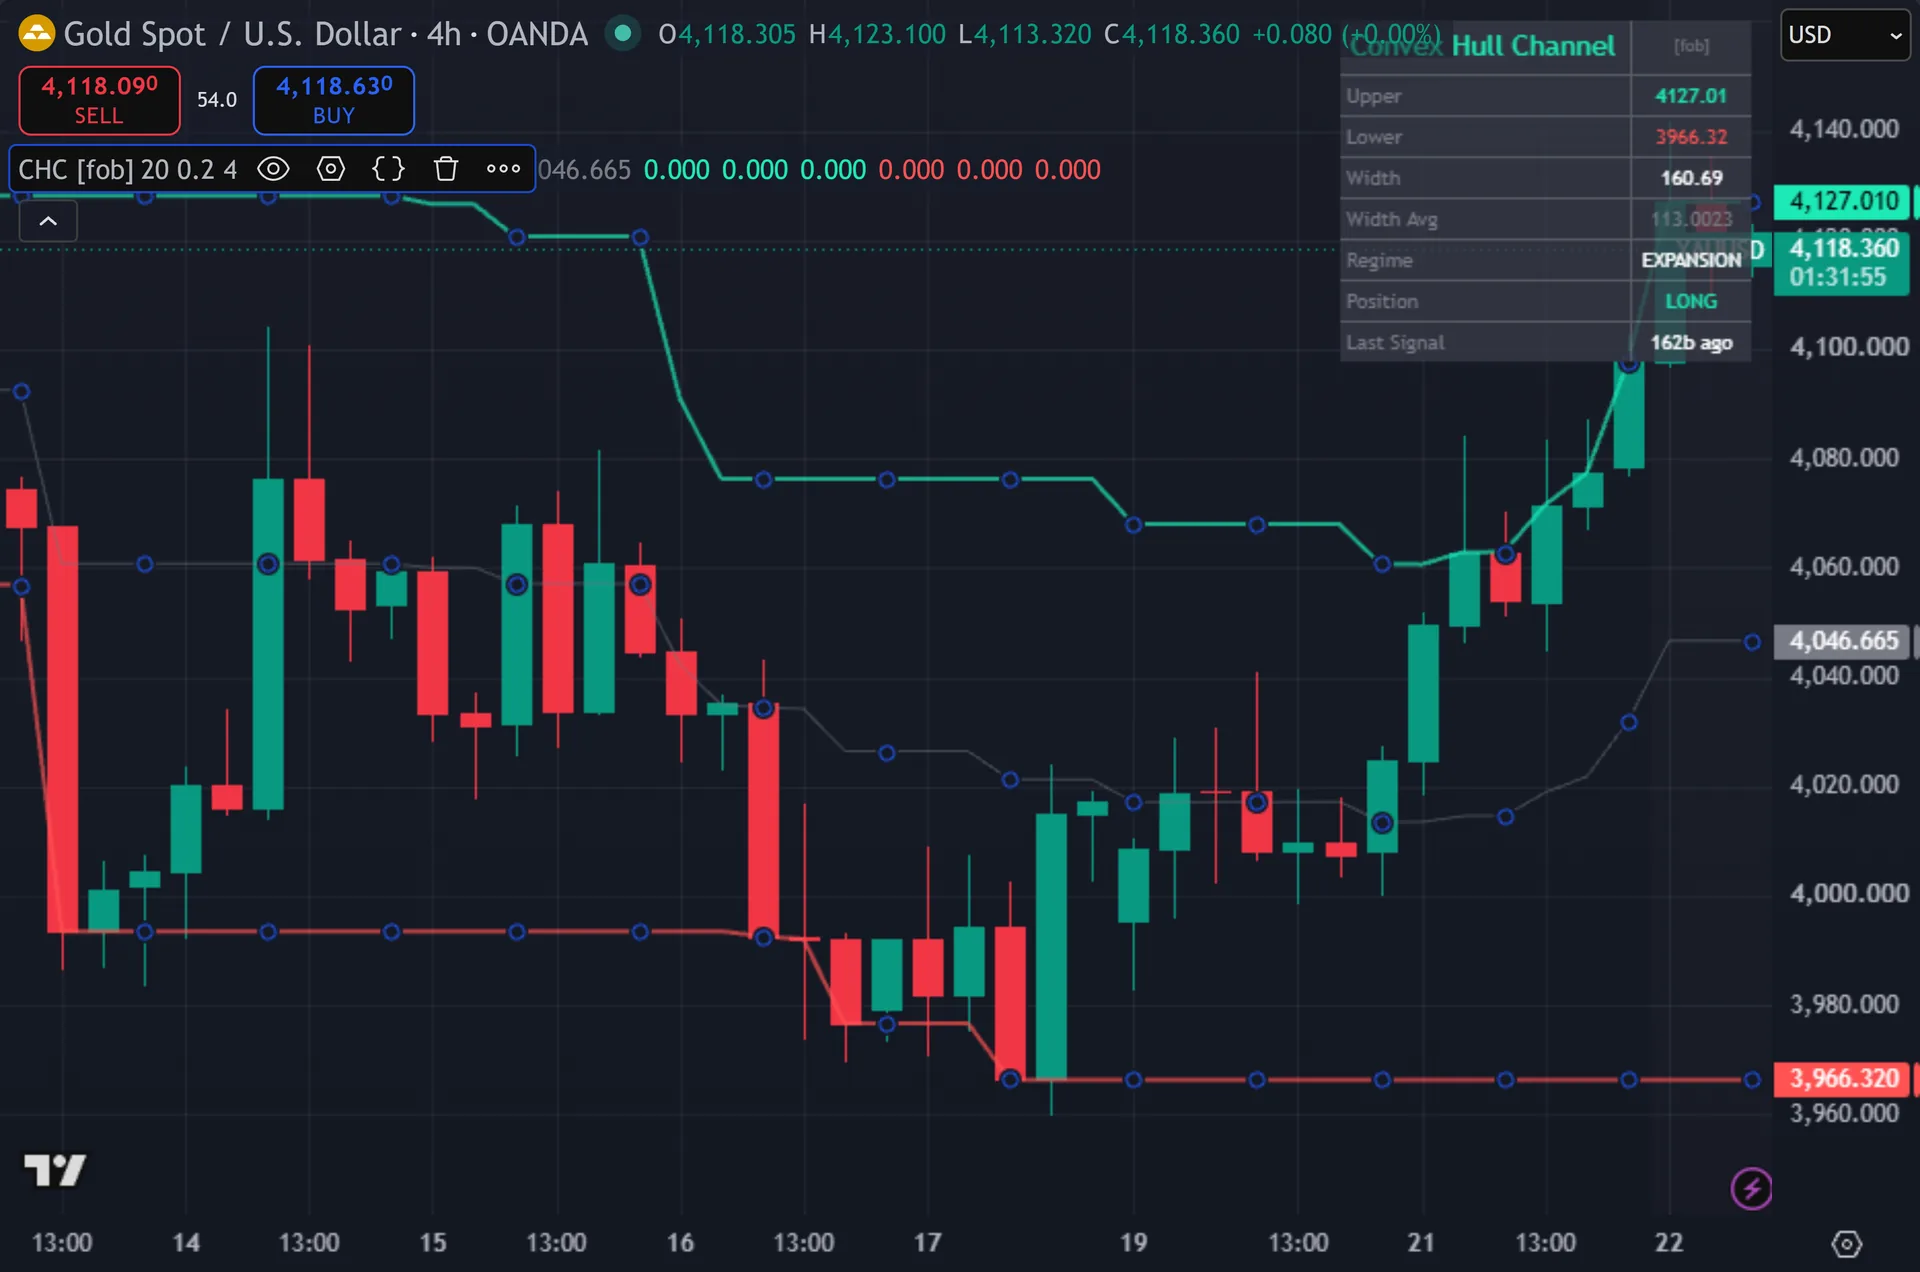
Nothing in the maths is currency-specific. Indeed, the envelope measures bodies against other bodies, and the gate compares width to its own 50-bar average, so both scale with whatever chart you load. Gold, indices, crypto and stocks all run on the default settings. Still, two inputs still reward tuning by chart speed. Shorten the 20-bar window for tighter bands on slow charts, and raise the 4-bar cooldown on fast intraday charts where breaks cluster together.
Limitations worth knowing
The name oversells the geometry. Thus, there is no convex hull here, and no hull moving average either. It is a rolling body envelope with a volatility filter on top. Hence, judge it on that, not on the label.
Using bodies carries a cost. Next, the bands sit inside the wick range, so price often trades beyond a band with no close crossing it. Place a stop on the band and it sits closer than a Donchian stop would. Then, the 50-bar width average also needs roughly 70 bars of history before the gate behaves normally.
The alternation rule blocks repeat signals. Yet, after a buy, no second buy prints until a sell fires, so a strong trend that keeps breaking higher gets one arrow only. Breakout logic also enters late by design, since the widest channels often appear after a move has already run.
Get Convex Hull Channel on TradingView
Open Convex Hull Channel on TradingView
If you also trade MetaTrader, the MT4 and MT5 indicator library is available below.
Get the complete indicator library
One email unlocks the full MT4 and MT5 indicator library. Truly, this TradingView script stays free on TradingView – the button above adds it to your chart.
Using it alongside MetaTrader
Adding a script on TradingView takes one click, so there is no install step here. Plainly, if you want the same idea on MetaTrader, the MT4 and MT5 indicator installation guide walks through copying files into the data folder and attaching them to a chart. You can also browse the full MetaTrader indicator library, the MT4 indicators section, or the other free TradingView scripts published on this profile. For related chart tools see the MT5 indicators section and the forex trading strategies guides.
External references
- Donchian channel on Wikipedia
- Bollinger Bands at Investopedia
- Volatility Indices at StockCharts ChartSchool
Frequently asked questions
Does Convex Hull Channel really use a convex hull?
No, and the code is open about it. Also, it builds a rolling envelope from the highest body top and the lowest body bottom over the last 20 bars. That is a body-based Donchian variant. Indeed, the convex hull name describes the visual shape, not the algorithm.
How is it different from a Donchian channel?
Donchian uses raw highs and lows. Still, this one uses math.max(open, close) and math.min(open, close), so wicks never set a band. It also adds a volatility gate. Thus, breaks only count when width sits at least 20 percent above its 50-bar average.
Does it repaint?
The arrows do not. Hence, every signal requires barstate.isconfirmed, so an arrow prints after the bar closes. The bands and the expansion background update on the live bar, which is normal for any rolling calculation.
Why did an obvious breakout print no arrow?
Check the four gates. Regime may have read SQUEEZE. The 4-bar cooldown may still have been running. Next, the last signal may have pointed the same way. Or the close never actually crossed the previous bar’s band. Then, the dashboard shows regime, position and bars since the last signal, so you can tell which gate blocked it.
How much should I rely on this indicator?
Treat it as one input, not a decision. Yet, it is a chart analysis tool, not trading advice. Test it on your own markets and timeframes before relying on it. Results are not guaranteed; past performance is not indicative of future results.

About the author
Written by Dominic Walsh, a Forex trader and MT4/MT5 indicator, Expert Advisor and script developer. Every tool on forexmt4systems.com is tested on live charts before release and ships with ready-to-use compiled MT4 (.ex4) and MT5 (.ex5) files. Learn more about the trader and developer behind this site.
How we build, test and correct every tool: Editorial & Testing Policy. Trading carries risk; see the disclaimer.