
A TradingView chart is a browser-based price chart where you pick a symbol, a timeframe and a chart type, then add studies and drawings on top. This walkthrough covers each control in the order you meet it. We opened EURUSD from the OANDA feed on the daily chart on 28 September 2026 and worked through the menus one by one. So every step below matches a screen we actually saw, and each screenshot shows that screen.
What a TradingView chart is
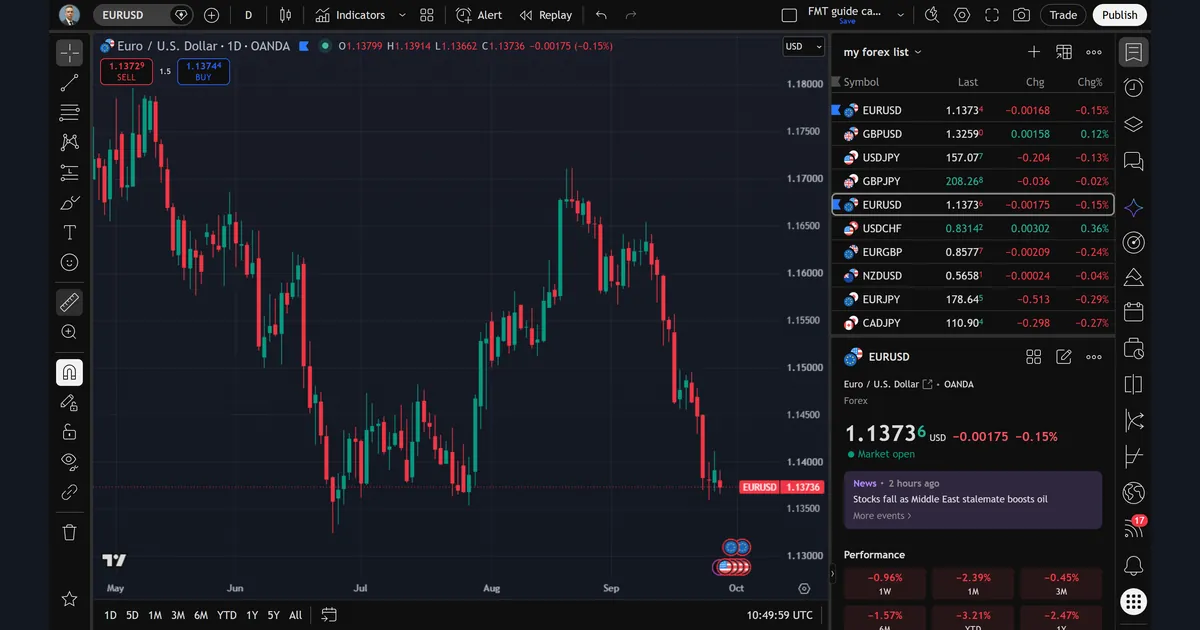
At its core, a TradingView chart is one symbol drawn in one time frame. You see the price scale on the right, dates along the bottom and the candles in the middle. Around that canvas sit four toolbars. The top bar holds the symbol, timeframe, chart type, indicators, alerts and replay. The left bar holds the drawing tools. Finally, the right bar opens panels such as the watchlist, alerts and news.
Everything you set up on the chart belongs to a layout. In our run, the layout was called “FMT guide captures (auto)”, and the top bar showed its short name with a small Save link under it. A layout stores the symbol, timeframe, chart type, indicators and drawings together. So when you reopen it, the chart comes back the way you left it.
The same chart runs in a browser and in the desktop app; we used the web version. If you know MetaTrader, a layout works like a saved profile plus a template. For the MetaTrader side, see the difference between MetaTrader 4 and 5.
How a TradingView chart works: feeds, layouts and sync
A TradingView chart does not have one EURUSD price. Instead, each symbol comes from a named data feed, such as an exchange, a broker or a price provider. The feed name sits in the chart title. Our title read “Euro / U.S. Dollar · 1D · OANDA”. That tells you three things at once: the instrument, the timeframe and the source.
Because feeds differ, two EURUSD symbols can print slightly different numbers at the same moment. Our watchlist, “my forex list”, held two EURUSD rows. One showed 1.13734 and the other, the OANDA symbol on our chart, showed 1.13736. That gap is small, but it matters for tight stops and alerts near a level.
Next comes sync. Layouts, watchlists and drawings save to your TradingView account rather than to the computer. Therefore the same layout opens on a second browser or the desktop app. Free and paid accounts differ in how many indicators, layouts and alerts you keep, and those limits change, so check your own plan page. TradingView’s own getting started with Supercharts page in the TradingView Help Center is the primary reference for the current layout rules.
How we tested
We ran every step on the TradingView web chart on 28 September 2026, between 10:49 and 10:51 UTC by the chart clock. The symbol was EURUSD from the OANDA feed. The timeframe was daily (1D), with visible history from May to early October 2026. First, we saved the chart as a layout named “FMT guide captures (auto)” so each screen started from the same state.
Then we opened, in order: symbol search, the timeframe menu, the chart type menu, the “Indicators, metrics, and strategies” dialog, the trend line tool and the chart Settings dialog. We captured a screenshot at each step. We did not place trades, and we did not test any paid plan feature. Our wider rules for tests like this are in the editorial testing policy.
The main toolbar controls and what each does
The top bar is where most work starts. Here is what each control did on our screen, from left to right, plus the key parts of the other bars.
| Control | Where it sits | What it does |
|---|---|---|
| Symbol box | Top bar, far left (“EURUSD”) | Opens symbol search; typing on the chart opens it too |
| Timeframe (“D”) | Top bar | Opens the interval list, from ticks upward |
| Chart type icon | Right of the timeframe | Switches between bars, candles, line, Heikin Ashi, Renko and more |
| Indicators | Top bar | Opens the “Indicators, metrics, and strategies” dialog |
| Alert | Top bar | Creates a price or indicator alert |
| Replay | Top bar | Replays past bars one at a time |
| Layout name and Save | Top bar, right | Shows and saves the current layout |
| Settings gear | Top bar, right | Opens the chart Settings dialog |
| Drawing tools | Left bar | Trend lines, Fibonacci, patterns, text, measure, magnet, lock and delete |
| Date range buttons | Bottom bar (1D, 5D, 1M … All) | Zooms the chart to a fixed span of history |
| Clock | Bottom bar, right | Shows chart time; ours read UTC |
Also note the two boxes under the chart title. On our first screen they read 1.13729 SELL and 1.13744 BUY, with 1.5 between them. That is the feed’s bid, ask and spread in pips.
Reading the chart: symbol search and the timeframe menu
First, pick the symbol. Click the symbol box, or simply start typing on the chart, and the Symbol search dialog opens. We typed EURUSD. The results listed the same pair from many feeds: ICE, OANDA, FXCM, FOREXCOM, Pepperstone, IC Markets, Tickmill, Capital.com, Vantage, CMC Markets, Eightcap and Saxo. We name them only because they were on screen, not as a recommendation.
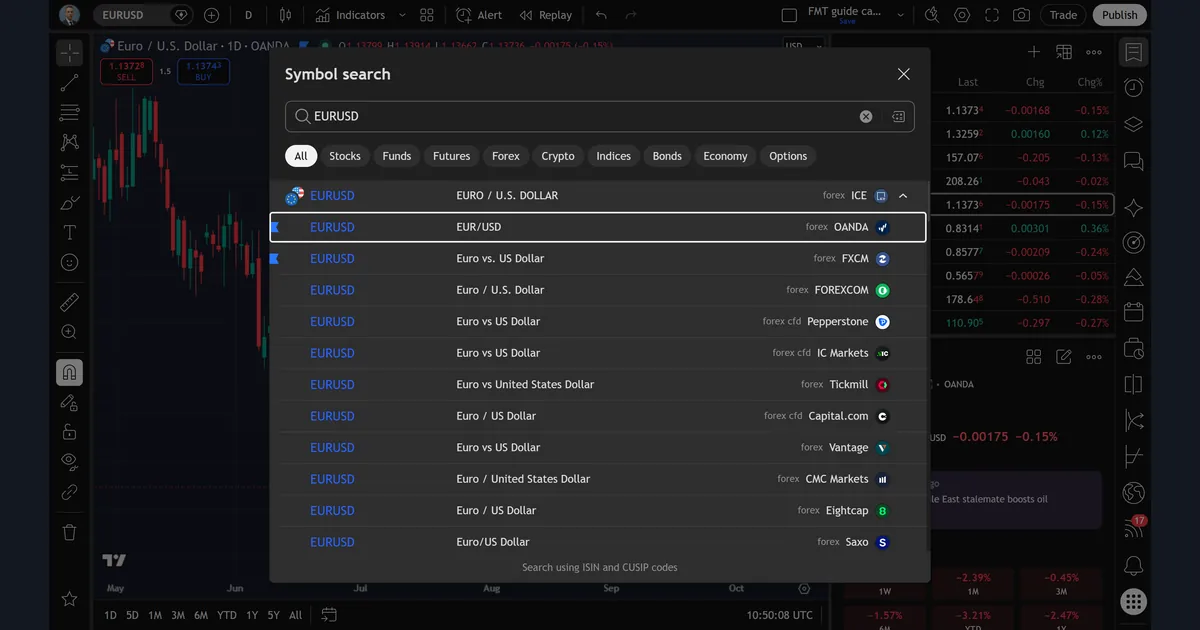
Along the top of the dialog sit category tabs: All, Stocks, Funds, Futures, Forex, Crypto, Indices, Bonds, Economy and Options. The right-hand column shows the feed and its type, for example “forex” or “forex cfd”. To match your broker, pick its feed here if it is listed.
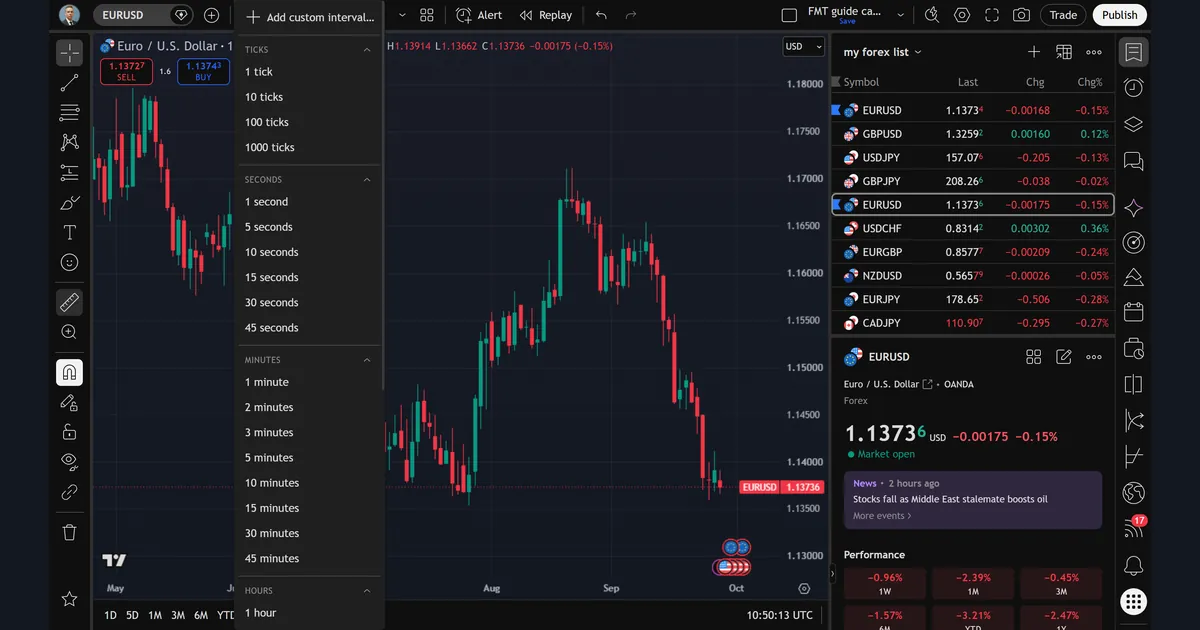
Next, set the timeframe. Clicking “D” opened a long menu. At the top was “Add custom interval”. Below it came groups for ticks (1, 10, 100 and 1000 ticks), seconds (1 to 45 seconds) and minutes (1 to 45 minutes), then hours further down. Each group folds away with the small arrow on its right.
A higher timeframe means less noise but fewer bars, so the daily chart is the calmest place to learn. Our guide to multi-timeframe analysis explains how to stack a daily view with an hourly one. Also, if the UTC clock confuses you, our forex time zone converter helps you line it up with your own hours.
Worked example: EURUSD daily on 28 September 2026
Here is the exact sequence we ran, with the numbers the screen showed. First, we loaded EURUSD from OANDA on the 1D timeframe. The status line under the title read O1.13799, H1.13914, L1.13662 and C1.13736, with a change of -0.00175, or -0.15%. That is the open, high, low and current close of the day’s candle.
Then we read the price scale. It ran from 1.13000 at the bottom to 1.18000 at the top. The red price tag on the right edge read 1.13736, which matched the close in the status line. The symbol panel under the watchlist showed the same 1.13736 and the words “Market open”.
Next, we checked the performance tiles in that panel. They read -0.96% for one week, -2.39% for one month, -0.45% for three months, -1.57% for six months, -3.21% year to date and -2.47% for one year. So the pair was down in every window shown up to that morning. The chart itself shows why: price pushed up into August, then dropped hard through September.
After that, we scanned the watchlist for context. GBPUSD sat at 1.32590, USDJPY at 157.077 and USDCHF at 0.83142, the only pair in the list up on the day at +0.36%. In short, the dollar was firm that morning. None of this is a trade call. It is simply what a trader reads in the first thirty seconds on a fresh TradingView chart.
Changing the chart type and adding RSI
The chart type icon sits just right of the timeframe. When we clicked it, the menu listed Bars, Candles, Hollow candles and Volume candles first. Then came Line, Line with markers and Step line. After those were Area, HLC area, Baseline, Columns and High-low. Near the bottom sat Volume footprint, Time price opportunity, Session volume profile, Heikin Ashi, Renko and Line break. Candles was highlighted because it was active.
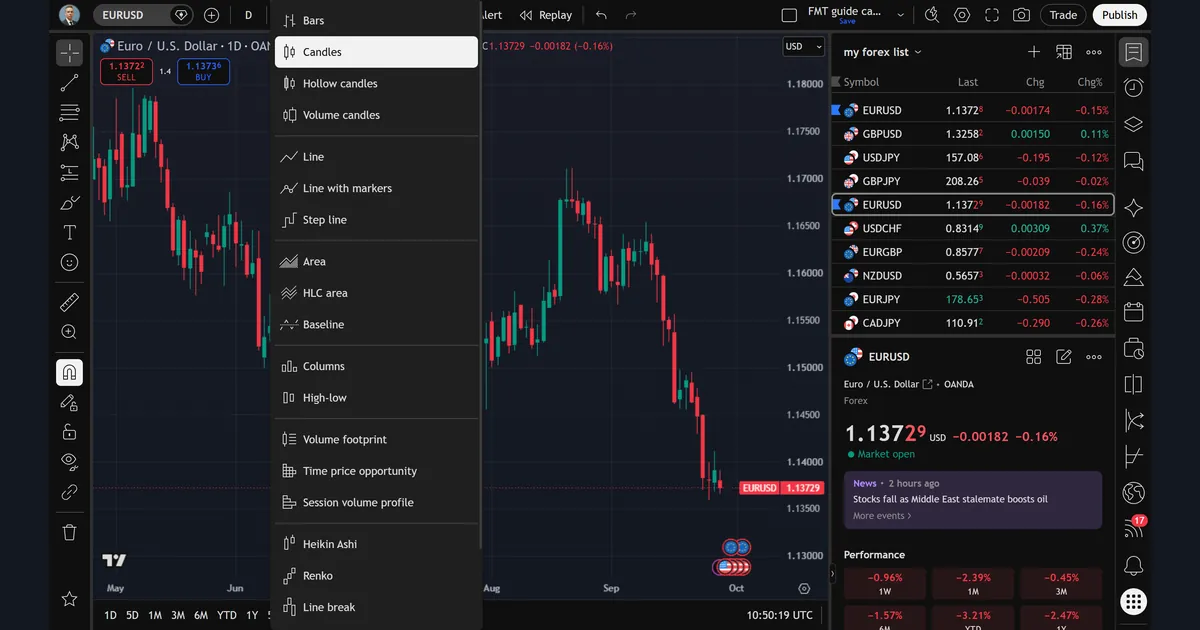
Candles show open, high, low and close per bar, a format described in the candlestick chart article on Wikipedia. A line joins closes only. For the trade-offs, read our guides to line charts in forex, bar charts vs candlesticks and what Heikin Ashi is.
Next, we clicked Indicators and typed “Relative Strength Index”. The dialog split results into groups. The left column held Personal, Built-in and Community groups. On the right, Technicals listed Relative Strength Index, RSI Strategy, Connors RSI and Stochastic RSI. Below that, a Community list showed many user-built RSI versions.
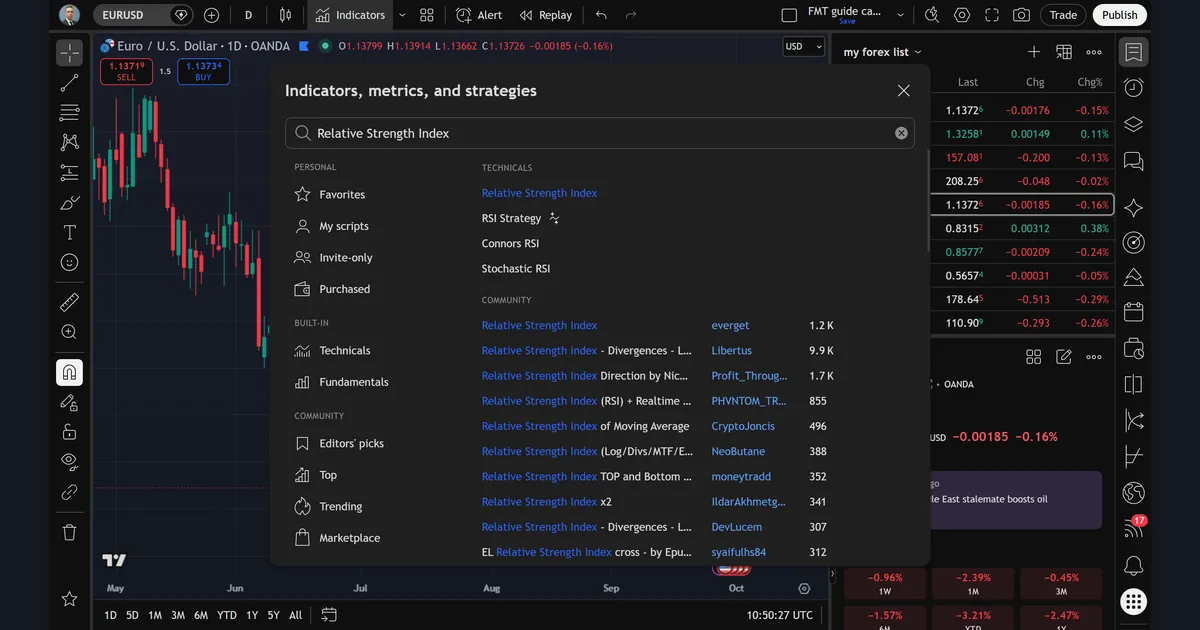
For a first chart, pick the built-in “Relative Strength Index” under Technicals. It opens in a pane under price. Then tune it with our RSI indicator settings guide.
Download the complete indicator database
Put these concepts on your charts. One email unlocks the full library of 1,380+ indicators with compiled MT4 and MT5 files, plus my TradingView scripts. No paywall, no spam, unsubscribe any time.
Get free access to my indicator database
One email unlocks 1,380+ free MT4, MT5 and TradingView indicators — the complete library. No single-tool download; you get the whole database.
Where it fails
A TradingView chart is a good viewer, but it has real limits. First, the feed problem. Your chart may show OANDA while your broker fills you at its own price. So a level you drew from one feed can sit a fraction off your broker’s chart. Alerts then fire at slightly different moments.
Second, the community library is huge and uneven. Our RSI search returned more community scripts than we could scroll through. Some repaint, some are copies, and names alone do not tell you which. Therefore, start with the built-in version and read any community script’s description before you trust it.
Third, the daily candle depends on the feed’s session close. A daily bar from one source may not match the daily bar in MetaTrader. That shifts highs, lows and indicator values. Finally, a chart shows what happened. It does not tell you what comes next, and no setting changes that.
Drawing a trend line and opening chart settings
To draw, pick the trend line from the left toolbar, or press Alt+T. Click once on the first anchor and once on the second. We drew a line from an early July low to a mid-September bar. It rose between the 1.14000 and 1.14500 grid lines. By the time of the capture, price had closed below it at 1.13724.
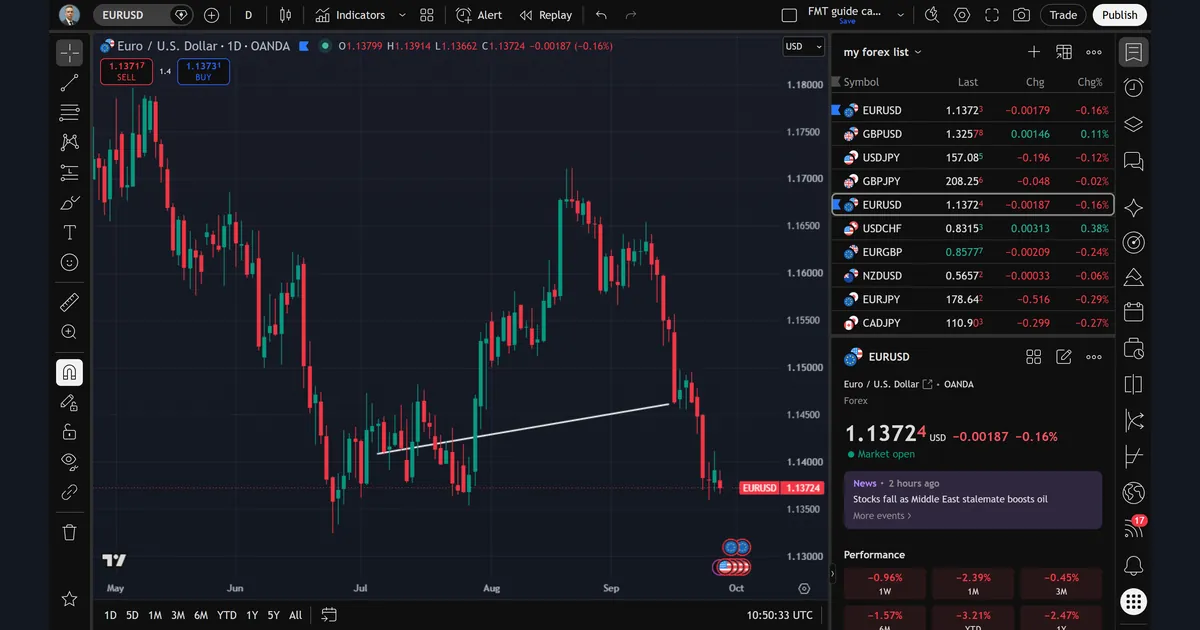
That is the practical lesson of the drawing. A line that held through the summer no longer held in late September. For how to anchor lines well, see how to use trend lines. StockCharts’ trend lines article at StockCharts ChartSchool covers the classic rules too.
Next, we opened the chart Settings dialog with the gear icon. Its tabs were Symbol, Status line, Scales and lines, Canvas, Trading, Alerts and Events. We stopped on Events. There, Economic events, Only future events and Latest news were ticked. Ideas, Events breaks and News notification were not. At the bottom sat a Template menu, plus Cancel and Ok.
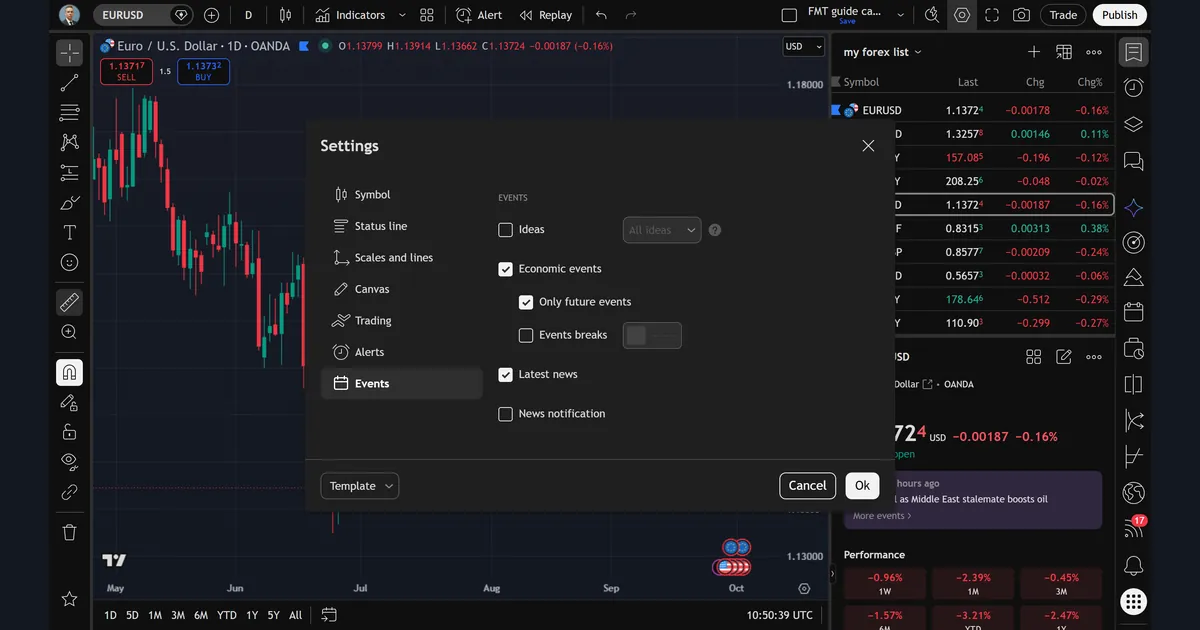
The Template menu matters. It saves your colours and scale choices so you can apply them to other charts in one click.
Keyboard shortcuts for a TradingView chart
You do not need many shortcuts. However, a few save real time on every chart. Alt+T starts a trend line. Alt+H draws a horizontal line at the cursor. Alt+R resets the chart view when you have zoomed or scrolled too far. And typing any letter on the chart opens symbol search, which is the fastest way to switch pairs.
Also, the magnet icon on the left toolbar was active in our session. It snaps drawings to the nearest open, high, low or close. Turn it off for a line through the middle of a range. For horizontal levels, our piece on support and resistance explains where to place them.
Common mistakes on a new chart
- Ignoring the feed. Many traders analyse one feed and trade another. Instead, check the feed name in the chart title and match it to your broker where you can.
- Not saving the layout. Drawings and studies live in the layout. So if you switch layouts without saving, recent changes can go missing. Watch the Save link under the layout name.
- Stacking too many studies. Three oscillators that all measure momentum say the same thing three times. Pick one, such as RSI, and learn it first.
- Drawing on the wrong timeframe. A trend line drawn on the 5-minute chart rarely means much on the daily. Draw on the timeframe you trade, then check how the line looks one step higher.
Where to go next
Once the chart feels familiar, add a plan around it. Our guide to risk and reward on TradingView shows the long and short position tools. Then read how to read candlestick charts so each bar makes sense.
If you want to try community-style tools we built ourselves, start with the Market Regime Detector for TradingView. It is one of our published scripts, and you add it from the same Indicators dialog. For a plain-language RSI refresher from outside the site, Babypips has a Relative Strength Index entry on Babypips Forexpedia.
FAQ
Is a TradingView chart free to use?
Yes, you can open and use a TradingView chart on a free account; paid plans add more indicators, layouts and alerts, and the exact limits change, so check your plan page.
Why does my TradingView chart price differ from my broker?
Each symbol comes from a named feed, such as OANDA or FXCM, so prices differ slightly; pick your broker’s feed in symbol search if it is listed.
How do I change the timeframe on a TradingView chart?
Click the interval button next to the symbol, “D” in our case, and choose from ticks, seconds, minutes, hours and longer, or add a custom interval.
How do I add RSI to a TradingView chart?
Click Indicators, type “Relative Strength Index” and pick the built-in version under Technicals; it opens in its own pane under price.
What is the shortcut for a trend line on TradingView?
Alt+T starts the trend line tool; then click two anchor points on the chart, and Alt+H draws a horizontal line instead.
Where are TradingView chart settings?
Click the gear icon in the top bar; the Settings dialog has Symbol, Status line, Scales and lines, Canvas, Trading, Alerts and Events tabs.
Does a TradingView chart save my drawings?
Yes, drawings and studies save inside the layout on your account, so they reopen on another browser or the desktop app once you save.
Can a TradingView chart tell me where price will go?
No, a chart only shows past and current prices, and every tool on it reads that history; results are not guaranteed; past performance is not indicative of future results.
Last updated: 28 September 2026.

About the author
Written by Dominic Walsh, a Forex trader and MT4/MT5 indicator, Expert Advisor and script developer. Every tool on forexmt4systems.com is tested on live charts before release and ships with ready-to-use compiled MT4 (.ex4) and MT5 (.ex5) files. Learn more about the trader and developer behind this site.
How we build, test and correct every tool: Editorial & Testing Policy. Trading carries risk; see the disclaimer.