
Most tools fire the same signal in every market. Market Regime Detector works differently. It is an ADX indicator TradingView traders can use to sort the chart into three states first – trending, ranging or volatile – and only then apply a rule that suits the state. Also, trending markets get an EMA cross. Ranging markets get a Bollinger band bounce. Indeed, volatile markets get no signal at all.
It is free and open source. Still, you can add it to any chart from the Market Regime Detector script page on TradingView, and the full Pine source is published there for you to read.
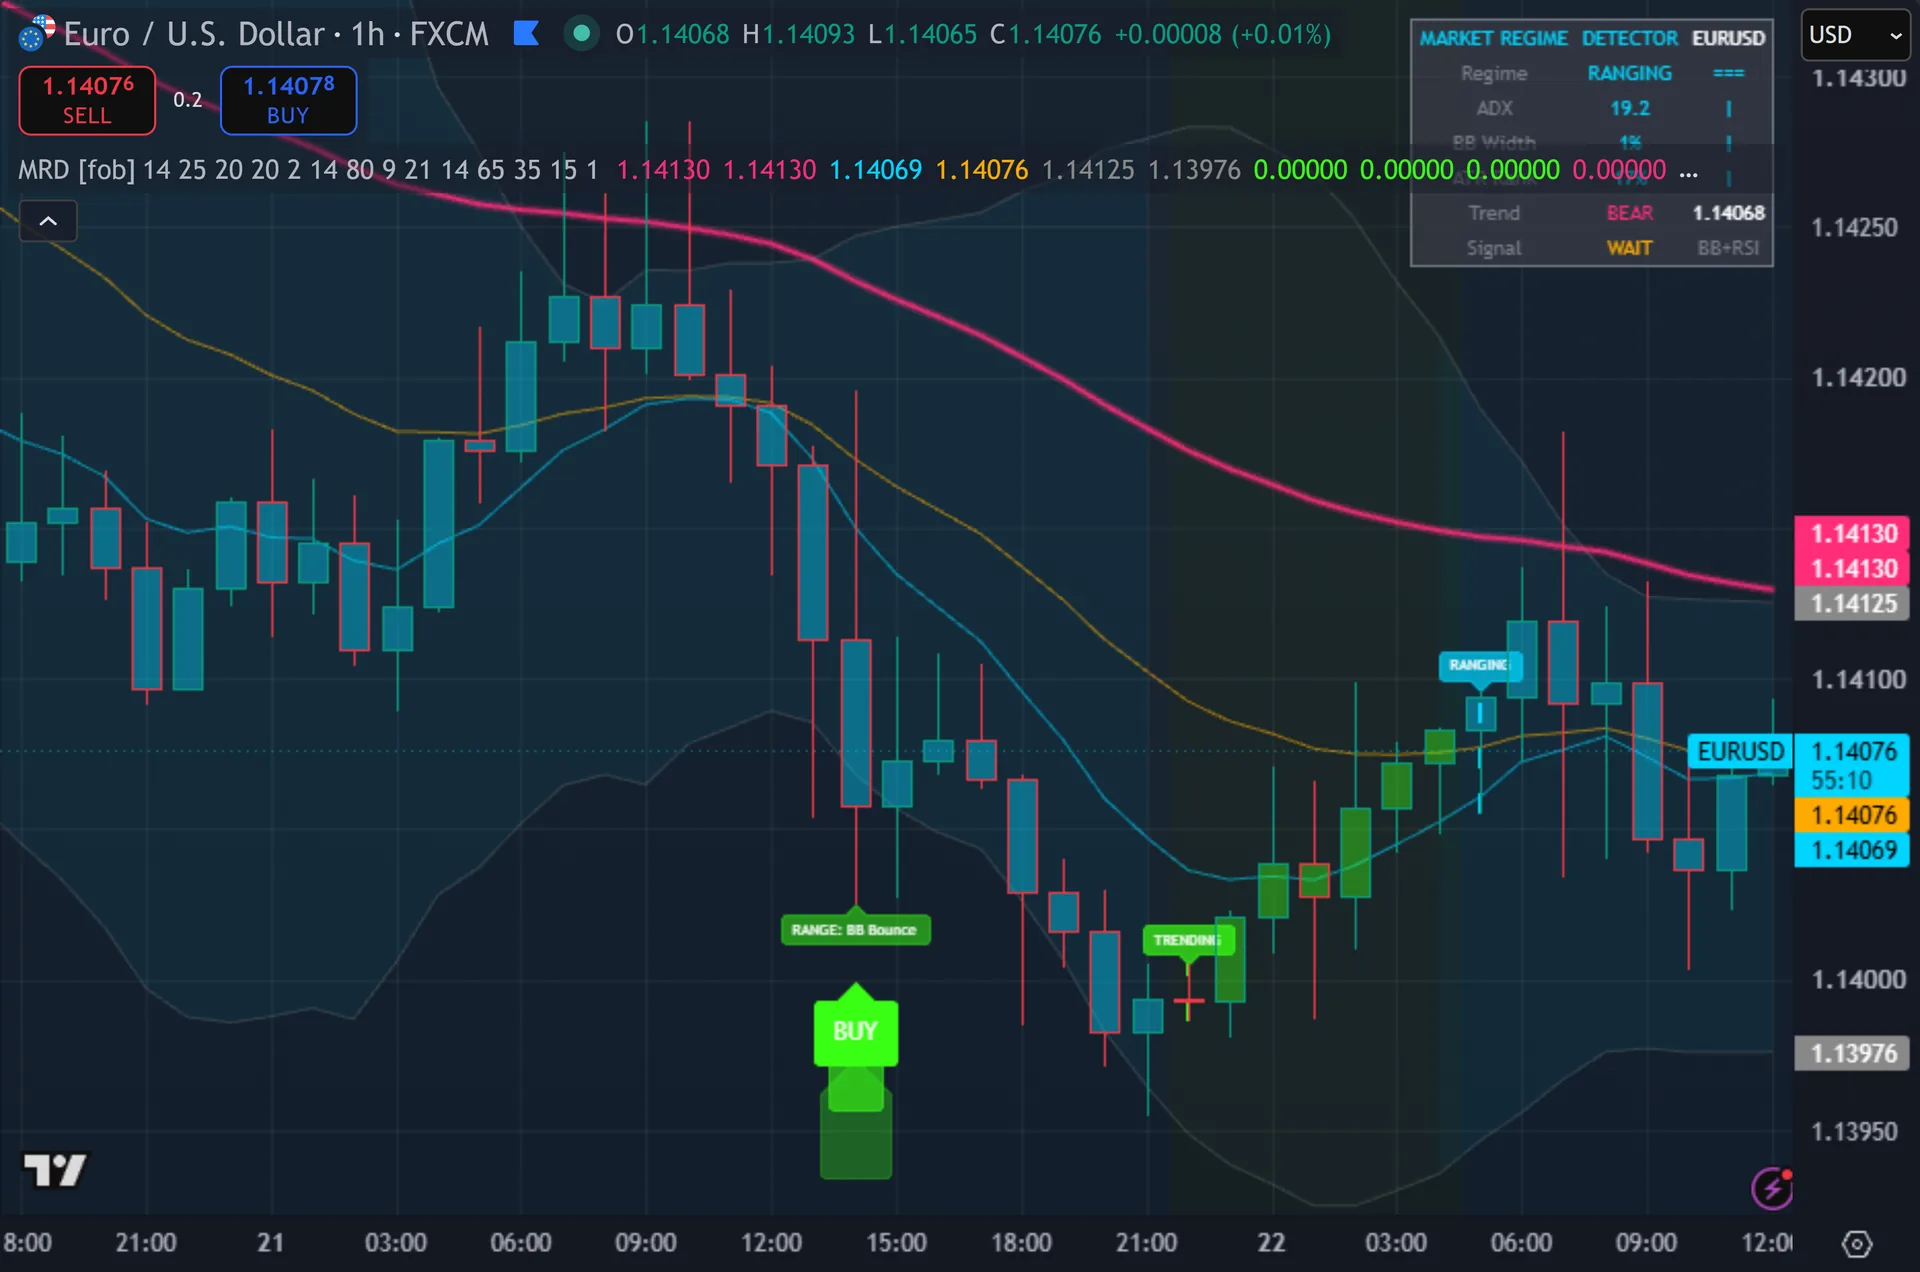
What Market Regime Detector plots on the price chart
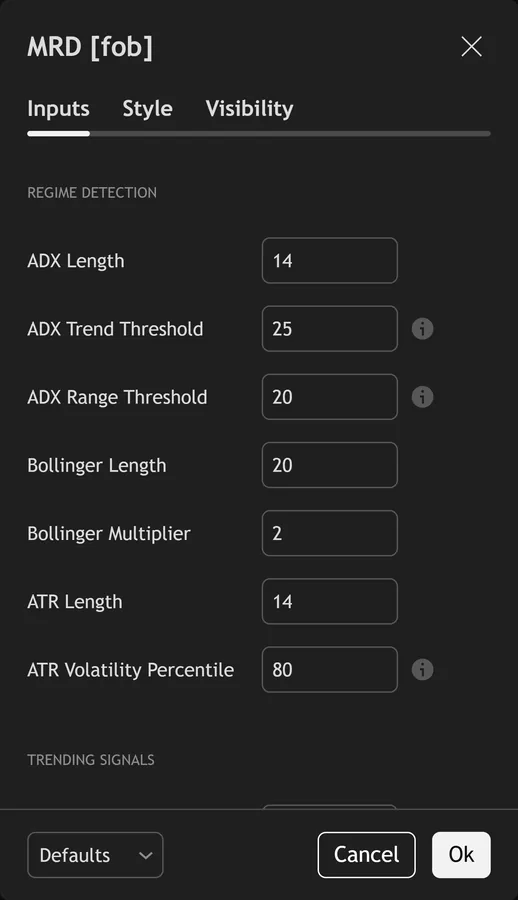
The script plots four moving averages. Thus, a thick glowing EMA50 changes colour with price, and thin EMA9 and EMA21 lines sit beside it. Bollinger bands frame the range, and the fill turns cyan when the regime reads ranging. Hence, BUY and SELL labels print on signals, each with a tag naming the source: TREND EMA Cross or RANGE BB Bounce. Every bar carries a regime colour. Next, a dashed vertical line plus a text label marks each regime change, and a seven-row dashboard sits top right.
How Market Regime Detector is built
How the regime gets classified
Three measurements drive the classification. Then, the script reads ADX over 14 bars with ta.dmi. It measures Bollinger band width as a percentage of the 20-bar basis. Yet, it also reads ATR over 14 bars. Raw ADX means something on its own. Truly, raw band width and raw ATR do not, so the script ranks both against their own last 100 bars with ta.percentrank.
Three tests then run. Plainly, trending needs ADX above 25, a band-width rank above 30 and an ATR rank under 80. Volatile needs an ATR rank above 80 or a band-width rank above 80. Also, ranging needs ADX under 20 and a band-width rank under 30. Volatile wins any tie, then trending, then ranging. Indeed, anything matching none of the three also lands in the ranging bucket, so ranging doubles as the default state.
How signals fire inside a regime
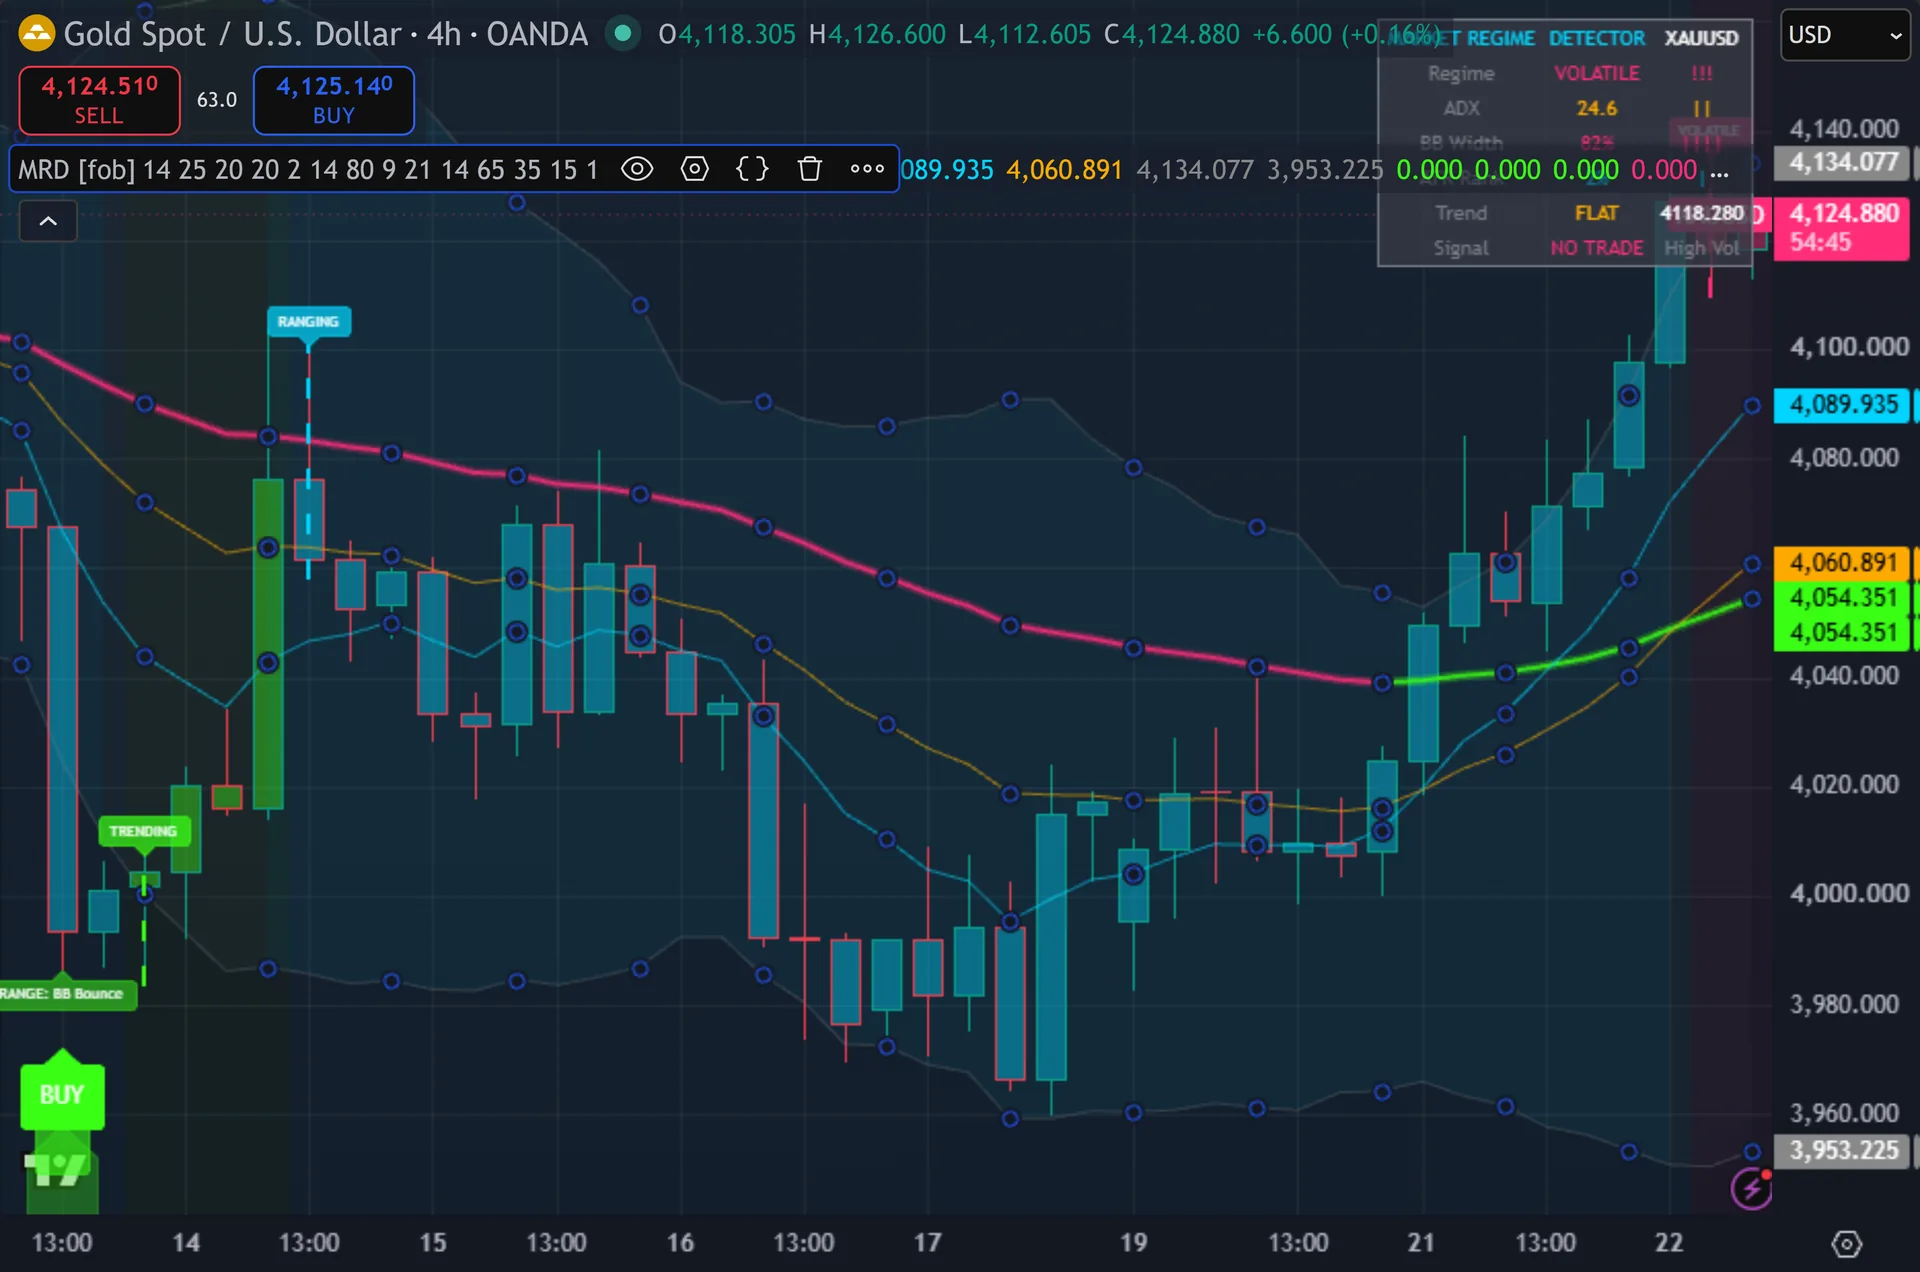
Each regime owns one rule. In a trending regime the script waits for EMA9 to cross EMA21, and it demands that the close sit on the right side of EMA50. In a ranging regime it waits for price to touch the lower Bollinger band with RSI under 35, or the upper band with RSI above 65. Still, a volatile regime issues nothing, and the dashboard simply reads NO TRADE.
Three gates then apply to both rules. Thus, volume must beat its own 20-bar average times your multiplier, which starts at 1.0. Fifteen bars must pass since the last signal in that direction. Hence, and the bar must close, because every signal gates on barstate.isconfirmed. The arrow therefore lands once the candle completes.
The dashboard reports the parts, not just the verdict. Next, it shows ADX, band-width rank, ATR rank, trend direction from EMA50 against EMA200, and the reason behind the current signal state. Small bar-strength blocks give each row a quick visual read.
How to read the signals
Read the regime row first. Then, it tells you which rule set is live, so you know what the next arrow will mean. A BUY inside a trending regime came from a momentum cross. Yet, a BUY inside a ranging regime came from a band bounce against RSI. Those are opposite trades, and they deserve different stops.
Then check ADX and the two rank rows. Truly, ADX at 32 with an ATR rank of 45 describes a clean, orderly trend. ADX at 32 with an ATR rank of 91 flips the label to volatile and shuts signals off. Plainly, the ranks matter as much as the ADX number itself.
Watch the dashed regime-change lines. Also, they mark the bar where the classification flipped. A signal taken right after a flip rests on a fresh, thinly tested state. Indeed, a signal deep inside a stable regime rests on firmer footing. The background tint carries the same information at a glance.
Every Market Regime Detector setting explained
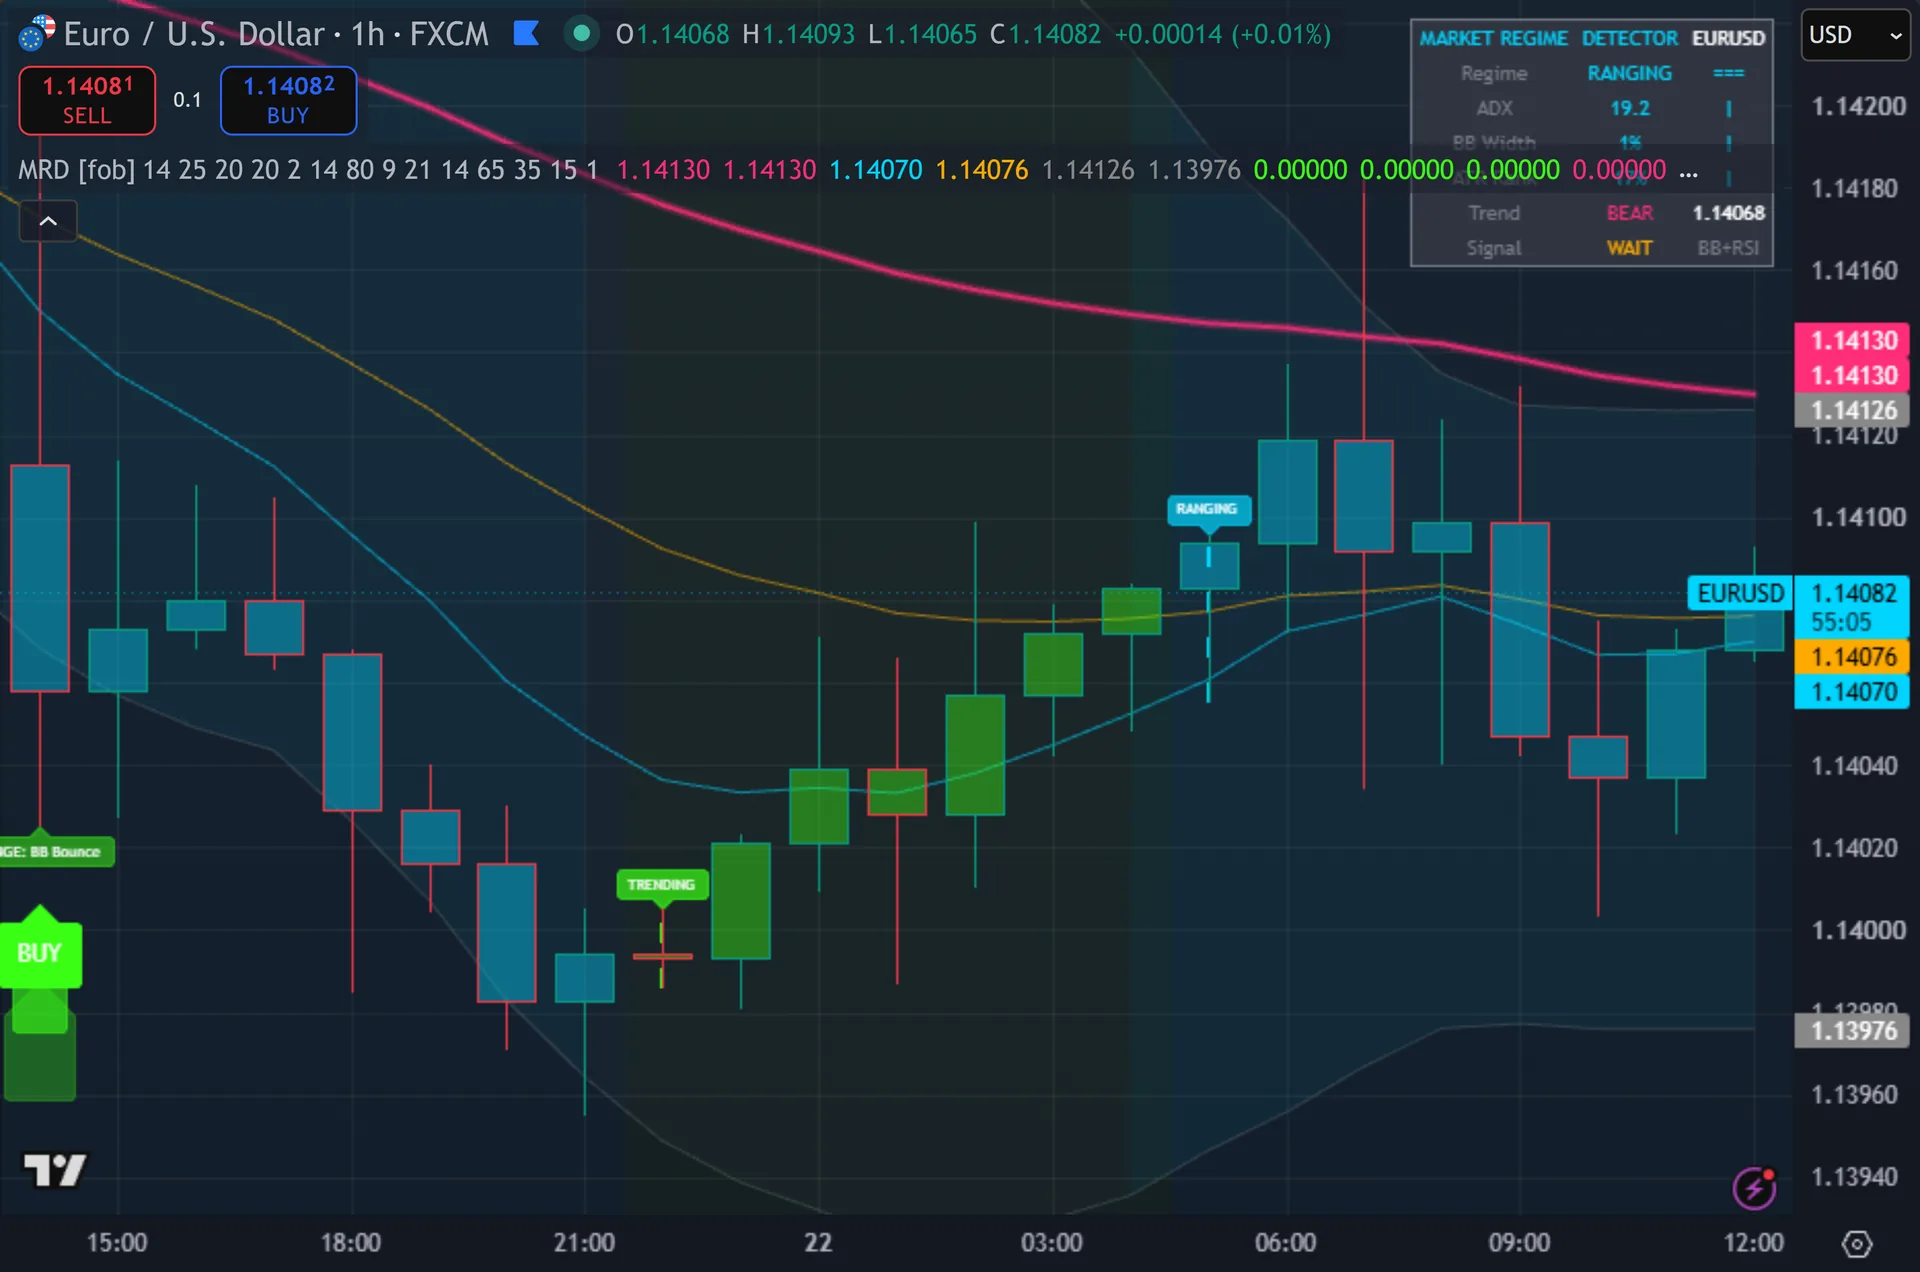
The script exposes 17 inputs, grouped in the settings panel exactly as shown below. Defaults are the published values.
Regime Detection
| Setting | What it does | Default | Range |
|---|---|---|---|
| ADX Length | Sets the adx length used in the calculation. | 14 | |
| ADX Trend Threshold | ADX above this = trending | 25 | 15 to 50 |
| ADX Range Threshold | ADX below this = ranging | 20 | 5 to 40 |
| Bollinger Length | Sets the bollinger length used in the calculation. | 20 | |
| Bollinger Multiplier | Sets the bollinger multiplier used in the calculation. | 2.0 | |
| ATR Length | Sets the atr length used in the calculation. | 14 | |
| ATR Volatility Percentile | ATR rank above this = volatile | 80 | 50 to 99 |
Trending Signals
| Setting | What it does | Default | Range |
|---|---|---|---|
| EMA Fast | Sets the ema fast used in the calculation. | 9 | |
| EMA Slow | Sets the ema slow used in the calculation. | 21 |
Ranging Signals
| Setting | What it does | Default | Range |
|---|---|---|---|
| RSI Length | Sets the rsi length used in the calculation. | 14 | |
| RSI Overbought | Sets the rsi overbought used in the calculation. | 65 | 55 to 90 |
| RSI Oversold | Sets the rsi oversold used in the calculation. | 35 | 10 to 45 |
Filters
| Setting | What it does | Default | Range |
|---|---|---|---|
| Signal Cooldown | Sets the signal cooldown used in the calculation. | 15 | |
| Volume Multiplier | Sets the volume multiplier used in the calculation. | 1.0 |
Display
| Setting | What it does | Default | Range |
|---|---|---|---|
| Show Dashboard | Toggles show dashboard on the chart. | on | on / off |
| Show Regime Background | Toggles show regime background on the chart. | on | on / off |
| Show Regime Change Lines | Toggles show regime change lines on the chart. | on | on / off |
Alerts built into Market Regime Detector
The script ships 12 alert conditions. Still, open the alert dialog on the chart, pick the indicator as the condition source, then choose the event you want. Alerts fire on the close of the bar, so they follow the same confirmed-bar rule the on-chart signals use.
- MRD Buy Signal
- MRD Sell Signal
- MRD Any Signal
- Regime Change: Trending
- Regime Change: Ranging
- Regime Change: Volatile
- Strong Trend ADX>35
- Extreme Volatility
- Low Volatility Squeeze
- Webhook JSON
Other markets and timeframes
Almost every threshold here is relative. Thus, band width and ATR both get ranked against their own last 100 bars, so a quiet pair and a fast index each get judged on their own history. ADX runs on a fixed 25 and 20 split, which is the standard reading and travels well. Hence, the volume gate is the exception. Spot forex volume comes from broker tick counts, so relative volume acts as a proxy, and symbols with no volume feed block signals outright.
Limitations worth knowing
This classifies conditions. Next, it does not manage a trade. There is no stop, no target, no position sizing and no way to rank trend strength between two symbols. Then, it tells you the market reads trending. It cannot tell you whether that trend continues.
The ranging label carries two meanings. Yet, it marks a genuine quiet range, and it also catches every bar that fits none of the three tests. So a market drifting between the thresholds still shows as ranging, and band-bounce signals then run in conditions that are not really a range.
The dashboard writes its cells on the last confirmed historical bar, so those rows do not refresh on every live tick. Truly, regime background, bar colours and the change lines all update inside the forming bar, so they can flip before the candle closes. Only the arrows wait for the close.
Get Market Regime Detector on TradingView
Open Market Regime Detector on TradingView
If you also trade MetaTrader, the MT4 and MT5 indicator library is available below.
Get the complete indicator library
One email unlocks the full MT4 and MT5 indicator library. Plainly, this TradingView script stays free on TradingView – the button above adds it to your chart.
Using it alongside MetaTrader
Adding a script on TradingView takes one click, so there is no install step here. Also, if you want the same idea on MetaTrader, the MT4 and MT5 indicator installation guide walks through copying files into the data folder and attaching them to a chart. You can also browse the full MetaTrader indicator library, the MT4 indicators section, or the other free TradingView scripts published on this profile. For related chart tools see the MT5 indicators section and the forex trading strategies guides.
External references
Frequently asked questions
Does the Market Regime Detector repaint?
Signals do not. Indeed, every BUY and SELL gates on barstate.isconfirmed, so an arrow prints only after the bar closes. The regime background, the bar colours and the regime-change lines do update inside the forming bar, so those can still change until the candle finishes.
Why did a clean EMA cross print no arrow?
Four gates can block it. Still, the regime read volatile or ranging rather than trending. The close sat on the wrong side of EMA50. Thus, volume failed the 20-bar average test. Or the 15-bar cooldown had not elapsed since the last buy.
What do the ATR and band-width percentages mean?
Both are percentile ranks over the last 100 bars, not raw values. Hence, an ATR rank of 90 says current ATR sits higher than 90 percent of the last 100 readings. That keeps the volatile test fair across fast and slow symbols.
Does it read higher timeframe data?
No. Next, the script contains no request.security call, so every reading comes from the timeframe you load it on. Add a second copy on a higher timeframe if you want a bias filter above it.
How much should I rely on this indicator?
Treat it as one input, not a decision. Then, it is a chart analysis tool, not trading advice. Test it on your own markets and timeframes before relying on it. Results are not guaranteed; past performance is not indicative of future results.

About the author
Written by Dominic Walsh, a Forex trader and MT4/MT5 indicator, Expert Advisor and script developer. Every tool on forexmt4systems.com is tested on live charts before release and ships with ready-to-use compiled MT4 (.ex4) and MT5 (.ex5) files. Learn more about the trader and developer behind this site.
How we build, test and correct every tool: Editorial & Testing Policy. Trading carries risk; see the disclaimer.