
TradingView Dow Jones futures sit under a handful of symbols, and the right one depends on what you want to see. This guide settles which symbol to load, what one point is worth in dollars, how the futures differ from the cash Dow, and which hours of the day actually move the price. Every number below comes from bars we pulled from TradingView between July 2025 and 1 October 2026.
What Dow Jones futures are on TradingView
The Dow Jones Industrial Average tracks 30 large US companies. It is price-weighted, so a high-priced stock moves it more than a cheap one. You can read the index history in the Dow Jones Industrial Average article on Wikipedia. The index itself is a number, not a product.
Dow futures are contracts that track that number. They trade on CBOT, part of CME Group, almost around the clock on weekdays. On TradingView you will meet three symbols:
- CBOT_MINI:YM1!: the E-mini Dow ($5) futures, continuous front month. One index point is worth $5.
- CBOT_MINI:MYM1!: the Micro E-mini Dow, also continuous. One point is worth $0.50, a tenth of YM.
- TVC:DJI: the cash index. It only updates while the New York stock market is open.
So the futures show you overnight moves, while DJI shows the official index. In short, use YM1! or MYM1! to watch the market live and DJI to check where the index closed. The point values come from the YM1! symbol page on TradingView, which describes the contract and links the micro version.
How continuous and dated contracts work
A futures contract expires. Dow futures run on a quarterly cycle: March (H), June (M), September (U) and December (Z). Each dated contract has its own symbol, such as YMZ2026 for December 2026.
The “1!” suffix tells TradingView to stitch the front contracts together into one long chart. Our captures show the price label “YMZ2026” next to the YM1! line. That means the continuous chart was reading the December 2026 contract on 1 October 2026. When December expires, YM1! rolls to the March 2027 contract. Then the chart jumps to a new series of prices.
The money math is simple. The formula is dollar move = points moved x point value x contracts. A 100-point move is $500 on one YM and $50 on one MYM. Because both track the same index, the micro and the E-mini draw almost the same chart. Only the dollar scale differs.
A dated symbol is useful when you hold a position near expiry. In that case, load the exact month you trade, not the continuous one. Otherwise, YM1! is fine for analysis. If you are new to contracts in general, the CFTC’s basics of futures trading explains margin, expiry and daily settlement in plain terms. Also see our guide to the difference between forex and futures.
How we tested
We used the TradingView web chart on our own account. We loaded CBOT_MINI:YM1!, CBOT_MINI:MYM1! and TVC:DJI on the daily timeframe. Each export held 299 daily bars. For YM1! and MYM1! the window ran from 25 July 2025 to 30 September 2026. For DJI it ran from 23 July 2025 to 29 September 2026.
Next, we pulled hourly YM1! and MYM1! bars from 14 September to 1 October 2026 (09:00 UTC). We then grouped each bar by its UTC hour and took the average high-to-low range. For DJI, the hourly window ran from 31 July to 30 September 2026. ATR(14) and the average daily range came from the same daily bars.
Our account does not pay for real-time CBOT data. TradingView labels the symbol “CBOT_MINI_DL:YM1! – Market open – Data is delayed”. That delay does not change a closed bar. The screenshots were taken on 1 October 2026 during the session, so the last bar on each chart is still open. Our full method is in the editorial testing policy.
Dow futures symbols and settings at a glance
The table sums up what we measured for each symbol. Ranges are in index points. Dollar values use the point value of one contract.
| Item | YM1! (E-mini) | MYM1! (Micro) | DJI (cash) |
|---|---|---|---|
| Point value | $5 | $0.50 | Not tradable |
| Last close in window | 51,278 (30 Sep 2026) | 51,278 (30 Sep 2026) | 51,355.13 (29 Sep 2026) |
| Change over window | +13.74% | +13.74% | +14.1% |
| Window high | 54,884 (5 Aug 2026) | 54,885 (5 Aug 2026) | 54,749.47 (5 Aug 2026) |
| Window low | 43,464 (1 Aug 2025) | 43,464 (1 Aug 2025) | 43,340.68 (1 Aug 2025) |
| ATR(14), last | 610.9 | 608.6 | 501.9 |
| Average daily range | 608.8 | 610.6 | 496.5 |
| Widest day | 1,757 (23 Mar 2026) | 1,752 (23 Mar 2026) | 1,260.5 (9 Mar 2026) |
| Average range in dollars | about $3,044 | about $305 | n/a |
The micro and the E-mini match within a few points on every line. The cash index moves less per day, because it only counts the hours when stocks trade.
Reading TradingView Dow Jones futures on a chart
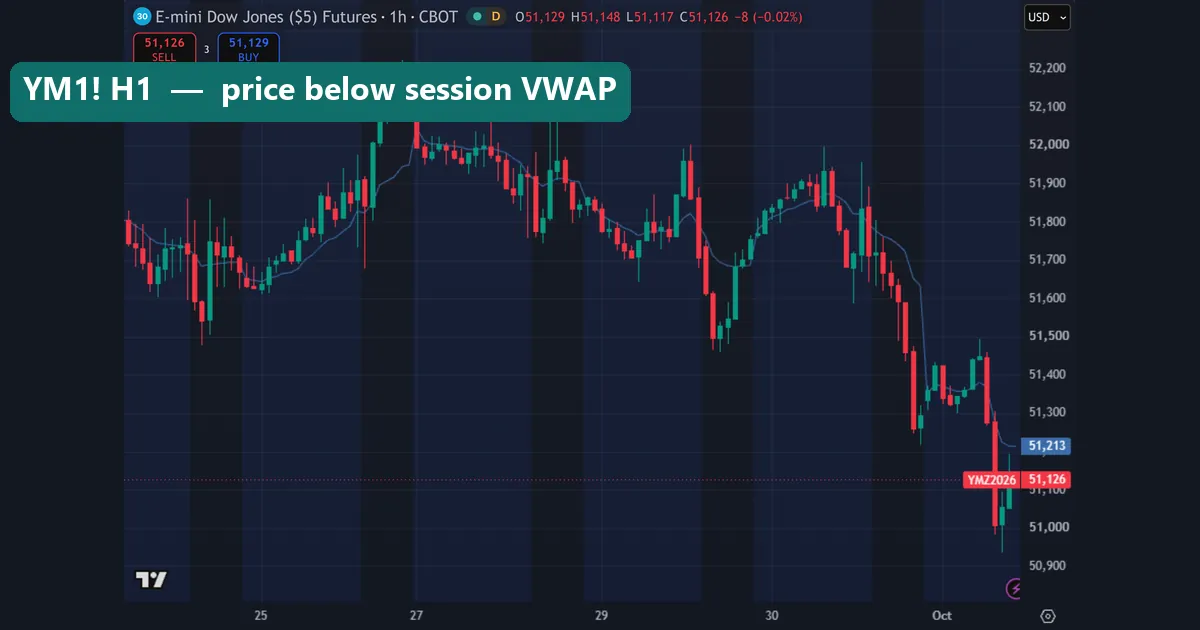
Type “YM1!” in the symbol search and pick the CBOT_MINI result. The legend then reads “E-mini Dow Jones ($5) Futures”. Look next to it for a small orange “D”. That badge means the feed is delayed. Below the legend, the sell and buy boxes show the bid and ask. On our hourly capture they read 51,136 and 51,139, a 3-point gap.
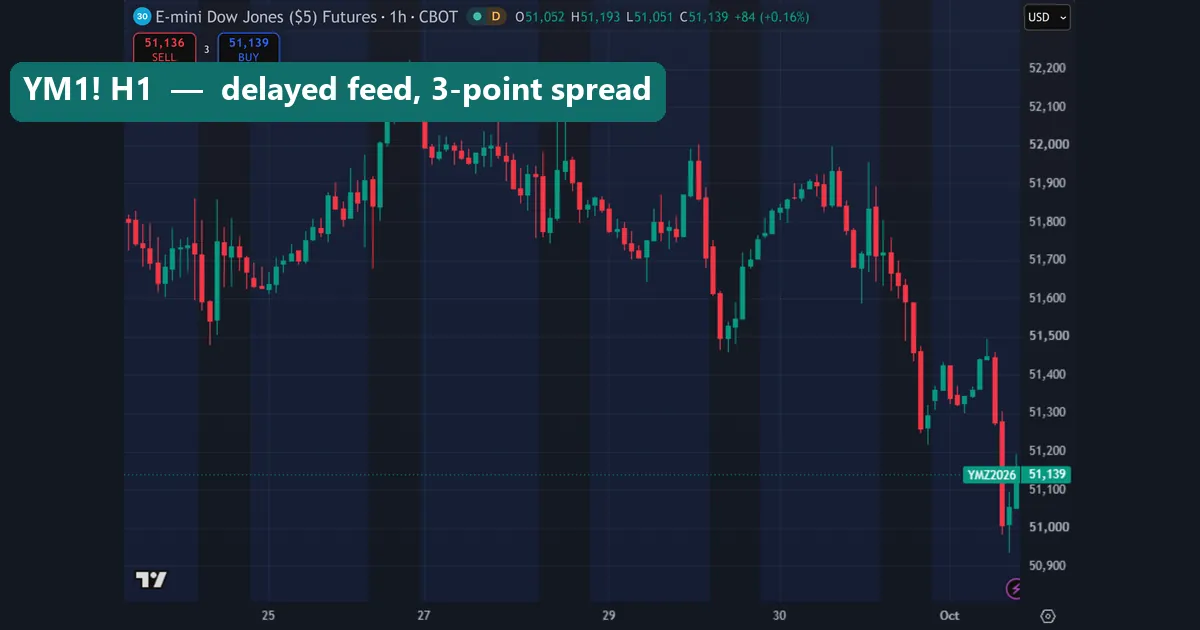
The hourly chart covers late September into 1 October 2026. Most of the week holds between about 51,600 and 52,200 on the price scale. Then the last day drops toward 51,000. The legend shows the open bar at 51,139.
Now switch the symbol to MYM1!. The chart barely changes, which is the point. The legend reads “Micro E-mini Dow Jones Industrial Average Index Futures” and the price label shows MYMZ2026. On our capture, the buy and sell boxes were just 1 point apart, at 51,143 and 51,144.
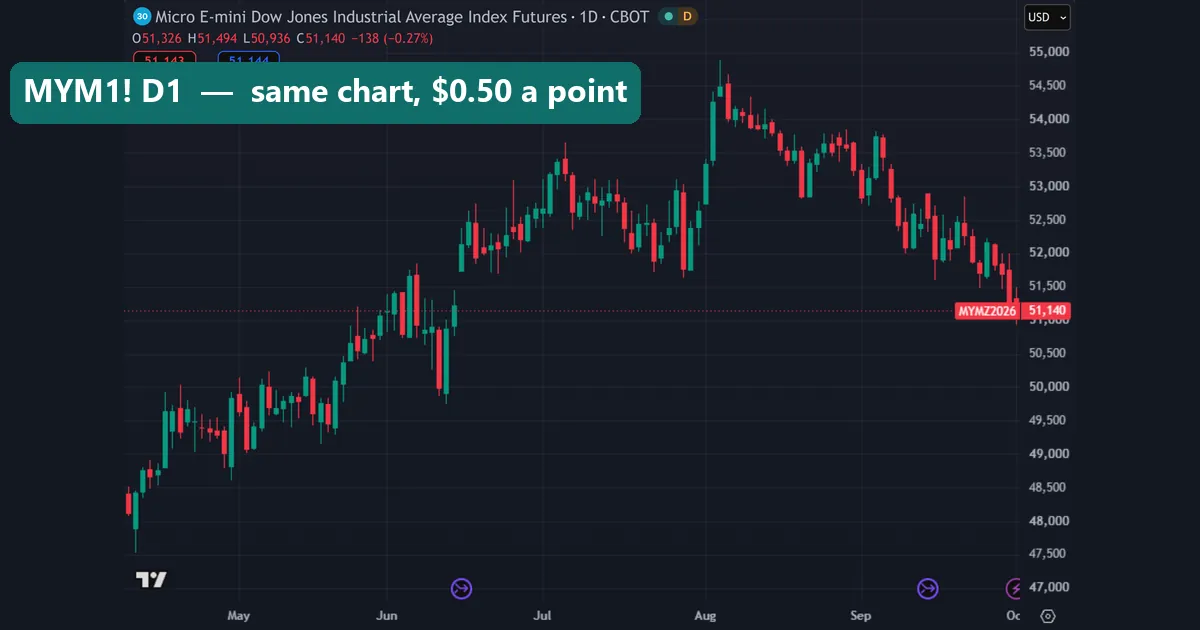
Either symbol works for reading levels. However, pick the one you would actually trade, so your alerts and drawings sit on the right contract. Our TradingView chart guide covers the layout, saving and alerts in more detail.
Which hours move Dow futures the most
We grouped every hourly YM1! bar from 14 September to 1 October 2026 by its UTC hour and averaged each range.
| UTC hour | YM1! average range (points) | Dollars per YM |
|---|---|---|
| 03:00 | 44.9 | about $225 |
| 07:00 | 118.2 | about $591 |
| 12:00 | 141.5 | about $708 |
| 13:00 | 279.6 | about $1,398 |
| 14:00 | 198.8 | about $994 |
| 18:00 | 162.0 | about $810 |
| 20:00 | 63.1 | about $316 |
| 23:00 | 51.2 | about $256 |
The 13:00 UTC bar averaged 279.6 points. That is about six times the quietest hour, 03:00 UTC, at 44.9 points. In late September, New York runs on UTC-4, so 13:00 UTC is 9:00 to 10:00 in New York. That hour holds the 9:30 stock market open. The NYSE holidays and trading hours page lists that schedule.
Also note the gap. Our data has no 21:00 UTC bar at all, because the futures pause for a daily break at that hour. After the break, the 22:00 and 23:00 bars stay quiet. For a wider view of the clock, see our page on the New York trading session.
Worked example: the 23 March 2026 range day
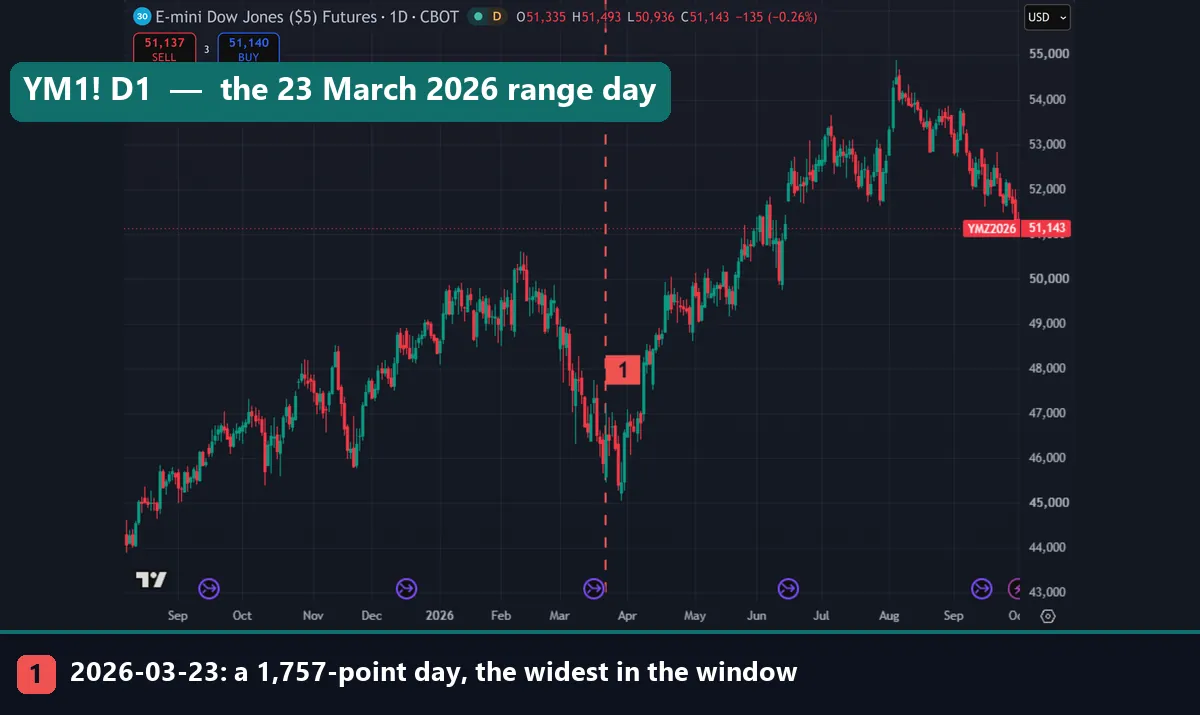
Marker 1 on our first chart flags 23 March 2026. On that day YM1! moved 1,757 points from high to low. It was the widest day in our 299-bar window.
Here is what that means in money. On one YM contract, 1,757 points times $5 is $8,785. On one MYM, the same day measured 1,752 points. Times $0.50, that is $876. So the same market move cost or paid ten times more on the E-mini.
Now compare it with a normal day. The average daily range was 608.8 points on YM. That is about $3,044 per contract. On MYM, 610.6 points works out to about $305. In other words, the widest day was close to three times a normal one.
Next, look at the full window. The high was 54,884 on 5 August 2026. The low was 43,464 on 1 August 2025. That spread is 11,420 points, or $57,100 on a single YM. The close moved from 45,084 to 51,278, a gain of 13.74%.
The lesson is about size. A trader who holds one YM through a day like 23 March must be able to take a five-figure swing. For most small accounts, the micro is the only contract where one ordinary day stays in the hundreds of dollars. Our futures position size calculator runs this math for any stop distance.
YM futures vs the DJI cash index
TVC:DJI is the official index as published. On our capture, its last bar closed at 50,911.09, down 444.03 points or 0.86%. Look at the buy and sell boxes: both show 50,911.09, with a gap of 0.00. That is because nobody trades the index itself. There is no bid and no ask.
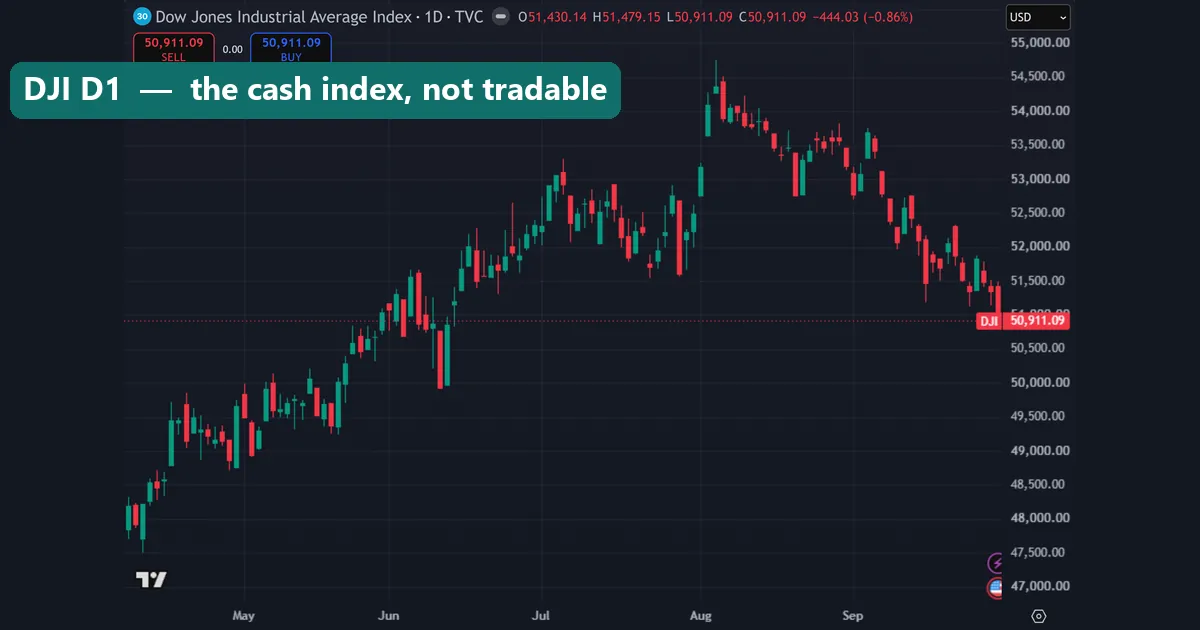
First, the futures price includes the cost of carry until expiry, so YM and DJI rarely print the same value. Second, DJI’s average daily range was 496.5 points, while YM’s was 608.8. The futures range is wider because it counts overnight trading.
Even the widest days differ. DJI’s widest day was 9 March 2026, at 1,260.5 points. YM’s was 23 March 2026, at 1,757 points. Also, DJI’s hourly data starts with the 13:30 UTC bar, which averaged 300.3 points. That first hour is its busiest, then the ranges fade into the afternoon. In short, use DJI as the reference and YM1! for trading hours.
Sizing with ATR(14) on the daily chart
The Average True Range measures how far price usually travels in a bar, including gaps. Our guide to ATR covers the formula. On TradingView, add “Average True Range” from the indicators menu and keep the length at 14.
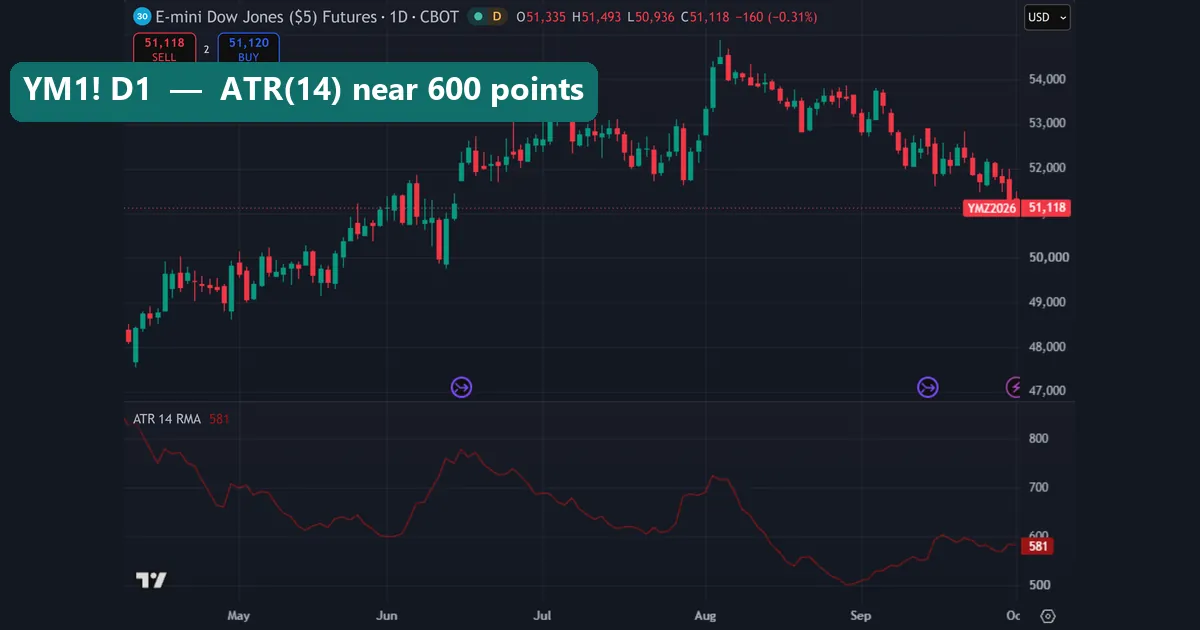
On our capture, the ATR 14 RMA pane reads 581. That reading includes the 1 October bar, which was still open. Our export, which stops at the 30 September close, put ATR(14) at 610.9. Either way, a typical day is about 600 points. The pane also shows how much that changes. It climbs toward 800 in mid June, then sinks to about 500 in late August.
So here is a simple way to use it. Take ATR as your stop distance. One ATR of 610.9 points on YM is about $3,054 per contract. On MYM, 608.6 points is about $304. Then divide the money you are willing to risk by that figure to get a contract count. If the answer is below one YM, the micro is the honest choice. Our page on ATR stop loss distance shows other multiples.
Download the complete indicator database
Put these concepts on your charts. One email unlocks the full library of 1,380+ indicators with compiled MT4 and MT5 files, plus my TradingView scripts. No paywall, no spam, unsubscribe any time.
Get free access to my indicator database
One email unlocks 1,380+ free MT4, MT5 and TradingView indicators — the complete library. No single-tool download; you get the whole database.
Where it fails
Delayed data is the first limit. With a free or basic feed, the YM1! price you see is behind the live market. That is fine for study but poor for entries. If you trade from TradingView, check the legend for the “D” badge first.
Continuous charts also distort old prices. At each roll, YM1! switches to a new contract. If the two contracts trade at different prices, the chart shows a small jump that never happened in any single contract. As a result, a moving average or a backtest across a roll date can be off.
Our hourly sample is short. It covers about two and a half weeks in September 2026. All of it falls in New York summer time, so the busy hour shifts by one hour in winter. A calm or wild fortnight would change every figure in our hourly table.
ATR is backward-looking. It told us a normal day was about 600 points, yet 23 March 2026 moved 1,757. No average warns you about the next outlier.
Finally, our tests measure ranges, not results. We did not trade any of these numbers. Nothing here shows that any entry rule makes money on Dow futures.
Session VWAP and the weekly frame
Session VWAP is a volume-weighted average price that resets each session. On the hourly YM1! chart, the “VWAP Session hlc3” line read 51,213. Price sat below it at 51,126. That tells you sellers had the upper hand for the session so far, nothing more. During the week, price crossed the line many times, so treat it as a reference, not a signal. Our VWAP calculator guide shows how the line is built.
The weekly chart gives the long frame. It runs from early 2024. You can see the sharp spring 2025 drop, the steady climb into 2026, and the dip that bottomed near 45,000 around the March 2026 widest day. The peak in August 2026 lines up with the 54,884 high.
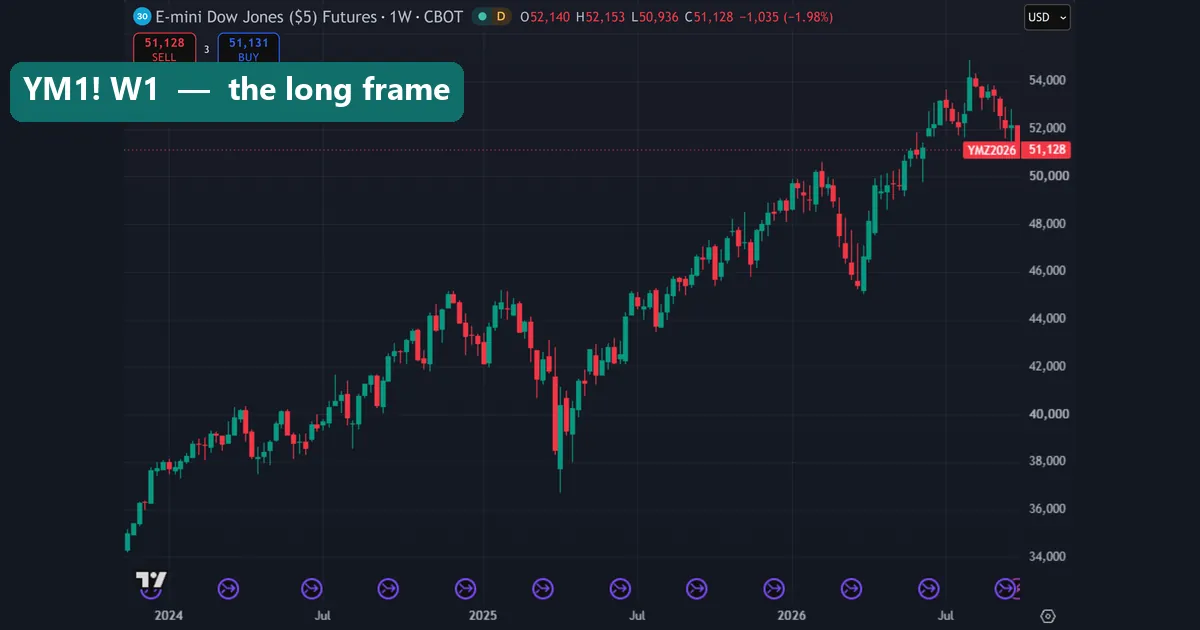
Also note the current weekly bar. It opened at 52,140 and read 51,128 on our capture, down 1,035 points or 1.98%. For more on stacking frames, see our multi-timeframe analysis guide.
Common mistakes
- Mixing up YM and MYM sizes. The charts look the same, but one point is $5 on YM and $0.50 on MYM. A stop that costs $300 on the micro costs $3,000 on the E-mini.
- Trading off a delayed feed. The “D” badge means the price lags. Instead, use your broker’s platform or a real-time feed for entries.
- Treating DJI as tradable. The cash index has no bid or ask. Also, it is blank overnight, so it hides moves that futures traders feel.
- Ignoring the 13:00 UTC hour. In our sample, it moved more than any other hour. A stop sized for the Asian hours will not survive it. Check the economic calendar too, since US data often lands just before it.
Where to go next
If you trade more than one US index, our sister guide on TradingView Nasdaq 100 futures covers NQ and MNQ with the same method. For a fear gauge on the same screen, read our TradingView VIX chart guide. Also, if you want to script your own session tools, start with our notes on the Pine Script documentation.
FAQ: TradingView Dow Jones futures
What is the symbol for Dow Jones futures on TradingView?
Use CBOT_MINI:YM1! for the E-mini Dow and CBOT_MINI:MYM1! for the micro. Both are continuous front-month charts.
How much is one point on YM and MYM?
One point is $5 on YM and $0.50 on MYM, so a 100-point move is $500 or $50 per contract.
Why is TradingView Dow futures data delayed?
Exchange data costs extra, so without a CBOT real-time feed TradingView shows a “D” badge and a delayed price.
What is the difference between YM1! and DJI?
YM1! is a tradable futures contract that moves almost all day, while DJI is the cash index that only updates during New York stock hours.
What does YMZ2026 mean on the chart?
It is the December 2026 contract, which the continuous YM1! chart was reading on 1 October 2026.
Which hour moves Dow futures the most?
In our September 2026 sample, the 13:00 UTC bar averaged 279.6 points, the widest of any hour.
How big is a normal day on Dow futures?
Over our window, the average daily range was 608.8 points on YM, about $3,044 per contract.
Can these numbers predict tomorrow’s move?
No, they describe past ranges only, and the widest day was almost three times the average; results are not guaranteed; past performance is not indicative of future results.
Last updated: 1 October 2026.

About the author
Written by Dominic Walsh, a Forex trader and MT4/MT5 indicator, Expert Advisor and script developer. Every tool on forexmt4systems.com is tested on live charts before release and ships with ready-to-use compiled MT4 (.ex4) and MT5 (.ex5) files. Learn more about the trader and developer behind this site.
How we build, test and correct every tool: Editorial & Testing Policy. Trading carries risk; see the disclaimer.