
The MOVE index is the bond market’s version of the VIX: one number for how far options traders expect US Treasury yields to swing over the next month. This guide settles three questions. What does the number measure, what does a reading like 100 mean, and what can a currency trader do with it? We checked it against 2,891 trading days since 2015. A high reading did go with bigger days in both yields and USD/JPY, but it told us nothing about direction.
What the MOVE index measures
ICE states the definition plainly in ICE’s 2019 press release on the MOVE index. The index tracks the implied yield volatility of a basket of one-month over-the-counter options on 2-year, 5-year, 10-year and 30-year Treasuries. ICE also gives the nickname: the “VIX for Bonds.”
Implied is the word that matters. The number comes from option prices, so it shows what traders pay for protection against yield swings, not what yields already did.
MOVE began as the Merrill Lynch Option Volatility Estimate, and ICE bought it from Bank of America Merrill Lynch in 2019. Harley Bassman created it, as ICE’s interview with Harley Bassman notes.
So why would a forex trader care? Treasury yields feed into the rate gaps between currencies, as our guide to how bond yields move forex explains. Our page on how interest rates affect currencies goes deeper. A gauge of yield uncertainty therefore gives useful background for dollar pairs.
How it works: from option prices to one number
The build has three steps.
- One-month, at-the-money options on four Treasury maturities trade over the counter. At the money means the strike sits near the current price.
- ICE Data Derivatives supplies the mid-implied volatilities for those bond options and swaptions.
- ICE combines them into one value. It publishes in near real time from 9 a.m. ET and sets the close from 3 p.m. ET readings.
The release lists the maturities but not the weights, so we do not quote a weighting. Bassman told ICE you can turn the index into basis points of yield, where one basis point is one hundredth of a percentage point. His shortcut is the closest thing to a formula:
expected daily yield move in basis points = MOVE / 16
At a MOVE of 100 he gets roughly six basis points a day, close to close, for about 21 trading days. The 16 is roughly the square root of the trading days in a year, which turns an annual figure into a daily one. The same rule works on the VIX: a VIX of 15 means about 0.9% a day on the S&P 500.
How we tested the MOVE index
We read the index on the TradingView web chart, symbol TVC:MOVE, on daily and weekly bars, and pulled the data on 3 November 2026. Daily closes run from 12 November 2002 to 2 November 2026. We compared them with TVC:US10Y for the 10-year yield, OANDA:USDJPY for the yen and TVC:VIX for stocks.
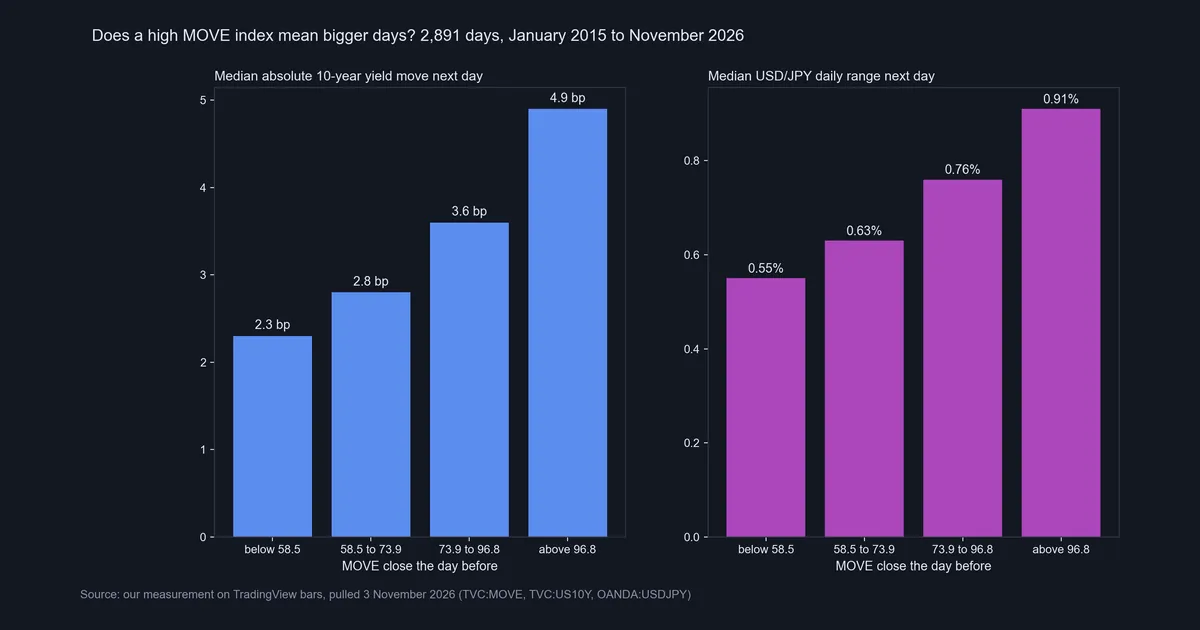
The main test ran from January 2015 to November 2026, which gave 2,891 days. First, we took the MOVE close from the day before, so the test could not peek ahead. Next, we sorted those days into four groups, with limits at 58.5, 73.9 and 96.8. Then we took each group’s median absolute change in the 10-year yield and its median USD/JPY daily range.
Older MOVE bars in this feed have no real highs and lows, so we use closes only. The feed also holds one bad print: 58.3 on 22 August 2013, between 98.8 and 99.8. It shows as a thin drop in 2013 on our two long charts, and it is a data error. We ran no trades, so these figures describe market behaviour only. See our editorial testing policy for how we run tests.
Index parameters: nothing to tune
The MOVE has no inputs. ICE calculates it and you only read it. These fixed parameters come from the ICE release and the Bassman interview.
| Parameter | Value |
|---|---|
| Option horizon | One month, about 21 trading days |
| Treasury maturities | 2, 5, 10 and 30 years |
| Option type | Over the counter, at the money |
| Intraday publication | Near real time, from 9 a.m. ET |
| Closing level | Calculated as of 3 p.m. ET |
| Related indices | MOVE3M and MOVE6M for longer expiries; the SMOVE series for swaps |
The 3 p.m. close falls before the forex daily bar ends, so a MOVE bar and a USD/JPY bar never finish together. That is one more reason we used the prior day’s MOVE close.
How to read a MOVE index level
A level only means something next to its own history. This table gives the key marks since November 2002. The last column is our arithmetic from Bassman’s shortcut, not a forecast.
| Mark | MOVE close | MOVE / 16, basis points a day |
|---|---|---|
| Lowest close, 29 September 2020 | 36.6 | 2.3 |
| 10th percentile | 54.1 | 3.4 |
| Median | 80.2 | 5.0 |
| Latest close, 2 November 2026 | 100.4 | 6.3 |
| 90th percentile | 125.8 | 7.9 |
| Highest close, 10 October 2008 | 264.6 | 16.5 |
So the latest close is higher than 70.9% of past closes: raised, but nowhere near a stress peak. The window changes the answer too. Since 2015, a reading of 100.4 falls in the top quarter of days, above the 96.8 limit. Over the full history it falls just outside the top quarter, because earlier years, such as 2008 and 2009, hold many higher closes.
Bassman called a MOVE of 110 no shock at that time, since realized volatility was already in the low 100s. So also compare the level with what yields are actually doing.
Reading the MOVE on a chart
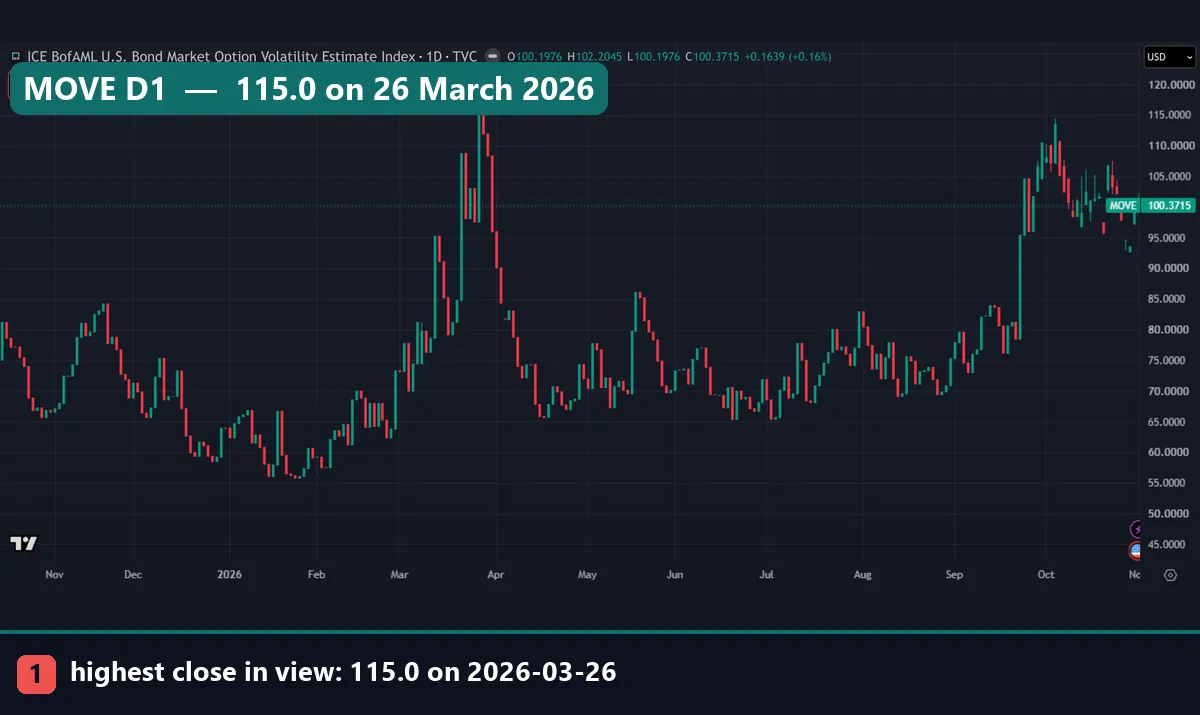
The index sat near 56 in late January 2026, then closed at 115.0 on 26 March, the highest close in view. So it more than doubled in two months. By mid-April it was back under 70. A second burst came in late September, from about 80 to above 105, and it reached about 114 in early October. Ignore the buy and sell boxes in the chart corner: they belong to TradingView’s layout.
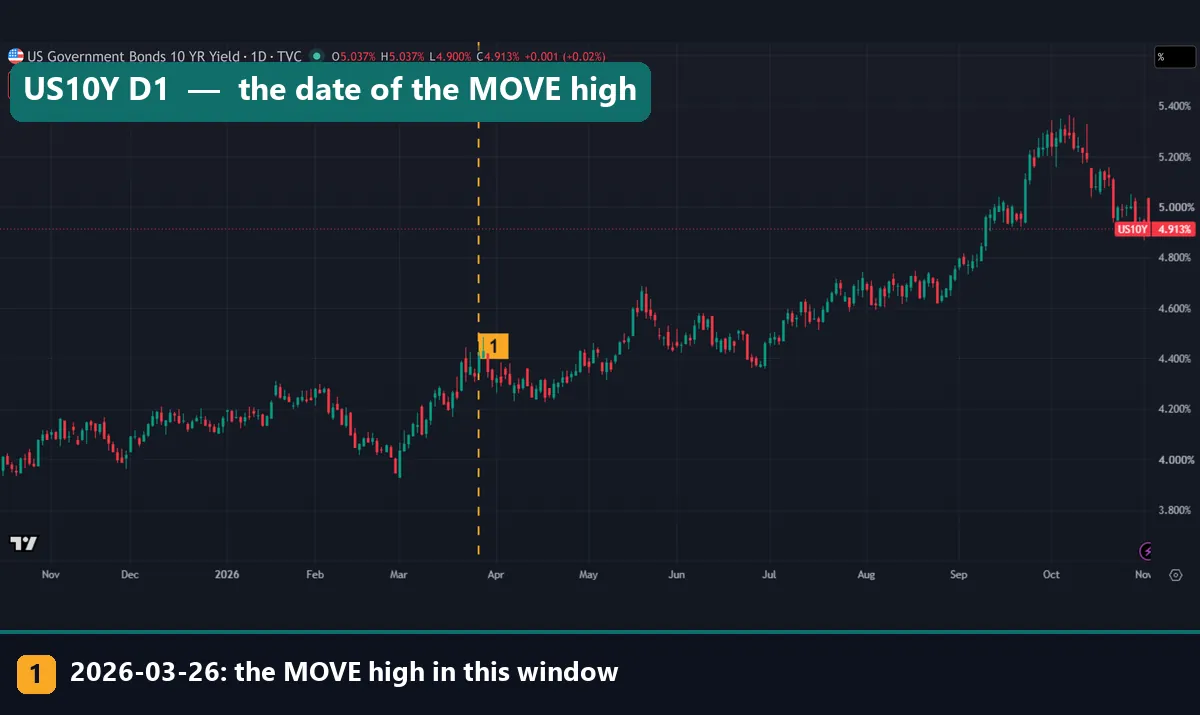
Now put the 10-year yield beside it. At the 26 March mark the yield stood near 4.4%, up from just under 4.0% at the end of February. Yields moved fast and the MOVE rose. The next stretch suggests that speed matters more than distance. From May to mid-September the yield climbed from about 4.4% to about 5.0%, while the MOVE stayed between about 65 and 86.
Later, yields peaked near 5.3% in early October and then fell to about 4.9%, yet the MOVE held close to 100. So a high reading can come with yields going either way. Bassman calls the index a window between now and the next payroll number. That means the non-farm payrolls report and the FOMC meeting can sit inside its one-month view.
Worked example: a MOVE index reading of 100.4
Here is how we would read the 2 November 2026 close.
- Place it. It beats 70.9% of past closes and sits well above the 80.2 median.
- Convert it. 100.4 / 16 gives about 6.3 basis points a day.
- Find its group. It is above 96.8, so it belongs in the last row below.
- Turn the range into pips. USD/JPY last traded at 158.175 on our chart. So 0.91% is about 1.44 yen, or 144 pips. In the lowest group, 0.55% is about 0.87 yen, or 87 pips.
| MOVE close the day before | 10-year yield move, next-day median | USD/JPY range, next-day median |
|---|---|---|
| Below 58.5 | 2.3 bp | 0.55% |
| 58.5 to 73.9 | 2.8 bp | 0.63% |
| 73.9 to 96.8 | 3.6 bp | 0.76% |
| Above 96.8 | 4.9 bp | 0.91% |
So the top group’s yield move was more than double the bottom group’s, and its USD/JPY range was about 65% wider. The 4.9 sits below the 6.3 from the shortcut, but they measure different things: a median of actual moves in one maturity against an option-implied size across a basket. Watch the order of the rows, not that gap.
What would we change at this reading? Only the size of what we expect. A stop set in a quiet spell sits closer to normal noise when ranges run 65% wider. So recheck it against ATR, then use ATR position sizing to keep the money at risk the same. Our forex volatility calculator gives a quick check by pair. Nothing here says whether to buy or sell.
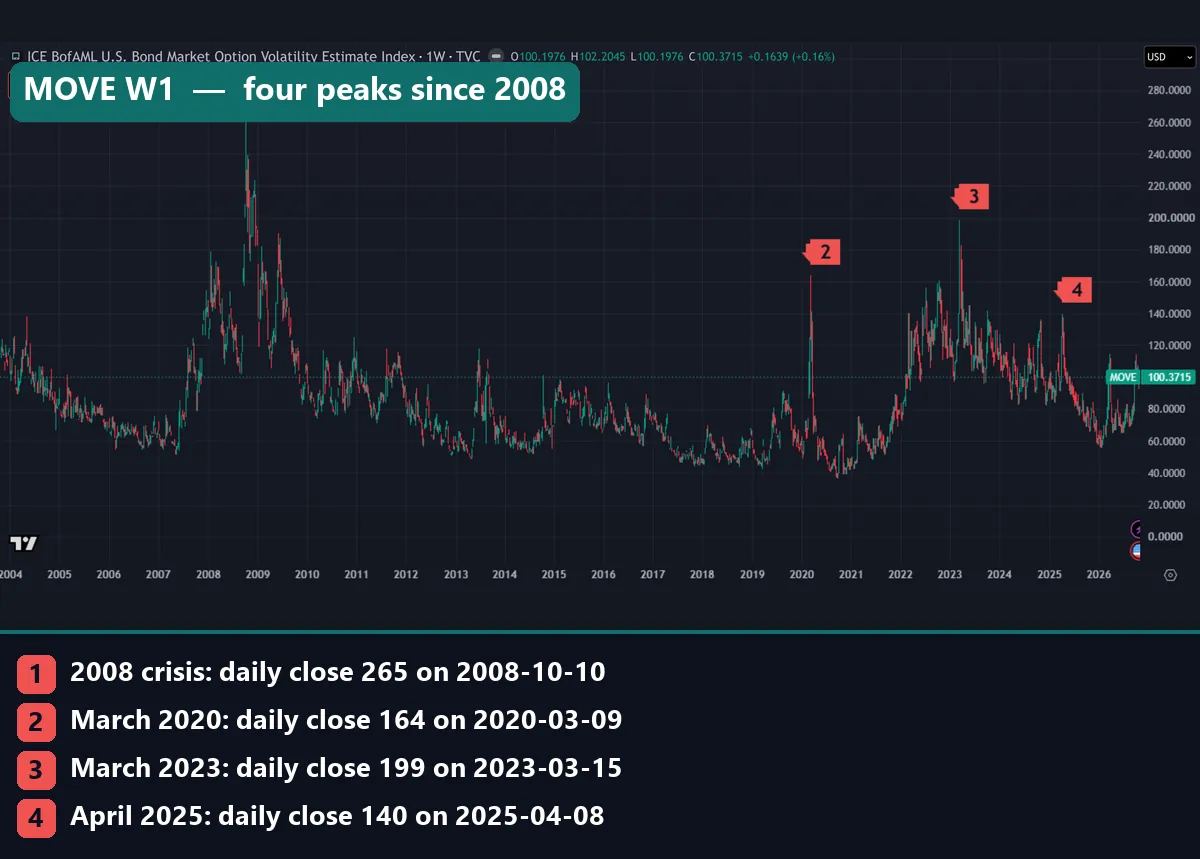
Twenty-four years of MOVE closes
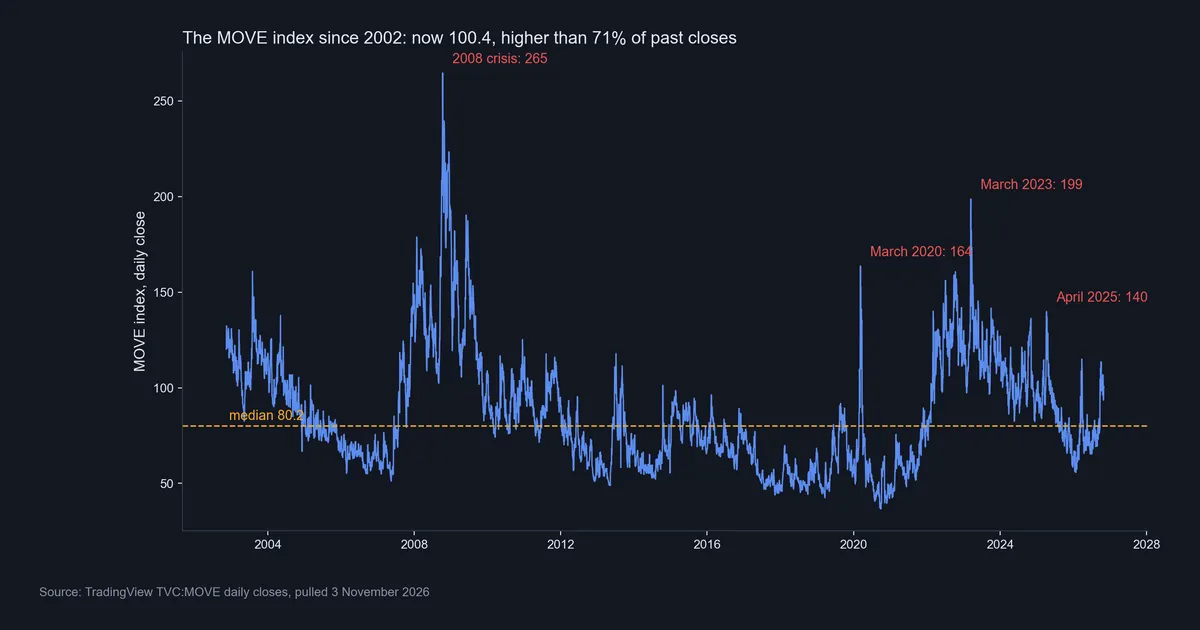
The highest close, 264.6, came on 10 October 2008. Three other peaks stand out: 163.7 on 9 March 2020, 198.7 on 15 March 2023 and 139.9 on 8 April 2025. The lowest close, 36.6, came on 29 September 2020.
We measured these levels, not their causes. One date does have a clear public record. On 12 March 2023, the Federal Reserve’s joint statement with the Treasury and the FDIC addressed Silicon Valley Bank and Signature Bank, three days before the 198.7 close.
The line spent most of 2012 to 2021 below its median and most of 2022 to 2025 above it. So the same reading can look high in one era and ordinary in another.
Download the complete indicator database
Put these concepts on your charts. One email unlocks the full library of 1,380+ indicators with compiled MT4 and MT5 files, plus my TradingView scripts. No paywall, no spam, unsubscribe any time.
Get free access to my indicator database
One email unlocks 1,380+ free MT4, MT5 and TradingView indicators — the complete library. No single-tool download; you get the whole database.
Where it fails
The MOVE index has real limits.
- No direction. Our test measured size only. Bassman agreed in the ICE interview that the index is not, in general, a leading indicator of direction. He added that it gives no skew, the price gap between options on each side.
- A short window. It covers one month and says nothing about the rate path after that.
- US Treasuries only. We tested USD/JPY alone, so do not carry our range figures over to other pairs.
- Medians hide overlap. Quiet days still sit in the top group, and busy days sit in the lower ones.
- Implied is not realized. Bassman says implied volatility usually sits above realized volatility in most liquid assets.
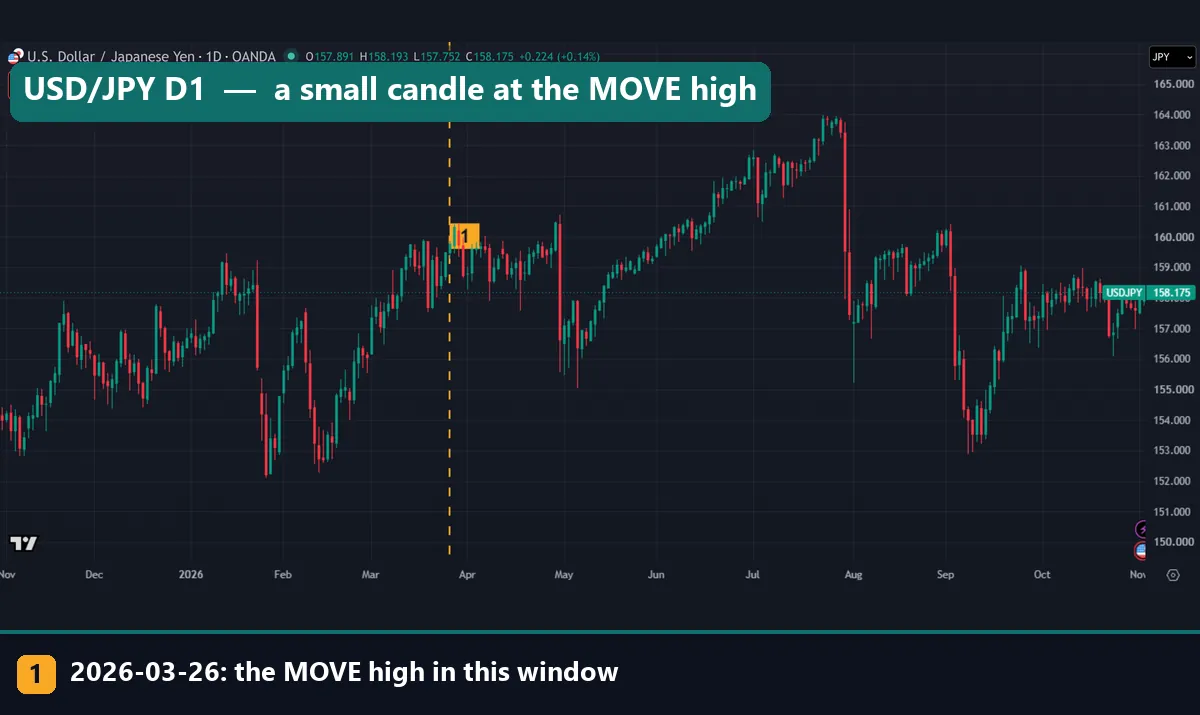
The yen chart below shows that overlap. The day of the highest MOVE close printed a small USD/JPY candle. Meanwhile, the tallest candles fall around late January, late April, late July and early September, when the index sat between about 56 and 80 on our MOVE chart. We measured those ranges, not their cause, but a high MOVE did not flag them. Currency moves can start elsewhere, as our page on carry trade unwinds explains.
MOVE index vs VIX: related, not the same
The two gauges share a structure but price different markets. Cboe’s VIX methodology document says the VIX measures the market’s expectation of 30-day volatility in US stocks, through S&P 500 option prices. It uses puts and calls across a wide range of strikes.
| Feature | MOVE | VIX |
|---|---|---|
| Market | US Treasury yields | US stocks, through the S&P 500 |
| Options used | Over the counter, at the money | S&P 500 puts and calls, wide range of strikes |
| Horizon | One month | 30 days |
Over 5,836 days, daily changes in the two correlated at just 0.28. Since 2023 the figure rose to 0.42, over 956 days. So they lean the same way, but neither one stands in for the other.
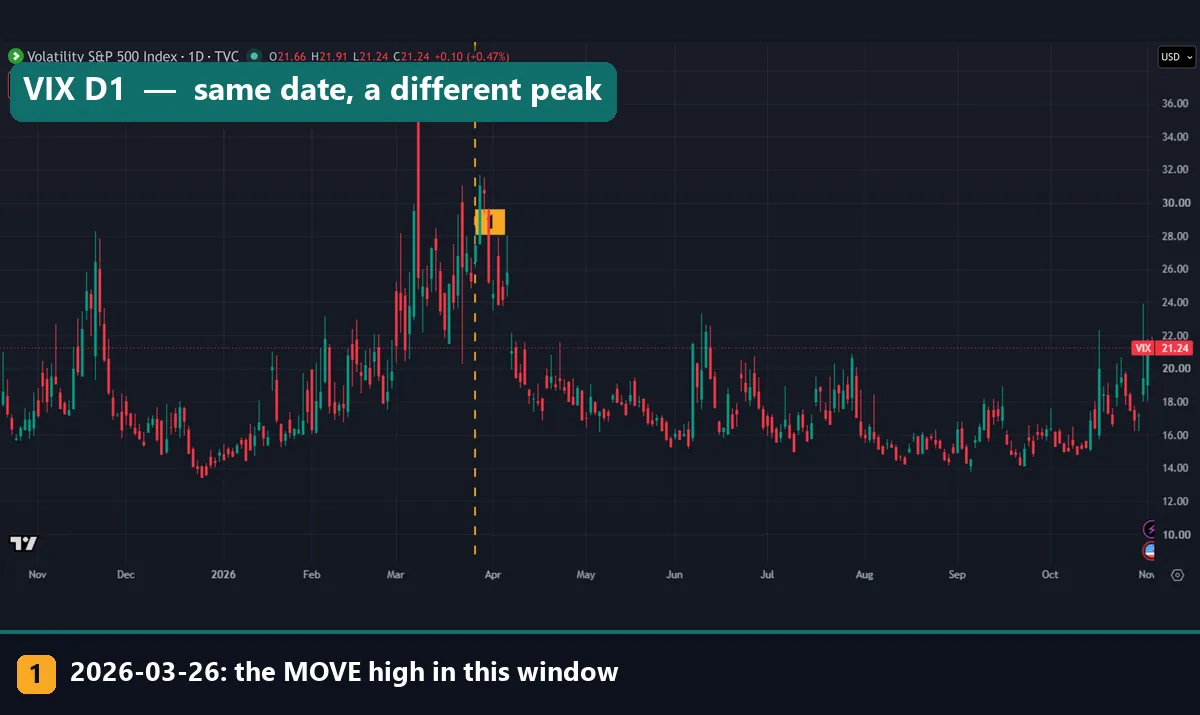
Our VIX chart carries the same 26 March mark. Its tallest bar, near 35, printed in early March, more than two weeks before the MOVE high. Late September to early October shows a sharper split: the MOVE ran above 100 on most days, yet the VIX stayed near 15 to 16. So a trader watching only the VIX saw calm stocks and missed the jump in bond volatility. For the stock side, see how to chart the VIX on TradingView and what the VIX means for forex.
Common MOVE index mistakes
Four errors come up with this index.
- Reading it as a bond call. A rising MOVE is not bearish or bullish for Treasuries. In October 2026 it held near 100 while yields fell.
- Using a fixed alarm level. “Above 100 means crisis” fails on history. A close of 100.4 beats only 70.9% of past closes, and the 90th percentile is 125.8.
- Swapping it for the VIX. A correlation of 0.28, or 0.42 since 2023, is too low for that.
- Treating MOVE / 16 as tomorrow’s forecast. It gives a rough daily scale over a month, with no target for any single day.
Where to go next
The MOVE is one input, so pair it with these pages.
- How central bank rate decisions work: the days that reset rate expectations.
- What risk-on and risk-off mean: how traders group assets by fear.
- Market sentiment indicators: where a volatility gauge fits among other readings.
For primary sources, use the ICE, Federal Reserve and Cboe links above.
FAQ: the MOVE index
What does MOVE stand for?
It began as the Merrill Lynch Option Volatility Estimate. ICE bought it in 2019 and renamed it the ICE BofAML U.S. Bond Market Option Volatility Estimate Index.
What is a normal MOVE index level?
The median close since November 2002 is 80.2. Eight in ten closes fall between 54.1 and 125.8, the 10th and 90th percentiles.
Is a MOVE of 100 high?
It is raised, but not extreme. The 2 November 2026 close of 100.4 beats 70.9% of past closes. By Bassman’s shortcut it implies about six basis points a day.
Does a rising MOVE mean yields will go up?
No. The index prices the size of yield moves, not a side. In October 2026 it held near 100 while the 10-year yield fell from about 5.3% to about 4.9%.
How is the MOVE different from the VIX?
The MOVE prices Treasury yield swings, and the VIX prices S&P 500 swings. Their daily changes correlate at 0.28 overall and 0.42 since 2023.
Why do forex traders watch the MOVE?
Yields shape rate gaps, and those gaps matter for dollar pairs. In our test, the median USD/JPY range rose from 0.55% in the lowest MOVE group to 0.91% in the highest. That helps with stop distance, not direction.
Can I trade the MOVE index?
ICE publishes it as an index, and its release describes no contract on it. We have not tested any product tied to it, and we use it only as a reading.
Is the MOVE index a reliable trading signal?
No. High readings went with bigger next-day ranges, in medians, over 2,891 days. That covers size only, and we ran no trades. Use it as context for risk, and remember that results are not guaranteed; past performance is not indicative of future results.
Last updated: 3 November 2026.

About the author
Written by Dominic Walsh, a Forex trader and MT4/MT5 indicator, Expert Advisor and script developer. Every tool on forexmt4systems.com is tested on live charts before release and ships with ready-to-use compiled MT4 (.ex4) and MT5 (.ex5) files. Learn more about the trader and developer behind this site.
How we build, test and correct every tool: Editorial & Testing Policy. Trading carries risk; see the disclaimer.