
Yields are what a bond pays relative to its price, so price and yield move opposite ways. This guide settles what the number means, why it moves against price, what the gap between maturities shows, and how far the link to currencies goes. We checked each on TradingView data pulled on 3 November 2026. Daily changes in the US 10-year yield and the 10-year note future correlated at -0.92 over 940 days. With USD/JPY the figure was +0.47 over 968 days. So one link is close to mechanical, and the other is real but far from one-to-one.
What yields actually are
A government sells a bond at auction, and the auction sets its interest rate. That rate then stays fixed on an ordinary Treasury note or bond. The bond keeps trading, though, so its price changes daily. A yield joins those two facts into one figure: the return a buyer gets at today’s price.
TreasuryDirect’s page on Treasury pricing calls yield to maturity “the annual rate of return on the security.” It also gives the rule. A yield above the interest rate means a price below par, the bond’s face value. When the two match, the price equals par. A yield below the interest rate means a price above par.
The word also covers things like a stock’s dividend yield. In market news, though, it usually means government bond yields, and that is our meaning here. It is not a central bank rate: our guide to central bank rate decisions covers the rate that policy makers set.
How yields work: the formula
Current yield is the yearly interest divided by the price:
current yield = annual interest / price
TreasuryDirect prints real auction examples. One 20-year bond carried a 1.750% interest rate and sold at 98.336995. So its current yield was 1.750 / 98.336995, or about 1.78%. Yet the auction yield was 1.850%, because the buyer also collects the climb from 98.34 to 100 at maturity.
Yield to maturity counts that climb. It is the one rate that makes all future payments, brought back to today, equal the price:
price = C/(1+y) + C/(1+y)^2 + ... + (C+F)/(1+y)^n
Here C is each interest payment, F is the face value, n is the number of payments, and y is the yield per period. C and F never change after the auction. So price and y must move opposite ways, because nothing else in the equation can give. Also, a longer bond has more payments to reprice, so the same yield change moves its price further.
What moves a long-term yield
Two forces sit inside a long-term yield. A 2018 San Francisco Fed Economic Letter says “long-term rates reflect both this term premium and expectations of future short-term rates.” The term premium is the extra pay buyers demand for holding long bonds. Your screen does not split the two.
Expected short-term rates follow the central bank’s likely path. That is why traders study the Fed dot plot and each FOMC meeting. Inflation matters too, because a fixed payment buys less when prices rise, as our page on how inflation affects currencies explains. We did not test these causes. So when we quote a date below, we give its size and not a reason.
How we tested these yields
We used the TradingView web chart on D1 and W1 bars and pulled the data on 3 November 2026. The yields are TVC:US02Y, TVC:US10Y, TVC:US30Y, TVC:GB10Y, TVC:DE10Y and TVC:JP10Y. For price we used CBOT:ZN1!, a continuous front-month series of the 10-year note future. For the yen we used OANDA:USDJPY.
A daily change is one close minus the previous close, in basis points (bp). One bp is one hundredth of a percentage point. Both correlations run from January 2023 to 3 November 2026, on days when both series have a bar. The curve is the 10-year close minus the 2-year close since 24 April 2001. An inversion run counts only if it lasted five trading days or more.
Three limits apply. First, we ran no trades, so every figure is prices only, before spread, swap, financing and commission. Second, ZN1! can step at a contract roll, and we did not remove those steps. Third, we did not compare TVC closes with the Treasury’s daily table. Our editorial testing policy explains how we run tests.
Yield parameters: what sets the number
You do not tune a yield the way you tune an indicator. Still, five inputs decide what you see.
| Parameter | What it is | What sets it |
|---|---|---|
| Interest rate | The fixed yearly payment | The auction |
| Price | What the bond costs today | The market, every trading day |
| Maturity | Time left until the face value comes back | The issue date and the calendar |
| Issuer and currency | Who pays, and in what money | US, UK, Germany and Japan on our charts |
| Quote source and time | Where and when the close comes from | The data provider |
That last row matters. The US Treasury’s interest rate statistics page bases its par yield curve on “closing market bid prices on the most recently auctioned Treasury securities,” quoted at about 3:30 PM each business day. The Federal Reserve’s H.15 release then lists values at fixed maturities, including 2, 10 and 30 years. So a “10-year yield” exists “even if no outstanding security has exactly 10 years remaining to maturity.” TVC is a separate feed, so its close can differ from those tables.
Reading yields on a chart
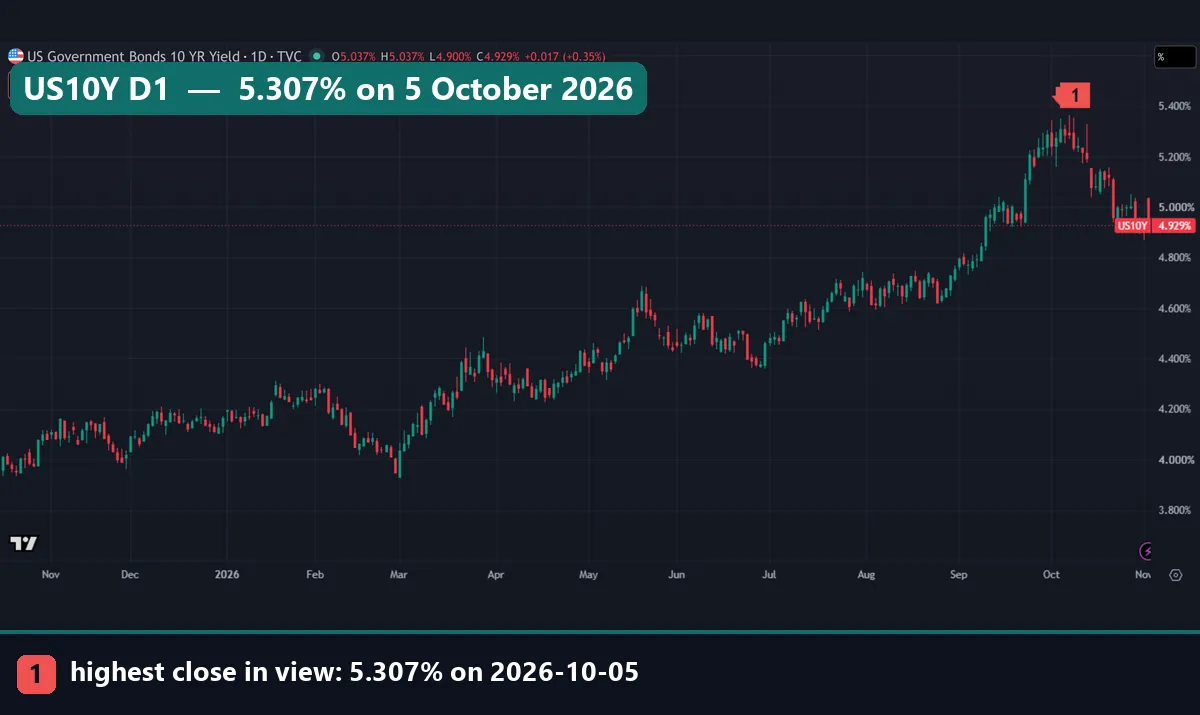
A yield chart reads like any price chart, with one trap: up means the bond’s price went down. Our first chart shows a 2026 low close of 3.95% and a high close of 5.307% on 5 October, a climb of about 136 bp. Ignore the O/H/L/C row and the SELL and BUY boxes on our captures. They show the live quote on capture day, not the bars in view.
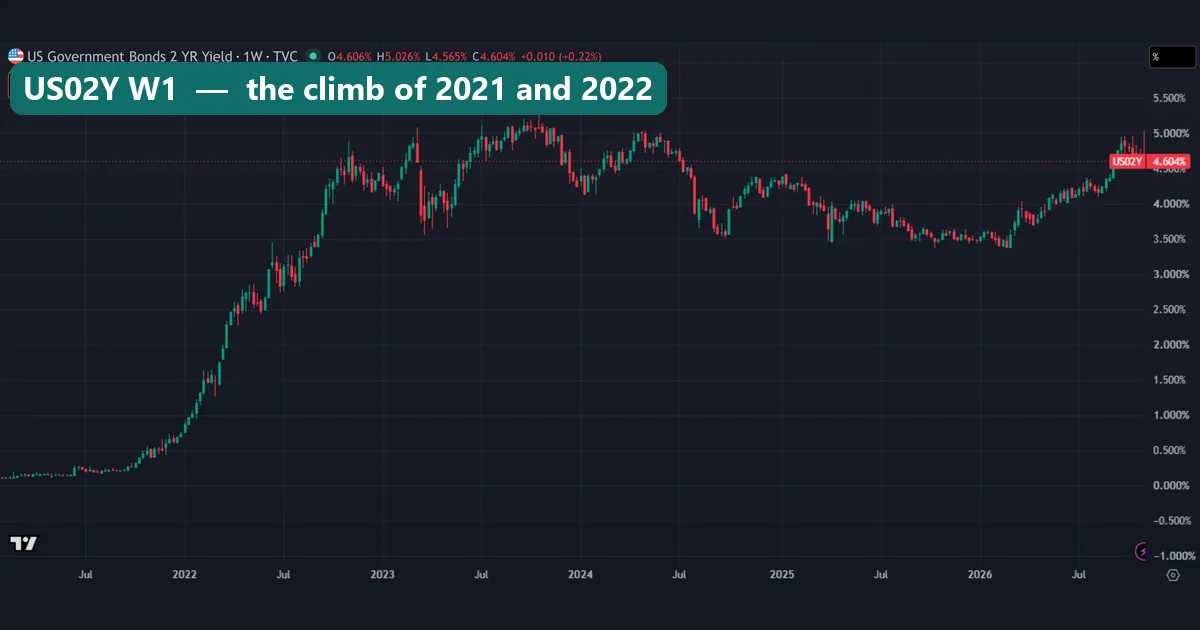
The US 2-year sat near 0.2% in mid-2021 and reached about 4.7% by late 2022, the fastest stretch on this chart. Since then it has ranged from about 3.4% to about 5.2%.
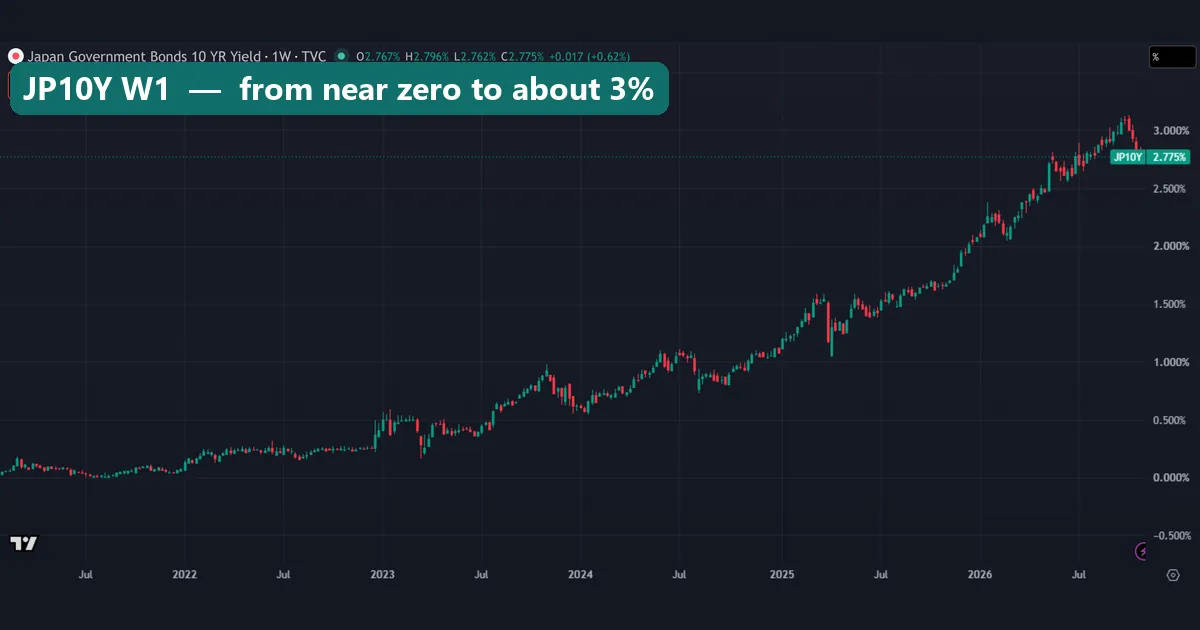
Japan’s 10-year tells a different story. It sat near zero in 2021, held close to 0.25% through most of 2022, then climbed past 3% in autumn 2026. The latest reading of 2.775% looks low next to the US, yet it is about eleven times the 2022 level. So judge a yield against its own history first.
Worked example: the 3 November 2026 readings
Here are the latest values, with the first bar we have for each symbol. The 3 November bars were still open, so the 4.929% tag on our first chart differs from the 4.908% below.
| Yield | Latest | First bar we have |
|---|---|---|
| US 2-year | 4.614% | 24 April 2001 |
| US 10-year | 4.908% | 15 September 2000 |
| US 30-year | 5.305% | 6 September 2000 |
| UK 10-year | 5.267% | 20 September 2002 |
| Germany 10-year | 3.335% | 27 November 2002 |
| Japan 10-year | 2.775% | 8 February 2006 |
- Find the curve. 4.908 minus 4.614 is +29.4 bp. A positive figure means the 10-year pays more than the 2-year.
- Place it in history. The deepest reading was -108.1 bp on 8 March 2023, so the gap has swung 137.5 bp since then.
- Measure the long end. 5.305 minus 4.908 is 39.7 bp of extra yield for 30 years over 10.
- Compare countries. The US 10-year sits 157.3 bp over Germany and 213.3 bp over Japan. Those gaps feed the interest rate differential.
- Size the recent move. From 5.307% on 5 October to 4.908% is a fall of 39.9 bp. The median daily move in 2026 is 3.2 bp, so the fall equals about 12 median days in four weeks.
None of this says where yields go next.
The yield curve since 2001
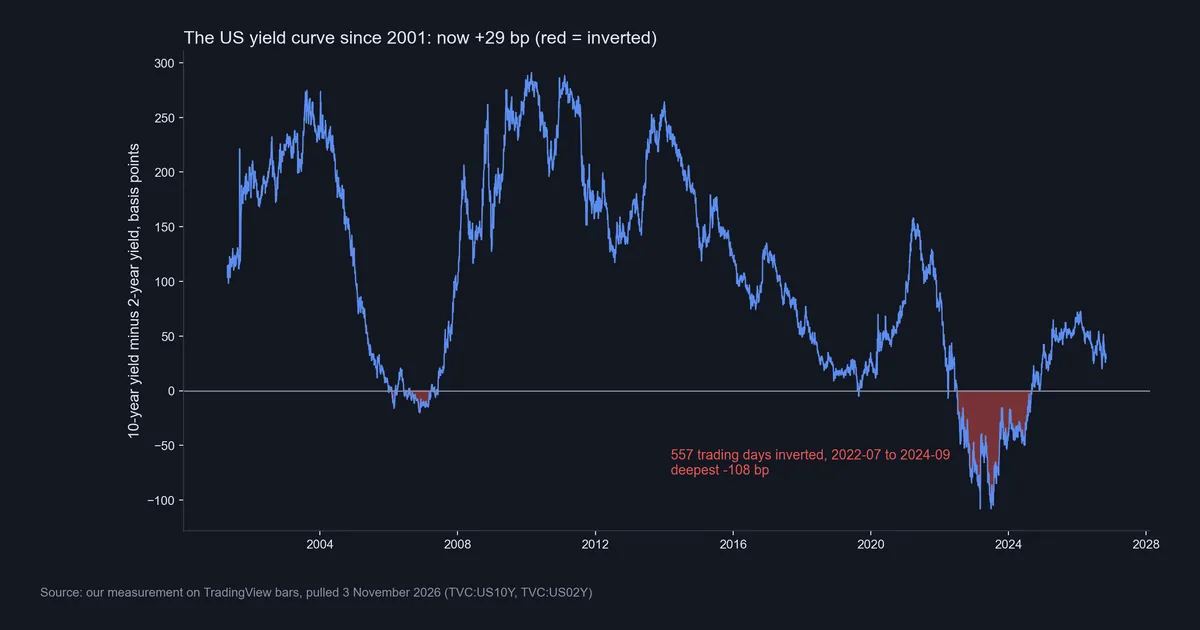
A yield curve plots yields by maturity. On our chart the 10-year usually sits above the 2-year. When it drops below, the curve has inverted, and the chart shades that stretch red. One sharp step in 2001, near the start of the line, may be a feed quirk, and we did not check it.
The longest run lasted 557 trading days, from 5 July 2022 to 5 September 2024, and reached -108.1 bp. The longest earlier run lasted 118 days, from 15 August 2006 to 21 March 2007, with a low of -20.0 bp.
Does inversion predict a recession? Our data cannot answer that. The San Francisco Fed letter, which uses the 10-year minus the 1-year, says a simple rule “has correctly signaled all nine recessions since 1955 and had only one false positive.” It gives a lag of 6 to 24 months and calls the mechanism hard to pinpoint. That letter dates from March 2018, before the 2022 run. Our two long episodes prove nothing, so we make no recession claim. See our guide to the business cycle and economic indicators for the wider picture.
How far the 10-year moves, and the link to currencies
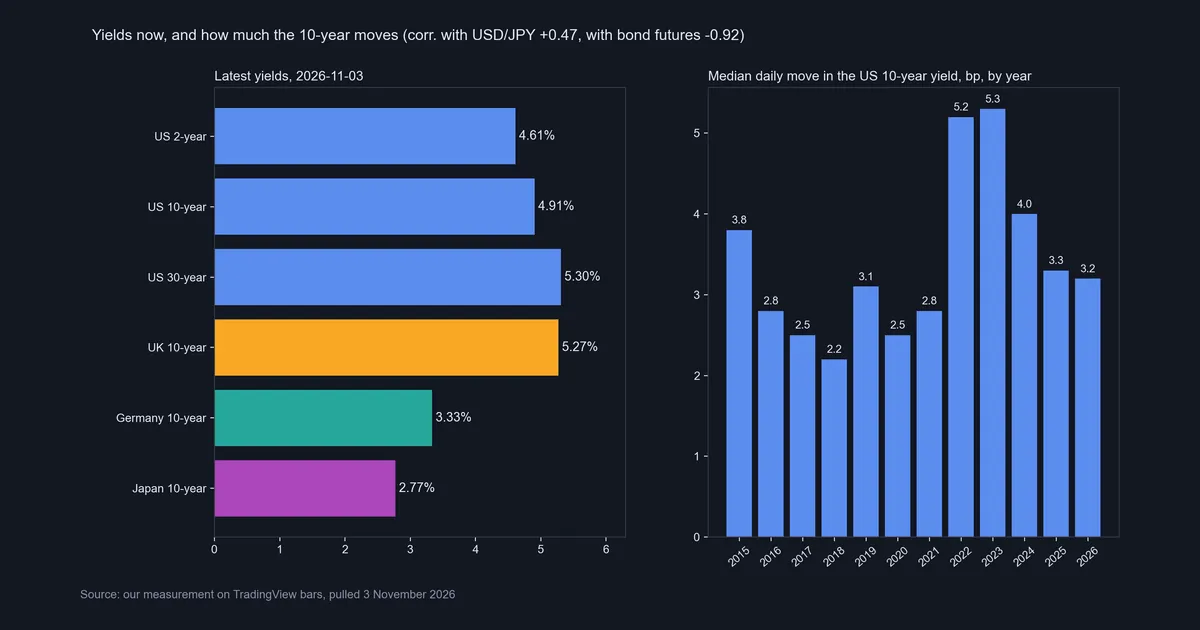
The left panel shows the latest levels, rounding 5.305 and 2.775 down to 5.30 and 2.77. The right panel shows the median daily move in the 10-year: 2.2 bp in 2018, 5.2 in 2022, 5.3 in 2023 and 3.2 so far in 2026. So a typical day in 2023 was more than twice a typical day in 2018.
Single days tell a different story. The biggest since 2018 was +32.9 bp on 17 March 2020, then -28.8 bp on 10 November 2022. Yet the 2020 median was only 2.5 bp, so one wild month does not make a busy year. For the option market’s view of these swings, read our guide to the MOVE index.
Days when the 10-year rose tended to be days when USD/JPY rose, at +0.47. Squared, that is about 0.22, so the yield lines up with roughly a fifth of USD/JPY’s daily variation. We tested only this pair. Our older page on how bond yields reach currencies covers the mechanism, so we do not repeat it.
Download the complete indicator database
Put these concepts on your charts. One email unlocks the full library of 1,380+ indicators with compiled MT4 and MT5 files, plus my TradingView scripts. No paywall, no spam, unsubscribe any time.
Get free access to my indicator database
One email unlocks 1,380+ free MT4, MT5 and TradingView indicators — the complete library. No single-tool download; you get the whole database.
Where it fails: what a yield will not tell you
- It is not a forecast. A yield describes today’s price. Nothing in the 5.307% close on 5 October said a 39.9 bp fall came next.
- It assumes you hold to maturity. Sell early, and you get that day’s market price instead.
- It ignores inflation. The headline series is nominal, and H.15 lists inflation-indexed yields apart. So 4.908% is not a return after price rises.
- Gaps between countries cross currencies. The UK 10-year sits 193.2 bp over Germany’s, but the exchange rate can erase that gap.
- Inversion is no clock. Runs of 118 and 557 days give no timing rule.
- Correlations depend on the window. Ours start in 2023. Another window can give another figure, and we did not test one.
The other side of the chart: the note future and the 30-year
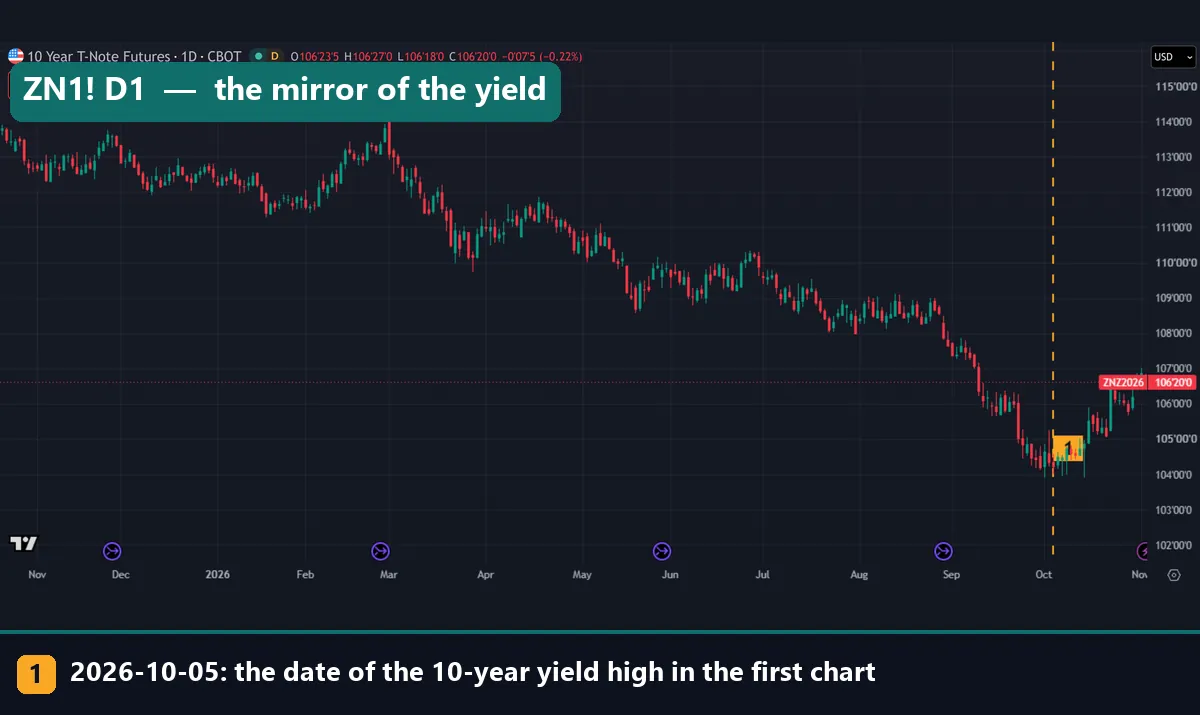
This chart carries the same date line as our first chart, and it is close to a mirror image. Its price falls for most of the window while the yield climbs. It sits near its lows at the dashed line, then both turn. From that line to the right edge, the future rises from near 104.2 to near 106.6, or about 2.3%. Over the same stretch the yield fell 39.9 bp, which gives roughly 0.06% of price per bp. Treat that as one reading from one chart, because a future has its own contract rules.
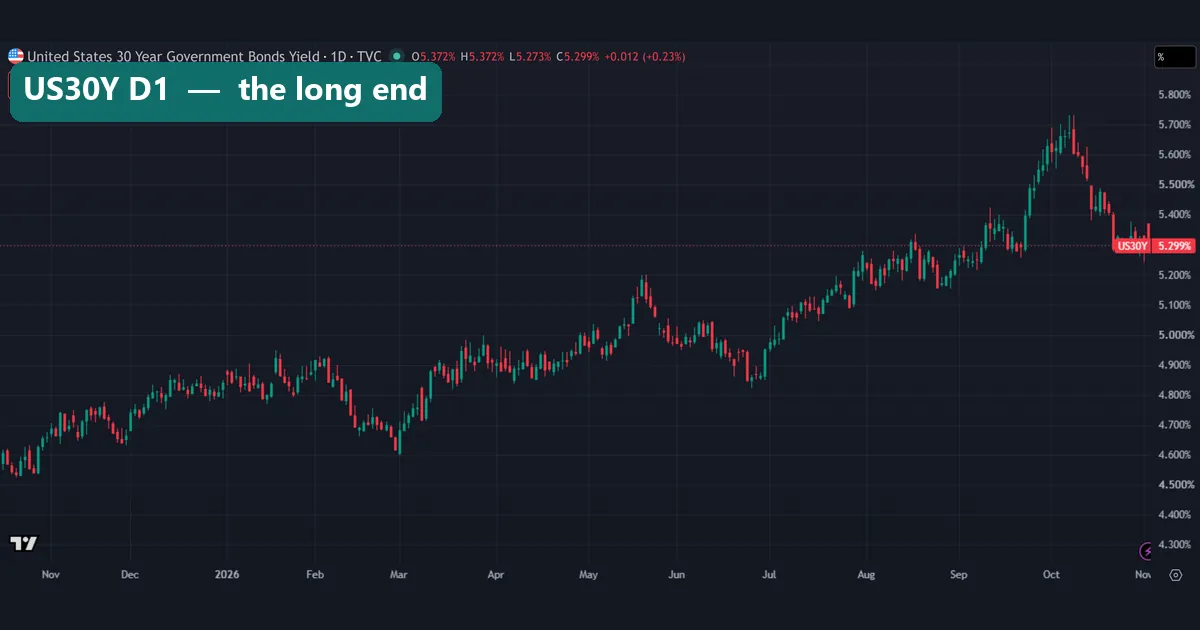
The 30-year has the same shape at a higher level. It also peaked in early October, with a wick near 5.7%. In November 2025 it sat near 4.7%, while the 10-year sat near 4.1%, a gap of about 60 bp. Now the gap is 39.7 bp. So the 10-year rose more over this window.
Common mistakes with yields
- Reading up as good news for the bond. A rising yield means a falling price for anyone who already holds it.
- Mixing up percent and basis points. On capture day, the header on our first chart read +0.017 (+0.35%). That is 1.7 bp. The 0.35% is a change in the yield figure itself, not in the bond’s price.
- Treating the 10-year as the Fed’s rate. The Fed sets a short-term policy rate, while the market prices the 10-year. Our page on how interest rates affect currencies keeps the two apart.
- Expecting a fixed link to a currency. A correlation of +0.47 is an average over 968 days, not a rule for tomorrow. Our guide to currency correlation shows how to read one.
Where to go next
- Our interest rate tracker: central bank rates to set beside these yields.
- What a carry trade means: how traders treat a gap between rates.
- How to use a TradingView chart: open the same symbols yourself.
For primary sources, use the TreasuryDirect, US Treasury, Federal Reserve and San Francisco Fed links above.
FAQ: yields
What are yields in simple terms?
A yield is the return a bond buyer gets at today’s price. Price and yield move opposite ways, so a cheaper bond has a higher yield.
Why do bond prices fall when yields rise?
The payments stay fixed after the auction. So a bond can only offer a new buyer more return by costing less.
What is a basis point?
It is one hundredth of a percentage point. A move from 5.307% to 4.908% is 39.9 basis points.
What was the US 10-year yield on 3 November 2026?
Our pull read 4.908%, with the 2-year at 4.614% and the 30-year at 5.305%. These change through the day, so check a live chart.
What does an inverted yield curve mean?
It means a shorter maturity yields more than a longer one. On our 10-year minus 2-year measure, the longest run lasted 557 trading days. Two long episodes prove nothing about recessions.
Do higher yields push USD/JPY up?
They lean that way, but loosely. Daily changes correlated at +0.47 since 2023, over 968 days. That does not show which one led, and we tested no other pair.
Is a yield the same as an interest rate?
No. The auction sets the interest rate, and that payment stays fixed. The yield changes with the price.
Can yields work as a trading signal?
Not on their own. We measured links and sizes, ran no trades, and found no rule for timing a turn. Use them as context for rates and risk, and remember that results are not guaranteed; past performance is not indicative of future results.
Last updated: 3 November 2026.

About the author
Written by Dominic Walsh, a Forex trader and MT4/MT5 indicator, Expert Advisor and script developer. Every tool on forexmt4systems.com is tested on live charts before release and ships with ready-to-use compiled MT4 (.ex4) and MT5 (.ex5) files. Learn more about the trader and developer behind this site.
How we build, test and correct every tool: Editorial & Testing Policy. Trading carries risk; see the disclaimer.