
A dragonfly doji is a single candle with almost no body, almost no upper wick and a long lower wick. Textbooks read it as sellers pushing price down and buyers pushing it back. This guide settles what the candle is, how to spot it with a fixed rule, and what followed it on 23 FX pairs, with data as far back as June 2018. The short answer: we found only 63 cases. They closed higher the next day more often than an ordinary day did, but that lean had gone by day 10. So treat the candle as a small clue, not a signal.
What a dragonfly doji actually is
The name comes from the shape, a letter T. The open and close sit at or near the top of the candle, and a long wick hangs below them. The pattern dictionary at StockCharts ChartSchool defines it as a doji where the open and close are at the high of the day. Our guide to what a doji candle means covers the wider family.
A strict doji has an identical open and close, which is rare on FX quotes with many decimals. None of the five candles on our charts has one. So every working rule must allow a small body.
Two relatives cause most of the confusion. First, a hammer candlestick has a similar long lower wick but a visible body. Second, a gravestone candlestick is the same shape upside down, with the wick on top. We test that one below.
Also, a candle records only four prices for one session. It does not say who traded or why, so “sellers” and “buyers” are a story we attach to the shape.
How the candle forms, and how we defined it
Price opens, falls well below the open during the session, then climbs back before the close. The net change is close to zero, and the wick is the only trace of the fall. Our note on candlestick wicks covers how to read that trace.
The dragonfly doji entry at Investopedia gives the usual reading: buyers absorbed the selling. It also says the candle can warn of a move either way, depending on what came before, and that traders tend to wait for the next candle. A rule needs numbers, though, so here is ours:
range      = high - low
body       = |close - open|
upper wick = high - max(open, close)
lower wick = min(open, close) - low

dragonfly if  body       <= 0.10 x range
         and  upper wick <= 0.10 x range
         and  lower wick >= 0.60 x range
         and  range      >= 0.50 x ATR(14)
The last line drops tiny candles from dead sessions. ATR here is a plain 14-day average of true range, taken from the day before the candle. TradingView’s Average True Range page gives the definition, and our ATR explainer shows how traders use it. Also, the 60% line never bites: a body and upper wick of 10% each already force a lower wick of at least 80%.
Others draw the line elsewhere. For example, TA-Lib’s dragonfly doji function on GitHub compares the body and wicks with an average of recent candle ranges, and it only asks that the lower wick not be very short. That accepts far shorter wicks than ours, so its counts will differ. Even our earlier gravestone guide, with a 0.3 ATR floor, counted 169 gravestones. This rule counts 156.
How we tested it
We read the history files of a Capital Point Trading terminal, MetaTrader 4, build 1471. The set is daily candles on 23 FX pairs. Dates vary by pair: the widest window runs from 12 June 2018 to 24 August 2026. That terminal has been offline since late August 2026, so no window runs later.
The pairs are AUD/CAD, AUD/CHF, AUD/JPY, AUD/NZD, AUD/USD, CAD/CHF, CAD/JPY, CHF/JPY, EUR/AUD, EUR/GBP, EUR/USD, GBP/AUD, GBP/CAD, GBP/CHF, GBP/JPY, GBP/NZD, GBP/USD, NZD/CAD, NZD/CHF, NZD/JPY, USD/CAD, USD/CHF and USD/JPY. Gold and EUR/JPY are not among them.
For each candle we asked two things. Was the close higher 1, 5 and 10 days later than the candle’s own close? And did any close fall below the candle’s low within 10 days? A day here means one daily bar. Then we ran the first question on every daily bar, which gives the base rate.
We applied no stops or targets. Every result comes before spread, swap, financing and commission. So this is a direction count, not a trading system. The chart examples come from the TradingView web chart with OANDA data, captured on 3 November 2026. We ran the same rule on those OANDA bars, and all five candles pass it. Our method is in the editorial testing policy.
The settings we used
Each value below changes which candles count. So if you build a scanner, write yours down before you look at results.
| Parameter | Our value | What it does |
|---|---|---|
| Maximum body | 10% of the range | Keeps only doji bodies |
| Maximum upper wick | 10% of the range | Puts the open and close near the high |
| Minimum lower wick | 60% of the range | Asks for the long tail |
| Minimum range | 0.5 x ATR(14), from the day before | Drops tiny candles |
| After a fall | Previous close below the 20-day average and below the close 5 days before it | Tags the context |
| After a rise | The mirror image of a fall | Tags the context |
| Confirmed | Next close above the candle’s high | Tags the follow-through |
| Floor test | No close below the candle’s low for 10 days | Tests the wick as support |
| Horizons | 1, 5 and 10 daily bars | Next day, one week, two weeks |
The rule is rare by design. It gave 63 cases across 23 pairs in about eight years. That is roughly one every three years on any single pair.
Reading a dragonfly doji on a chart
Check three things in order: the shape, the size against nearby candles, and what came before.
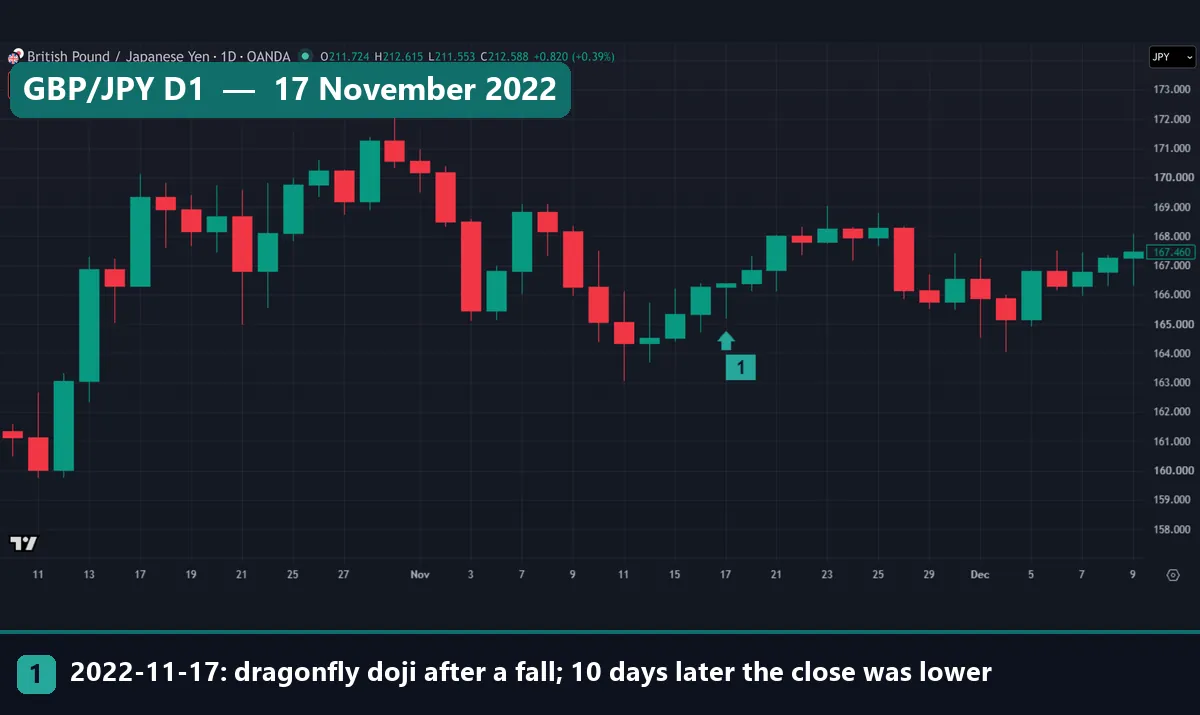
GBP/JPY on 17 November 2022 is a clean shape, yet it looks small next to its neighbours. Its range of 1.192 is only 0.52 ATR, just over our floor. The next close, 166.832, rose above the candle’s high of 166.388. No close fell below the low of 165.196 for ten days. Even so, the close on day 10 was 165.866, below the candle’s 166.380. So a floor that holds and a higher close are two separate results.
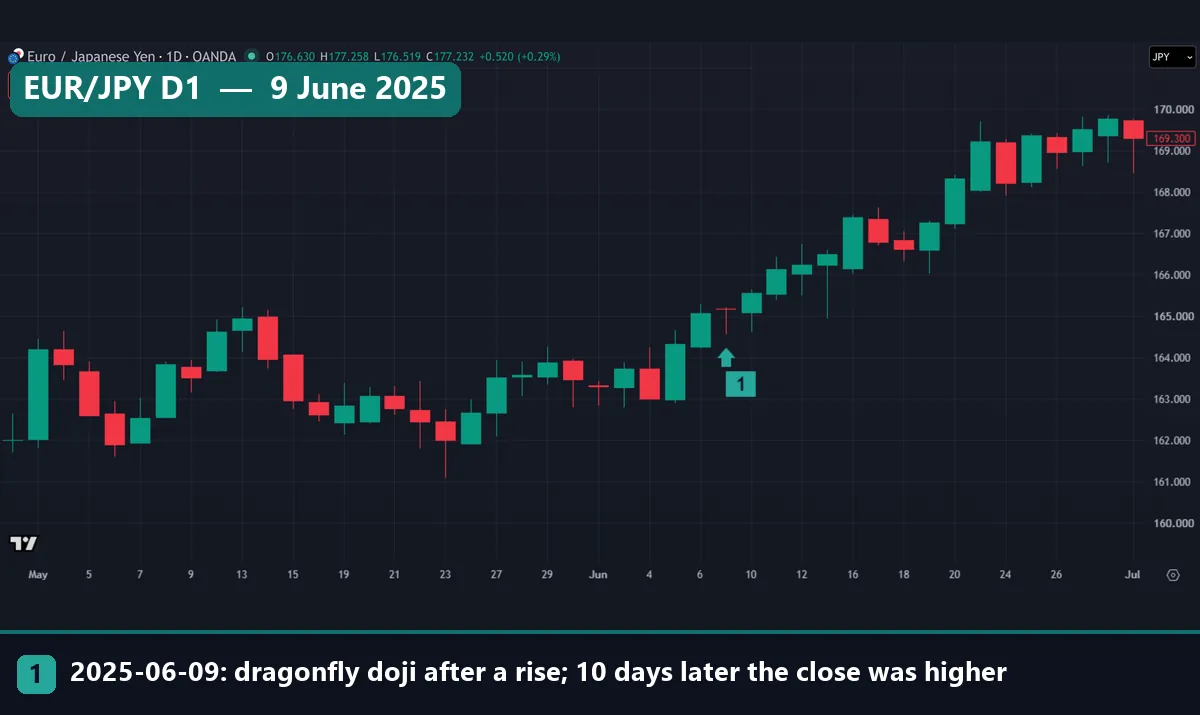
EUR/JPY on 9 June 2025 shows the same shape after a rise. This candle closed just under its open, at 165.155 against 165.172, and our rule ignores colour. The lore would call this a warning after an advance. Instead the pair kept climbing and closed at 169.226 ten days later. That is one chart, not proof.
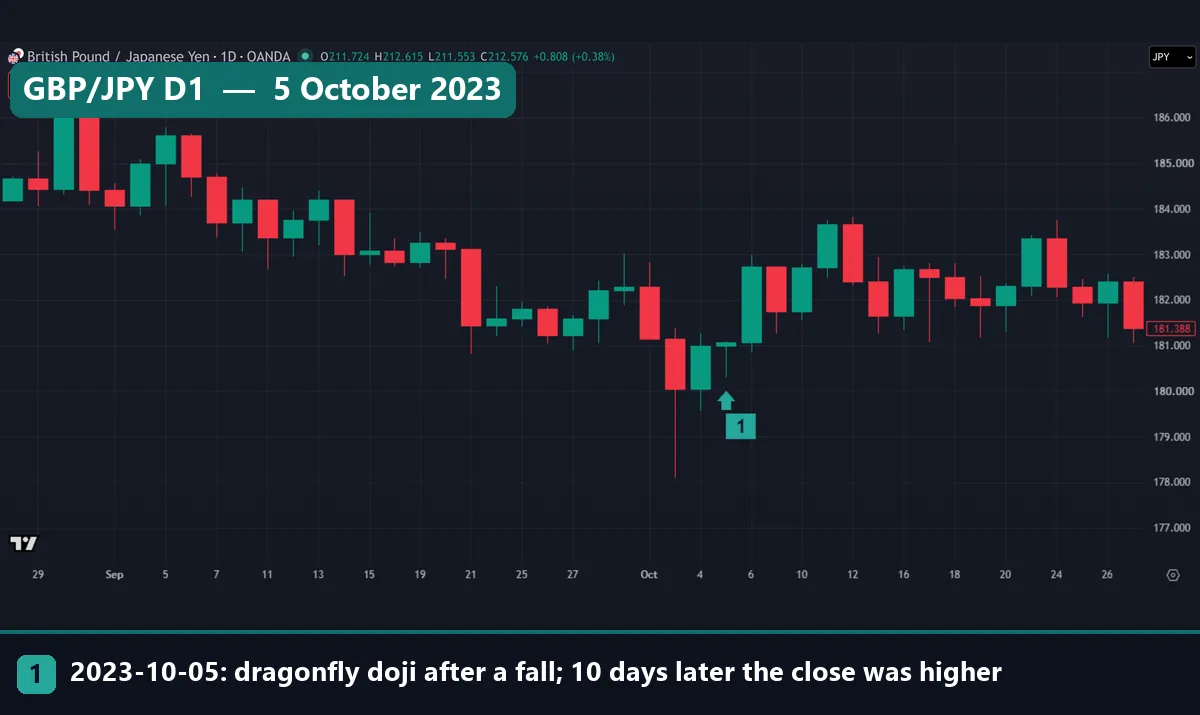
Worked example: GBP/JPY on 5 October 2023
Take the candle in the first chart. OANDA’s daily bar reads open 180.996, high 181.082, low 180.296 and close 181.066.
- Range: 181.082 – 180.296 = 0.786, which is 78.6 pips.
- Body: 181.066 – 180.996 = 0.070, or 8.9% of the range. That is inside the 10% limit.
- Upper wick: 181.082 – 181.066 = 0.016, or 2.0% of the range.
- Lower wick: 180.996 – 180.296 = 0.700, or 89.1% of the range.
- Size: ATR from the day before was 1.297, so the range is 0.61 ATR. That clears the 0.5 floor.
- Context: the previous close of 180.996 sat below its 20-day average of 182.443 and below 181.597, the close five days earlier. So this counts as after a fall.
The next day closed at 182.730, above the candle’s high, so the candle also counts as confirmed. Day 5 closed at 182.400 and day 10 at 181.887. No close went below 180.296 in that time. However, the gain from the candle’s close shrank from 1.664 on day 1 to 1.334 on day 5, then 0.821 on day 10. That last figure is 0.63 ATR, before costs. It is one case, so it shows only the arithmetic.
What came next across all 63 cases
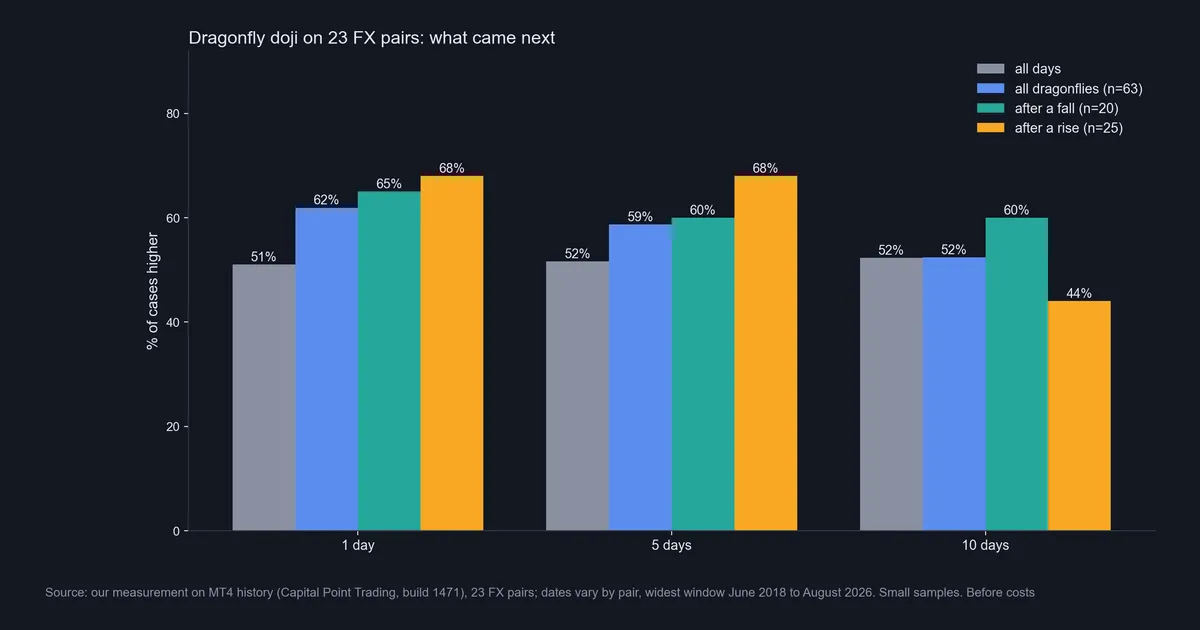
| Group | Cases | Higher, 1 day | Higher, 5 days | Higher, 10 days | Median 10-day move (ATR) |
|---|---|---|---|---|---|
| All days | All | 51.0% | 51.6% | 52.3% | n/a |
| All dragonflies | 63 | 61.9% | 58.7% | 52.4% | 0.18 |
| After a fall | 20 | 65.0% | 60.0% | 60.0% | 1.44 |
| After a rise | 25 | 68.0% | 68.0% | 44.0% | -0.11 |
| Confirmed | 36 | 100.0% | 66.7% | 52.8% | 0.35 |
| Gravestones | 156 | 57.1% | 57.1% | 58.3% | 0.29 |
The next day is where the candle stands out: 61.9% against 51.0% for any day. By day 5 the gap is 58.7% against 51.6%. By day 10 it has gone, at 52.4% against 52.3%. The other 18 dragonflies fit neither tag.
The reversal story is weaker than textbooks suggest. On days 1 and 5, candles after a fall did no better than candles after a rise. Day 10 is different: 60.0% against 44.0%, with median moves of 1.44 ATR and -0.11 ATR. That is the one place the story gets support. But it rests on 12 of 20 cases against 11 of 25.
So small samples deserve real caution here. At 20 cases, one candle moves the figure by 5 points. A rough 95% band around a 51% base runs about 12 points either way at 63 cases, so 61.9% sits just inside it. Related pairs can also print on the same day, and that shrinks the real sample. Our note on backtest sample size explains why this matters.
The gravestone check, and the wick as a floor
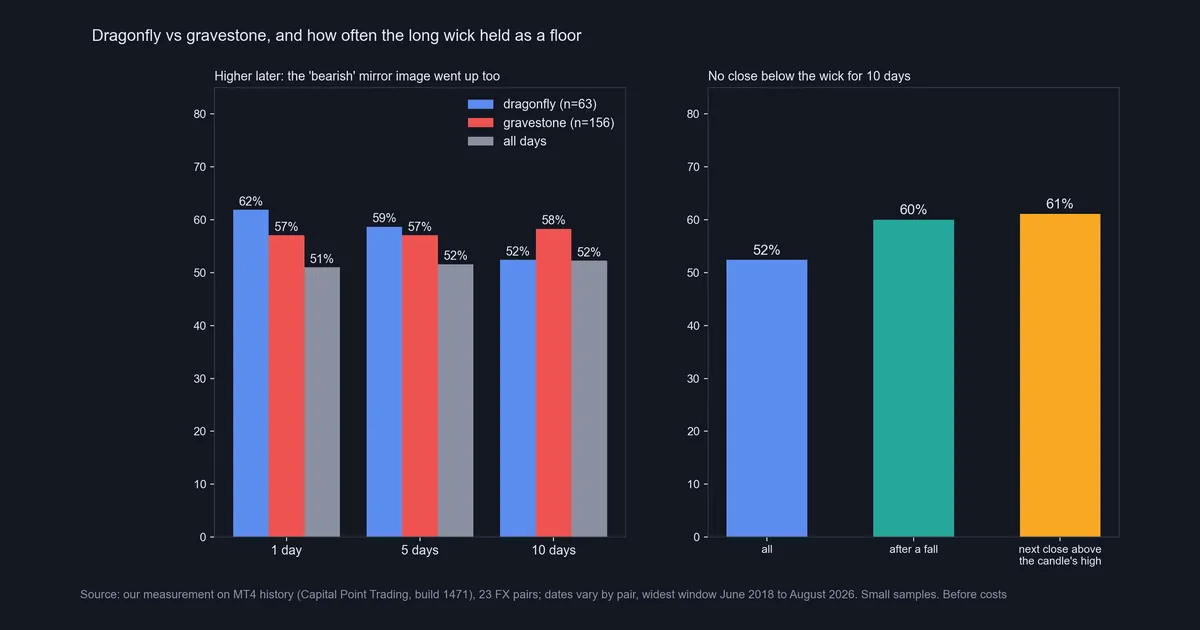
The mirror candle is a good check on candle lore. A gravestone reads as bearish. Yet the 156 gravestones on the same pairs closed higher 57.1%, 57.1% and 58.3% of the time. That beats the all-days figure at all three horizons, and at day 10 it beats the dragonfly too. So two opposite shapes leaned the same way, which is hard to square with either story.
Next, the floor test. No close fell below the wick low within 10 days in 52.4% of all cases. After a fall that rose to 60.0%. With a next close above the candle’s high it reached 61.1%, on 36 cases. We have no all-days baseline for this test. Also, a long wick starts far below the close, so part of this is plain geometry.
Read the confirmed row with care. Its 100% on day 1 comes from the definition, not from the market. Its 66.7% on day 5 has a head start too, because we measure from the candle’s close, not the confirmation close. We also tested only the upward version of confirmation.
Download the complete indicator database
Put these concepts on your charts. One email unlocks the full library of 1,380+ indicators with compiled MT4 and MT5 files, plus my TradingView scripts. No paywall, no spam, unsubscribe any time.
Get free access to my indicator database
One email unlocks 1,380+ free MT4, MT5 and TradingView indicators — the complete library. No single-tool download; you get the whole database.
Where it fails
Here are the real limits.
- Too rare. We found under eight cases a year across all 23 pairs.
- Small median move. The median 10-day move for all cases is 0.18 ATR, before costs. A spread and swap come out of that.
- Feed dependent. Brokers cut the trading day at different hours, so one feed may print a dragonfly where another prints a plain candle. We also ran this rule over the OANDA bars we hold, on fewer pairs. There dragonflies outnumbered gravestones, the reverse of the MT4 count. So do not read much into 63 against 156.
- No known cause. We cannot say why the next-day lean exists. With this few cases, it may be noise.
- Wide risk. A stop under the low must cover the whole wick, and the wick is most of the candle.
- Narrow test. This covers daily bars on FX pairs only. We measured no stocks, indices, gold or lower timeframes here.
Two charts where the story broke
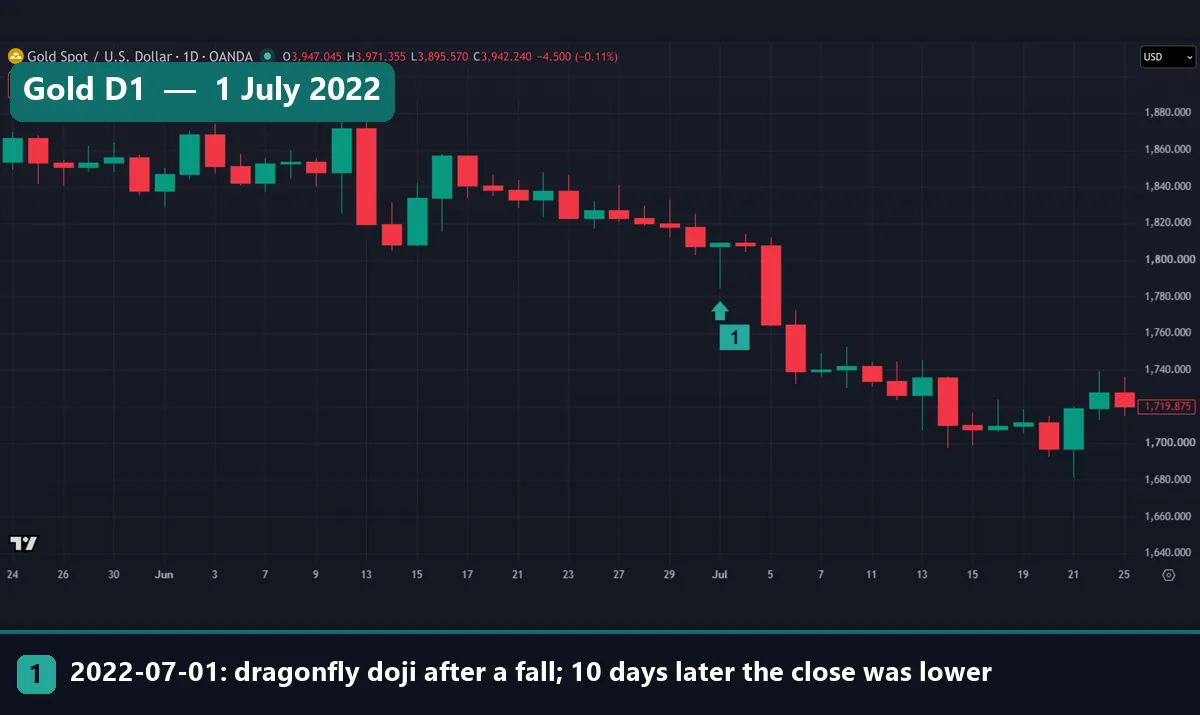
Gold on 1 July 2022 came after a fall and looks almost ideal. Its range of 24.92 equals 1.0 ATR, the widest of our five examples in ATR terms. But the next close slipped to 1,808.04, below the candle’s 1,809.47. Two days later gold closed at 1,764.93, well under the low of 1,784.575. By day 10 it stood at 1,707.46, which is 102.01 below the candle’s close. So the floor broke on the second day. Gold sits outside our 23-pair count, so this is a picture of the shape, not a data point.
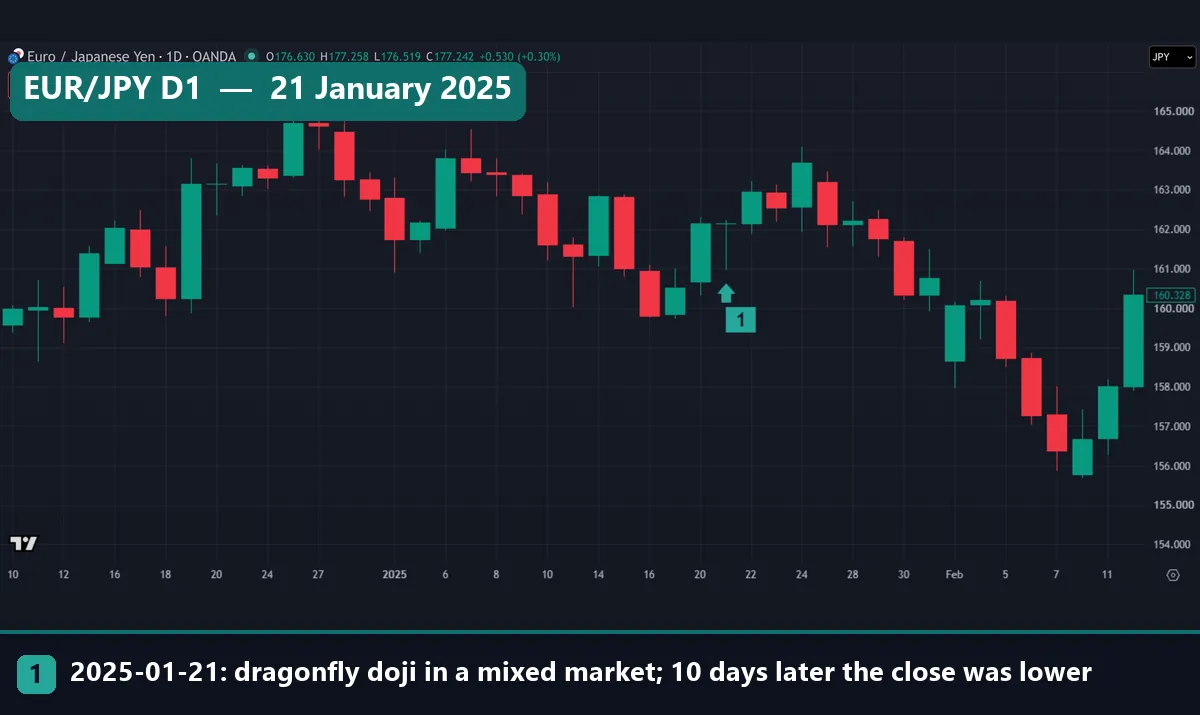
EUR/JPY on 21 January 2025 fits neither tag, so we call it mixed. It did confirm: the next close of 162.945 cleared the high of 162.228. Yet by day 5 the close was 162.226, barely above the candle’s 162.160. Then on 30 January the pair closed at 160.337, under the low of 160.956. Day 10 closed at 160.200. So waiting for confirmation did not save this one. EUR/JPY also sits outside the count.
Common mistakes with the dragonfly doji
- Calling every long wick a dragonfly. A plainly visible body makes it a different candle, so write your rule down first.
- Trading the name. After a rise, our cases went up more often for five days, and the story predicts the opposite.
- Quoting the confirmed group as proof. Its next-day figure is 100% by construction, and anyone acting at that close starts from a higher price.
- Treating the low as a hard floor. It held in 52.4% of cases, so it broke in nearly half. Plan the stop-loss and the position size around that distance first.
If you still want to use it
We do not tell anyone to trade this candle. If it already sits in your process, let it prompt a look at the chart, not an order. Give the idea a time limit, since our figures had lost their lean by day 10. Then log your own cases on your own feed and compare them with a base rate. Our article on whether candlestick patterns work takes up that question. Our note on patterns at support and resistance covers a filter we did not test here.
Where to go next
For the other common shapes and their counts, keep our Japanese candlestick cheat sheet open. For the wider group of candles that close above their open, read the bullish candlestick guide, which runs the same kind of base-rate test.
FAQ: dragonfly doji questions
Is a dragonfly doji bullish or bearish?
On our data it leaned up the next day, at 61.9% against 51.0% for any day. By day 10 that lean had gone, at 52.4% against 52.3%.
How rare is a dragonfly doji?
Our strict rule found 63 on 23 FX pairs in about eight years, or roughly one every three years per pair. A looser rule will find more.
What is the difference between a dragonfly doji and a hammer?
Both have a long lower wick and little or no upper wick. But a hammer has a visible body, while a dragonfly’s body is almost nil. Our rule caps it at 10% of the range.
Should I wait for the next candle to confirm it?
Our 36 confirmed cases were higher on day 5 in 66.7% of cases and on day 10 in 52.8%. Those figures start from the candle’s close, so they carry a head start.
Does the low of a dragonfly doji act as support?
Sometimes. No close fell below it for 10 days in 52.4% of our cases, and in 60.0% after a fall. We have no baseline for this test.
What is the opposite of a dragonfly doji?
The gravestone has the same shape upside down. It reads as bearish, yet our 156 cases closed higher 57.1%, 57.1% and 58.3% of the time after 1, 5 and 10 days.
Does this apply to gold, stocks or lower timeframes?
We cannot say from this test. We counted daily bars on 23 FX pairs only. Gold and EUR/JPY appear on our charts as pictures, not as part of the count.
Can I rely on a dragonfly doji for a trade?
We would not rely on it alone. The samples are very small, the numbers come before costs, and the direction lean fades within ten days. These figures describe the past only, so results are not guaranteed; past performance is not indicative of future results.
Last updated: 3 November 2026.

About the author
Written by Dominic Walsh, a Forex trader and MT4/MT5 indicator, Expert Advisor and script developer. Every tool on forexmt4systems.com is tested on live charts before release and ships with ready-to-use compiled MT4 (.ex4) and MT5 (.ex5) files. Learn more about the trader and developer behind this site.
How we build, test and correct every tool: Editorial & Testing Policy. Trading carries risk; see the disclaimer.