
A gravestone candlestick is a doji whose open and close sit at the low of the bar, with a long upper wick above them. Textbooks call it a bearish reversal signal. So we counted every one on eight years of daily FX data and on fourteen months of 15-minute charts. This guide settles what the candle is, how to spot it with a fixed rule, and what actually happened after it on our data. Short version: on daily FX it closed lower less often than an ordinary bar did.
What a gravestone candlestick is
The shape is simple. Price opens near the low of the session. Then buyers push it up, sometimes a long way. By the close, sellers have pushed it all the way back down. The bar finishes almost where it started, at or near its low.
That leaves a candle with almost no body, almost no lower wick and a tall upper wick. It looks like an upside-down T, which is where the gravestone name comes from. Our doji candle meaning guide covers the whole doji family, so we will not repeat it here. In short, the gravestone is the doji type with all of its range above the body.
The usual story is about rejection. Buyers tried higher prices and failed to hold them. Our page on what candlestick wicks mean explains why a long wick shows where trading happened, but not who wins next. That gap between story and outcome is the point of this article.
How the gravestone doji forms, as a rule
“Small body, long upper wick” is too vague to test. Two traders will mark different bars. So we wrote the shape as three conditions, measured on each closed bar:
- Range filter:
high - low > 0.3 x ATR(14). This drops tiny bars from quiet hours. - Body:
|close - open| <= 0.10 x (high - low). The body is at most 10% of the range. - Lower wick:
min(open, close) - low <= 0.10 x (high - low). The open and close sit at or near the low.
If the body is tiny and the lower wick is tiny, the upper wick must hold at least 80% of the range. That is the gravestone. ATR here is the 14-bar average true range. Our guide to what ATR is in trading walks through the formula, and the iATR function reference in the MQL4 documentation shows how MetaTrader computes it.
We also tagged two contexts. “After an advance” means the close sat above the close five bars earlier. “At a 20-bar high” means the bar’s high reached or beat the highs of the prior 20 bars. Those are the places where textbooks say the candle matters most.
Gravestone vs shooting star and inverted hammer
These three get mixed up all the time. A shooting star has a small real body, not a doji body, and it must appear after a rise. An inverted hammer is the same shape after a fall. Our inverted hammer vs shooting star comparison covers that pair in detail.
The gravestone is stricter about the body. Its open and close are almost equal. However, it has no trend requirement in most definitions. That is why we tested it both with and without the “after an advance” filter.
For reference, our earlier daily test of the shooting star candlestick used the same 23 pairs. It found 1,613 cases, and 47.9% closed lower the next day. So the looser cousin showed no clear edge either.
How we tested the gravestone candlestick
We used two data sets, both read from the history files of a Capital Point Trading terminal, MetaTrader 4, build 1471.
- Daily: 23 FX pairs, from 12 June 2018 to 24 August 2026. That is 37,748 daily candles. Gold was not in this set.
- 15-minute: EURUSD, GBPUSD, USDJPY and XAUUSD, from 2 June 2025 to 26 August 2026.
For each gravestone we checked one thing. Was the close lower 1, 3 and 5 bars later on the daily chart? On M15 we checked 1, 4 and 8 bars later. Then we compared each figure with the same check on every bar, which is the base rate. A pattern only matters if it beats that base rate by a clear margin.
No costs, stops or targets were applied. This is a direction count, not a trading system. The chart examples were drawn on the TradingView web chart with OANDA data, captured on 5 October 2026. Our full method is in the editorial testing policy.
The detection settings we used
Every number in this table changes which bars count. So if you build your own scanner, write yours down before you look at results.
| Parameter | Our value | What it does |
|---|---|---|
| Minimum range | 0.3 x ATR(14) | Ignores tiny bars from dead sessions |
| Maximum body | 10% of range | Keeps only doji bodies |
| Maximum lower wick | 10% of range | Forces the open and close to the low |
| Advance filter | Close above the close 5 bars earlier | Marks a candle after a rise |
| High filter | High at or above the prior 20 highs | Marks a candle at a fresh 20-bar high |
| Horizons (D1) | 1, 3 and 5 bars | Next day, half a week, one week |
| Horizons (M15) | 1, 4 and 8 bars | 15 minutes, 1 hour, 2 hours |
Loosen the body to 20% and you will find far more candles. But many of them will be ordinary spinning tops, not gravestones.
Reading a gravestone candlestick on a chart
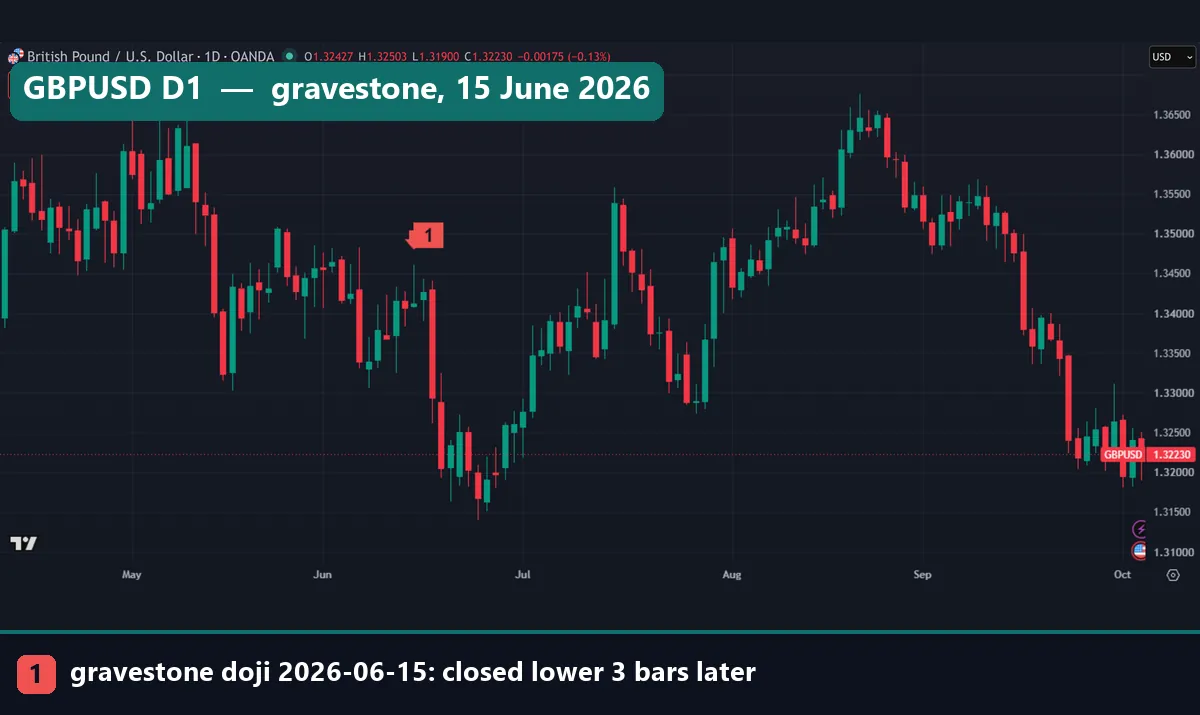
Image 1 above shows GBPUSD on the daily chart. Marker 1 points at 15 June 2026. The bar has a tall wick and a flat body at its foot. Three days later the pair closed lower, and in the next sessions it dropped sharply. That is the textbook result.
Image 2 is the opposite case. It shows EURUSD on M15, with marker 1 at 04:00 UTC on 2 October 2026.
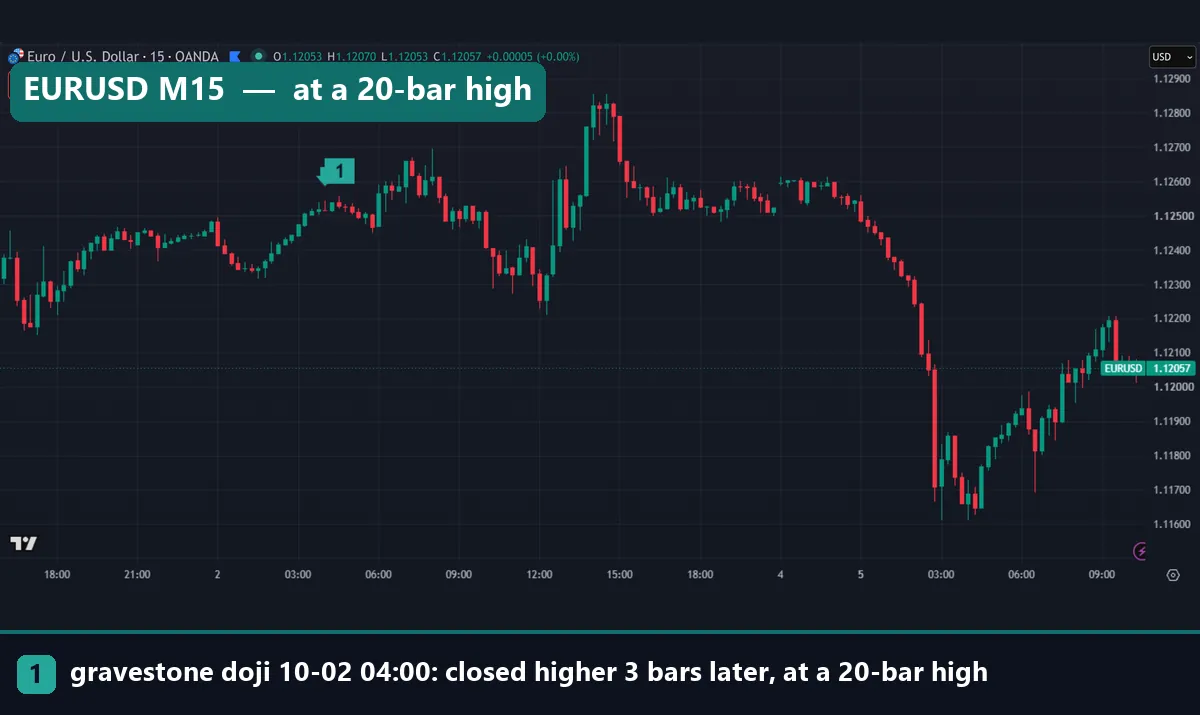
This candle printed at a 20-bar high, the spot that should matter most. Yet three bars later the close was higher. Then price kept climbing into the London session. Note also how small the bar is. Its whole range was about 3 pips, which is normal for the Asian hours on M15.
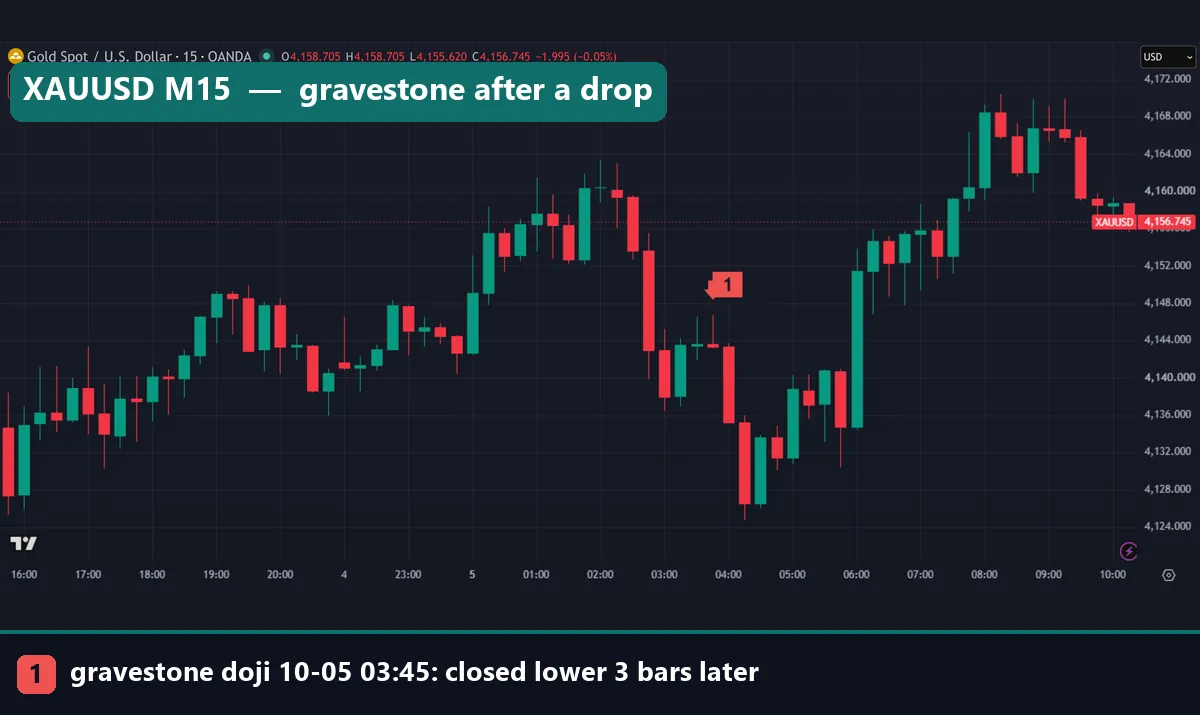
Image 3 shows gold on M15 at 03:45 UTC on 5 October 2026. Here price had already fallen hard in the hour before. The gravestone sat in a small pause, not at a top. Three bars later gold closed lower. Then it fell to the 4,124 area before a strong rally. So the “right” outcome came from a candle in the “wrong” place.
Worked example with real prices
Take the GBPUSD daily bar from Image 1. Our OANDA data gives these prices for 15 June 2026: open 1.34092, high 1.34610, low 1.34064, close 1.34120.
- Range: 1.34610 – 1.34064 = 54.6 pips.
- Body: 1.34120 – 1.34092 = 2.8 pips, or 5.1% of the range.
- Lower wick: 1.34092 – 1.34064 = 2.8 pips, also 5.1%.
- Upper wick: 1.34610 – 1.34120 = 49.0 pips, about 90% of the range.
All three rules pass, so the bar qualifies. Next, consider a trader who sells the close with a stop above the high. That stop sits 49.0 pips away, plus spread. That is the hidden cost of this pattern. Because the wick is long, the stop must be wide.
Now the gold bar from Image 3. It opened at 4,143.64, hit 4,146.76, fell to 4,143.17 and closed at 4,143.31. The range was $3.59. The body was about $0.33, or 9.1% of the range, so it only just passed. The lower wick was $0.14. A small change in the body rule would have dropped this candle from the sample.
What our gravestone numbers show
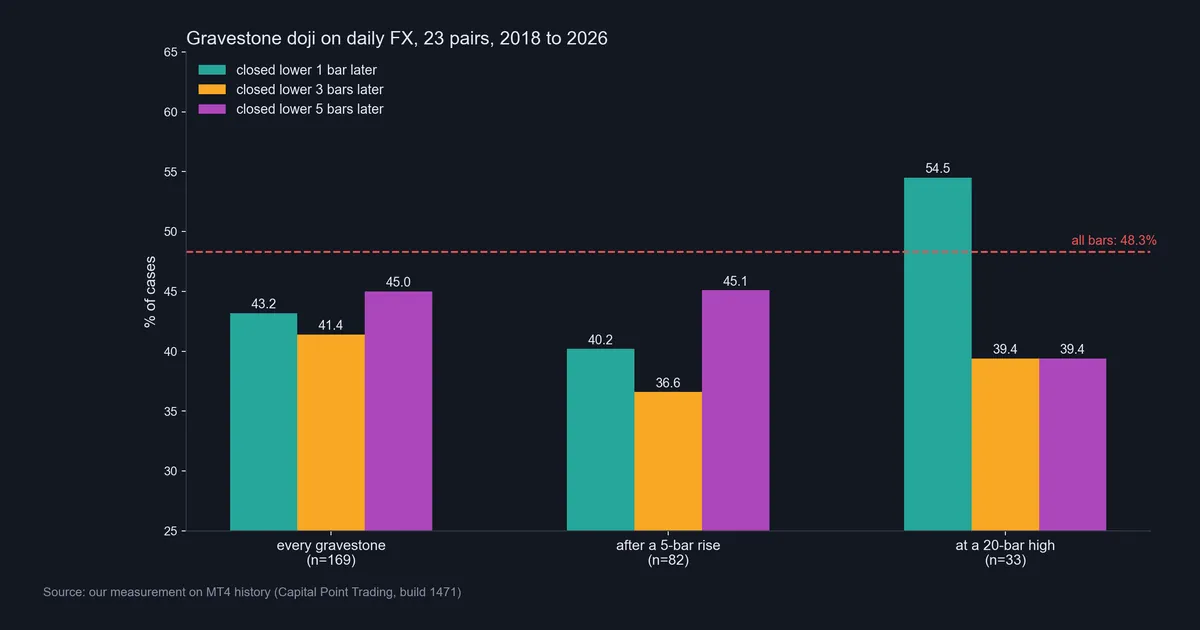
On daily FX we found 169 gravestones across 23 pairs. Only 43.2% closed lower the next day. Every daily bar closed lower 48.9% of the time. So the gravestone did worse than a random day, not better. Three days out, the figure was 41.4% against a 48.3% base. Five days out it was 45.0% against 48.3%.
The “after an advance” group (82 cases) was weaker still: 40.2%, 36.6% and 45.1%. Only the “at a 20-bar high” group beat the base on the next day, at 54.5%. However, that group holds just 33 candles. A sample that small can swing by several points from one or two trades. Also, by three and five days its figures fell to 39.4%. Our note on backtest sample size explains why 33 cases prove very little.
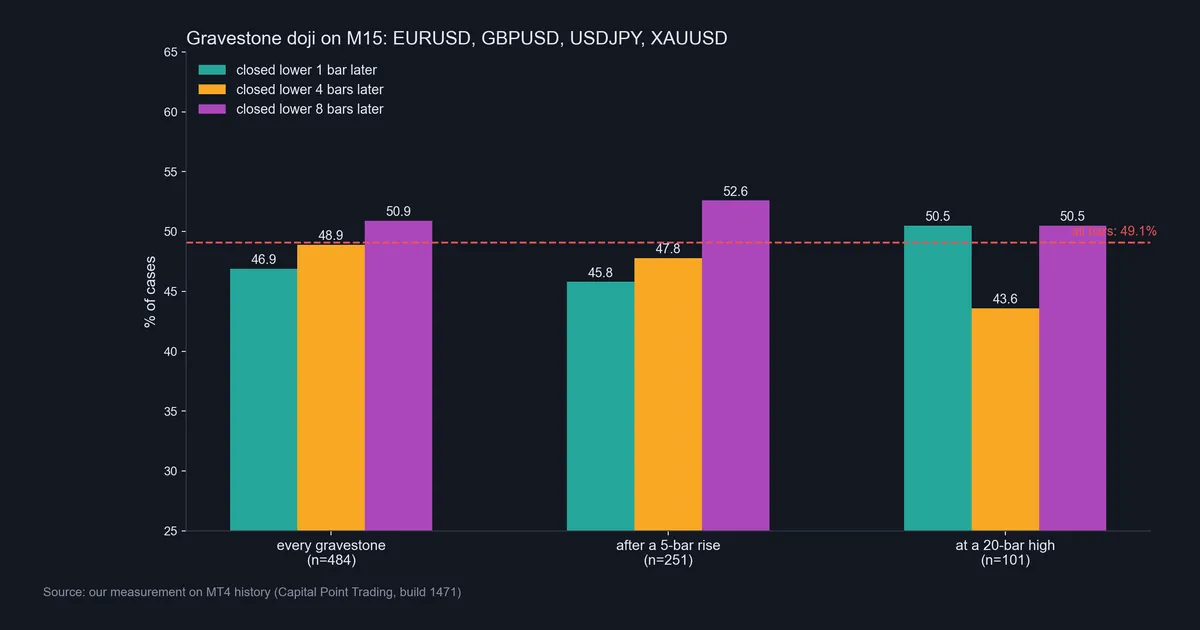
The 15-minute test found 484 gravestones on four symbols. Next-bar figures were 46.9% against a 48.9% base. Four bars out it was 48.9% against 49.1%. Eight bars out it was 50.9% against 48.8%. In short, that is noise around the base rate. The 101 candles at a 20-bar high gave 50.5%, 43.6% and 50.5%. Again, nothing stands apart.
Download the complete indicator database
Put these concepts on your charts. One email unlocks the full library of 1,380+ indicators with compiled MT4 and MT5 files, plus my TradingView scripts. No paywall, no spam, unsubscribe any time.
Get free access to my indicator database
One email unlocks 1,380+ free MT4, MT5 and TradingView indicators — the complete library. No single-tool download; you get the whole database.
Where it fails
The gravestone fails as a stand-alone sell signal on our data. That is the plain finding. Here are the specific weak points.
- No directional edge. On daily FX it closed lower less often than all bars. On M15 it matched the base rate.
- Tiny samples where it looks good. The one result above base (54.5%) rests on 33 candles.
- Wide stops. The natural stop goes above the wick, and the wick is most of the bar.
- Rule sensitivity. Small changes to the body or wick limits add or drop many candles. Results can shift with them.
- Session effects. On M15, quiet Asian bars form dojis easily. The range filter helps, but it does not remove them all.
- No costs in our test. Spread and commission would make every figure worse. See our page on backtesting transaction costs.
We also did not test gold on the daily chart, stocks or crypto. So these numbers say nothing about those markets.
Two charts where the textbook reading broke
The next two charts show the problem in practice. In the first, the pattern “worked” for the wrong reason. In the second, it simply failed.
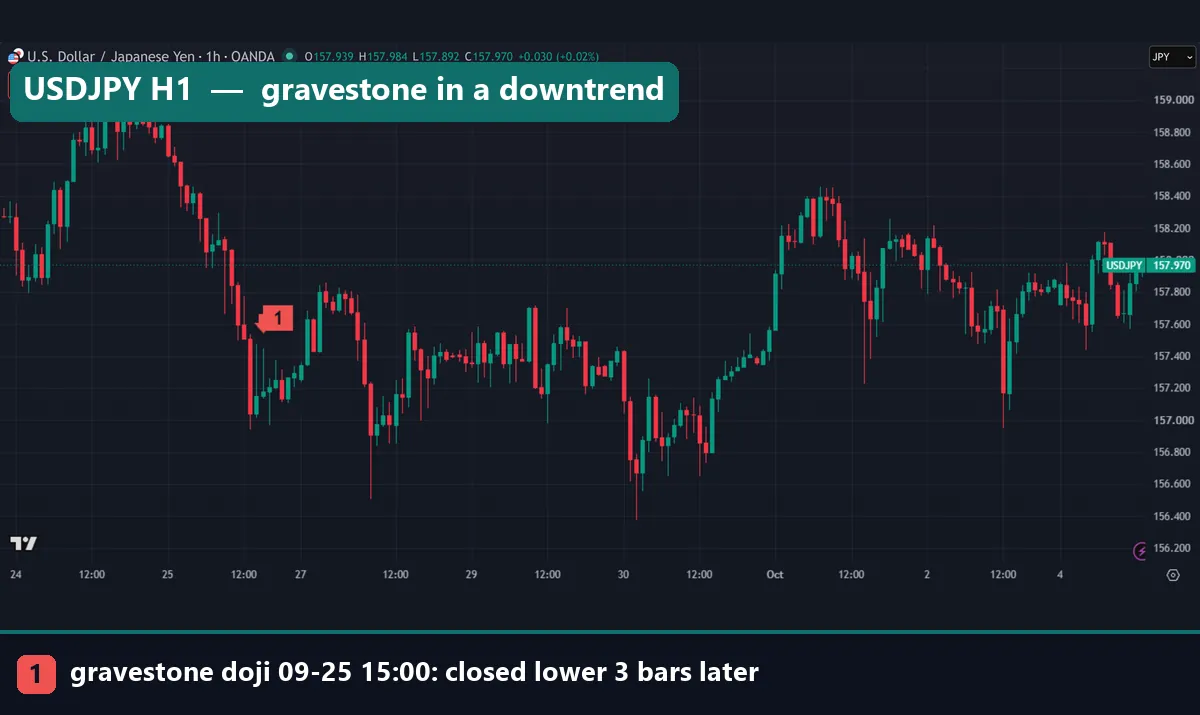
Image 6 shows USDJPY on H1. Marker 1 sits at 15:00 UTC on 25 September 2026. The pair had already fallen from near 158.9, so this gravestone came after a decline, not a rise. Its range was 31.4 pips and its body only 2.8 pips. Three bars later the close was lower, but the trend was already down. The candle added nothing a trader could not see from the slope.
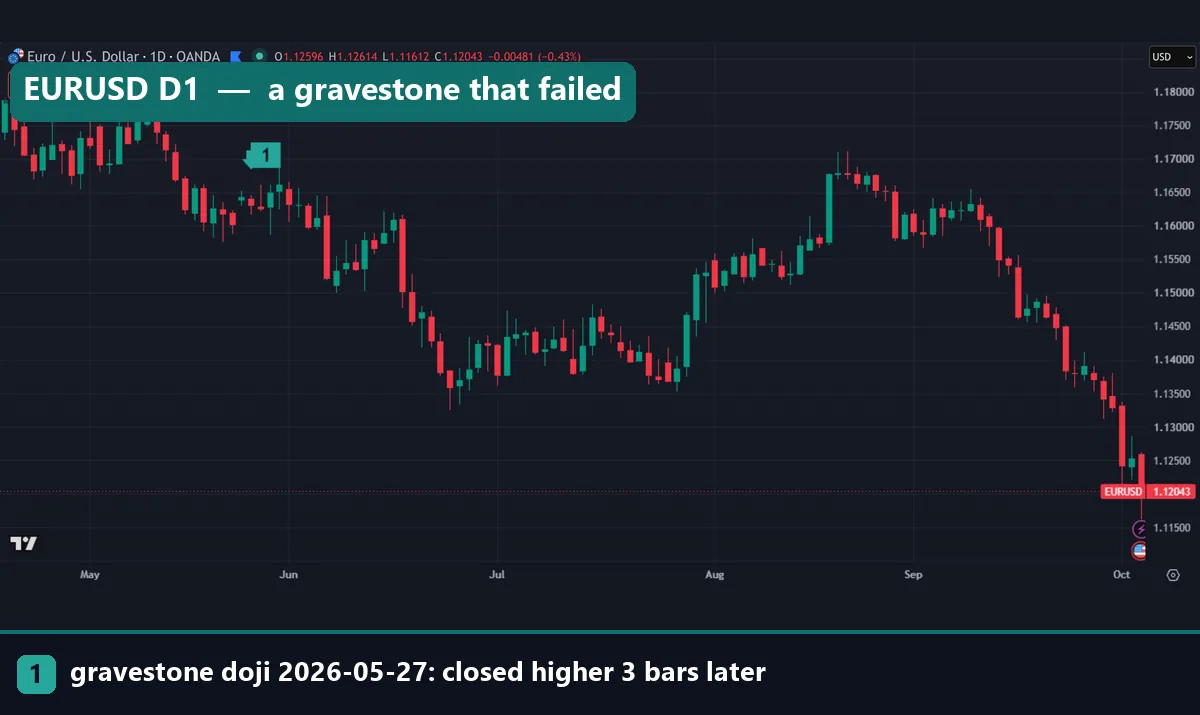
Image 7 is EURUSD daily, with marker 1 at 27 May 2026. The bar opened at 1.16286, reached 1.16615 and closed at 1.16258. Three days later the pair closed higher. Then it drifted sideways and slightly up before the mid-June drop. Anyone who sold this gravestone with a stop above 1.16615 sat through a long, flat wait.
Common mistakes with the gravestone doji
- Trading the shape without a rule. If you cannot write your definition down, you cannot test it. Then your eye picks only the winners.
- Ignoring the base rate. “It fell afterwards 45% of the time” sounds useful. But it is weak when any bar falls 48% of the time.
- Trusting a small sample. A good result from 30 candles is a question to test, not an answer.
- Selling into an existing downtrend. As Image 6 shows, a gravestone after a fall tells you less than the trend itself.
Our article on whether candlestick patterns work at all finds the same theme across many other shapes.
If you still want to use it
We would not trade the gravestone on its own. Still, the candle can be a prompt to look closer. For example, a gravestone that tags a level you already marked is worth a second look. Our guide on candlestick patterns at support and resistance covers that approach.
If you do act on one, size the trade from the stop distance, not from a fixed lot. The wick sets that distance, so the position must shrink to match. Our stop loss guide explains the steps. Then log every case, including the ones that fail, and compare the log with your own base rate.
Where to go next
For the wider family of shapes, start with our bearish candlestick patterns overview. Then keep the Japanese candlestick cheat sheet beside your chart. Our guide to Japanese candlestick charting techniques covers the history and the method behind the names. To mark dojis automatically in MetaTrader, see the Doji Reader indicator.
Outside our site, the gravestone doji entry at BabyPips gives a short plain definition. StockCharts has a clear introduction to candlesticks at StockCharts ChartSchool. The doji article on Wikipedia lists the doji types side by side.
FAQ: gravestone candlestick questions
Is a gravestone candlestick bullish or bearish?
Textbooks call it bearish. On our daily FX data, though, it closed lower the next day only 43.2% of the time, against 48.9% for all bars.
What is the difference between a gravestone and a dragonfly doji?
They are mirror images. The gravestone has its open and close at the low with a long upper wick. The dragonfly has them at the high with a long lower wick.
How often does a gravestone doji appear?
Rarely with a strict rule. We found 169 on 37,748 daily FX candles, and 484 on fourteen months of M15 data for four symbols.
Does a gravestone at a high work better?
The next-day figure rose to 54.5% at a 20-bar high. But that rests on 33 candles, and the three- and five-day figures fell to 39.4%.
Which timeframe is best for the gravestone doji?
Neither of the two we tested showed an edge. On M15 the results sat close to the base rate at every horizon we checked.
Where should the stop go on a gravestone trade?
Most traders place it above the high of the wick. Because the wick is most of the bar, that stop is wide, so the position size must be smaller.
Can an indicator find gravestone candles for me?
Yes, a pattern scanner can mark them. However, check which body and wick limits it uses, because those limits decide which bars it flags.
Should I trade every gravestone candlestick I see?
Our data says no. Treat it as a prompt to check the level and trend, then decide with a written plan; results are not guaranteed; past performance is not indicative of future results.
Last updated: 5 October 2026.

About the author
Written by Dominic Walsh, a Forex trader and MT4/MT5 indicator, Expert Advisor and script developer. Every tool on forexmt4systems.com is tested on live charts before release and ships with ready-to-use compiled MT4 (.ex4) and MT5 (.ex5) files. Learn more about the trader and developer behind this site.
How we build, test and correct every tool: Editorial & Testing Policy. Trading carries risk; see the disclaimer.