
This Japanese candlestick cheat sheet covers 11 common patterns, each with the exact rule we used to count it and what price did 1, 3 and 5 days later. We counted them on 37,748 daily candles from 23 forex pairs. So here is the honest headline first: most patterns beat a random candle by only a few points, and some did not beat it at all. For example, the shooting star and the evening star did worse than chance at 3 days. On the other hand, the tweezer bottom and the hammer were among the better ones. We also built a free two-page printable PDF with the same numbers, and you get it by entering your email in the form further down this page.
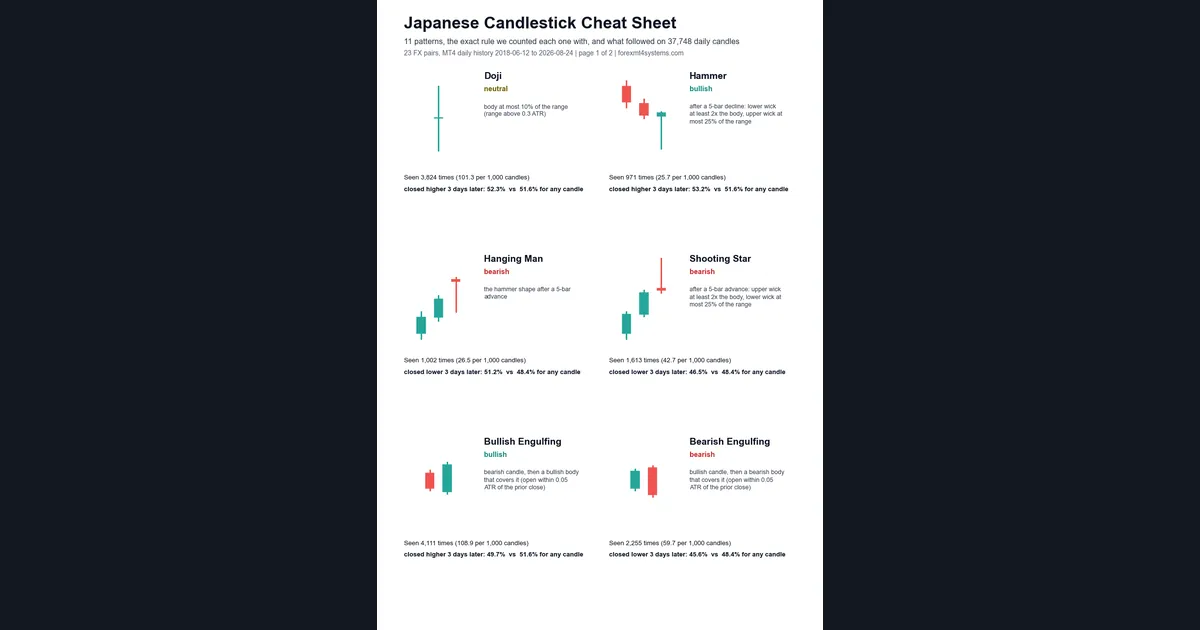
What this Japanese candlestick cheat sheet covers
A candlestick shows four prices for one period: the open, the high, the low and the close. The body runs from the open to the close. The thin lines above and below are the wicks, and they mark the high and the low. Traders in Japan used this format for rice markets long before it reached Western charts. Then Steve Nison brought it to a wide audience, and his own site keeps a candlestick pattern library at Candlecharts.com.
A pattern is one, two or three candles with a shape that traders read as a hint. However, most cheat sheets stop at the drawing. This one adds three things per pattern: the rule in plain words, how often it showed up, and what followed. If you want the background first, our candlestick patterns explained page and the guide to reading candlestick charts cover the basics.
How a candlestick pattern rule works
Every pattern is a set of size tests on the body and the wicks. First, measure the parts of the candle:
body = |close - open|range = high - lowupper wick = high - max(open, close)lower wick = min(open, close) - low
Next, compare those parts with each other or with volatility. For example, a doji in our count needs body <= 0.10 x range. A hammer needs lower wick >= 2 x body and upper wick <= 0.25 x range.
Some rules also need a size floor, because a tiny doji on a dead day says little. So we used the 14-period Average True Range (ATR) as the yardstick. You can see ATR on your own chart with our ATR indicator. A doji only counted if its range was above 0.3 ATR.
Finally, some patterns need a prior move. A hammer is a hammer only after a decline. In code, a decline means the close before the pattern sits below the close five bars before that. Without that test, the same shape is just a candle with a long lower wick.
How we tested the patterns
We read the daily history straight from the site owner’s MetaTrader 4 terminal (Capital Point Trading MT4, build 1471). The sample holds 23 FX pairs, from AUDCAD to USDJPY, between 12 June 2018 and 24 August 2026. That gives 37,748 daily candles in total. Then a script tested every candle against the 11 rules and recorded the close 1, 3 and 5 days later.
“Followed through” means the later close sat beyond the pattern’s close in the pattern’s direction. For a bullish pattern, that is a higher close. For a bearish one, it is a lower close. The doji has no direction, so we report how often it closed higher.
Next comes the part most cheat sheets skip: the base rate. Across all 37,748 candles, the close was higher 1 day later 51.0% of the time, and higher 3 and 5 days later 51.6% of the time. So a bearish pattern must beat 49.0% at 1 day and 48.4% at 3 or 5 days. A pattern only helps if it beats those numbers.
The chart images below are TradingView web chart captures (OANDA feed) from June to October 2026. They show what the shapes look like, but the statistics come only from the MT4 history. Our full method is on the editorial testing policy page.
The rules we counted: thresholds and parameters
These are the exact settings behind every number on this page.
| Parameter | Value we used | Used by |
|---|---|---|
| Volatility yardstick | ATR, 14 periods | All size tests |
| Prior trend test | Close before the pattern vs the close 5 bars earlier | Hammer, hanging man, shooting star, tweezers |
| Doji body | At most 10% of the range, range above 0.3 ATR | Doji |
| Long wick | At least 2x the body; opposite wick at most 25% of the range | Hammer, hanging man, shooting star |
| Engulfing open tolerance | Open within 0.05 ATR of the prior close | Both engulfing patterns |
| Star sizes | First body above 0.5 ATR, middle body below 0.3 ATR | Morning and evening star |
| Tweezer match | Lows or highs within 0.05 ATR | Tweezer bottom and top |
| Marubozu | Body at least 90% of the range and above 0.7 ATR | Bullish marubozu |
The engulfing tolerance needs a word. In FX, the daily open usually sits a few pips from the prior close. So a strict “open below the prior close” test would miss most engulfing candles. We allowed 0.05 ATR of slack instead.
The 11-pattern results table
Here is the sheet itself. Each “after” column is the share of patterns that followed through. The base column shows the same figure for any candle, so you can read the gap at a glance.
| Pattern | Bias | Seen (per 1,000) | After 1 day | After 3 days | After 5 days | Base 1 / 3 / 5 | 3-day gap |
|---|---|---|---|---|---|---|---|
| Doji | Neutral (closed higher) | 3,824 (101.3) | 51.6% | 52.3% | 52.3% | 51.0 / 51.6 / 51.6 | +0.7 |
| Hammer | Bullish | 971 (25.7) | 52.1% | 53.2% | 50.4% | 51.0 / 51.6 / 51.6 | +1.6 |
| Hanging man | Bearish | 1,002 (26.5) | 48.9% | 51.2% | 47.8% | 49.0 / 48.4 / 48.4 | +2.8 |
| Shooting star | Bearish | 1,613 (42.7) | 47.9% | 46.5% | 46.9% | 49.0 / 48.4 / 48.4 | -1.9 |
| Bullish engulfing | Bullish | 4,111 (108.9) | 49.6% | 49.7% | 51.6% | 51.0 / 51.6 / 51.6 | -1.9 |
| Bearish engulfing | Bearish | 2,255 (59.7) | 49.3% | 45.6% | 45.6% | 49.0 / 48.4 / 48.4 | -2.8 |
| Morning star | Bullish | 587 (15.6) | 50.9% | 52.0% | 54.4% | 51.0 / 51.6 / 51.6 | +0.4 |
| Evening star | Bearish | 898 (23.8) | 47.9% | 44.5% | 45.6% | 49.0 / 48.4 / 48.4 | -3.9 |
| Bullish marubozu | Bullish | 669 (17.7) | 49.6% | 48.8% | 49.0% | 51.0 / 51.6 / 51.6 | -2.8 |
| Tweezer bottom | Bullish | 1,102 (29.2) | 53.9% | 53.3% | 53.5% | 51.0 / 51.6 / 51.6 | +1.7 |
| Tweezer top | Bearish | 1,142 (30.3) | 46.6% | 48.9% | 48.5% | 49.0 / 48.4 / 48.4 | +0.5 |
The tweezer bottom was the steadiest: it beat the base at all three horizons. The hammer was ahead at 1 and 3 days, but it fell back to 50.4% at 5 days. The morning star started slowly, then reached 54.4% at 5 days. Meanwhile, the evening star, the bearish engulfing and the shooting star all trailed the base. In plain terms, after those three bearish shapes, price rose more often than after a random day.
Reading single candles on a chart: doji and hammer
Single-candle patterns are the easiest to spot and the easiest to misread. Look at the EURUSD daily chart below.
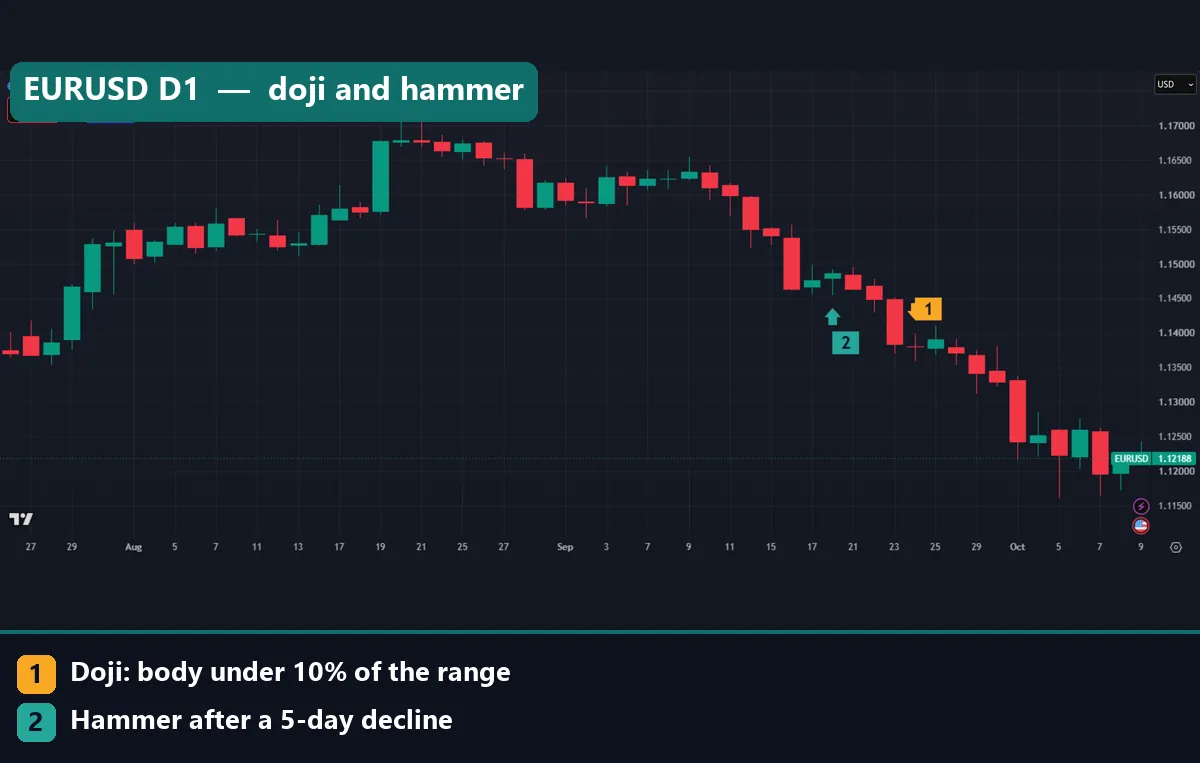
Marker 1 sits on the doji of 24 September 2026. It opened at 1.13808 and closed at 1.13802, so the body was under one pip. Yet the range ran from 1.13592 to 1.13992, about 40 pips. In other words, buyers and sellers both pushed hard and ended level. Our doji candle meaning page goes deeper on the variants.
Marker 2 is the hammer of 18 September. It came after five days of falling closes, so it passed our trend test. Still, the shape alone did not stop the fall. The hammer vs hanging man guide explains why the same shape gets two names.
Reading two-candle patterns: engulfing
Engulfing patterns compare two bodies. The second body must cover the first and point the other way.
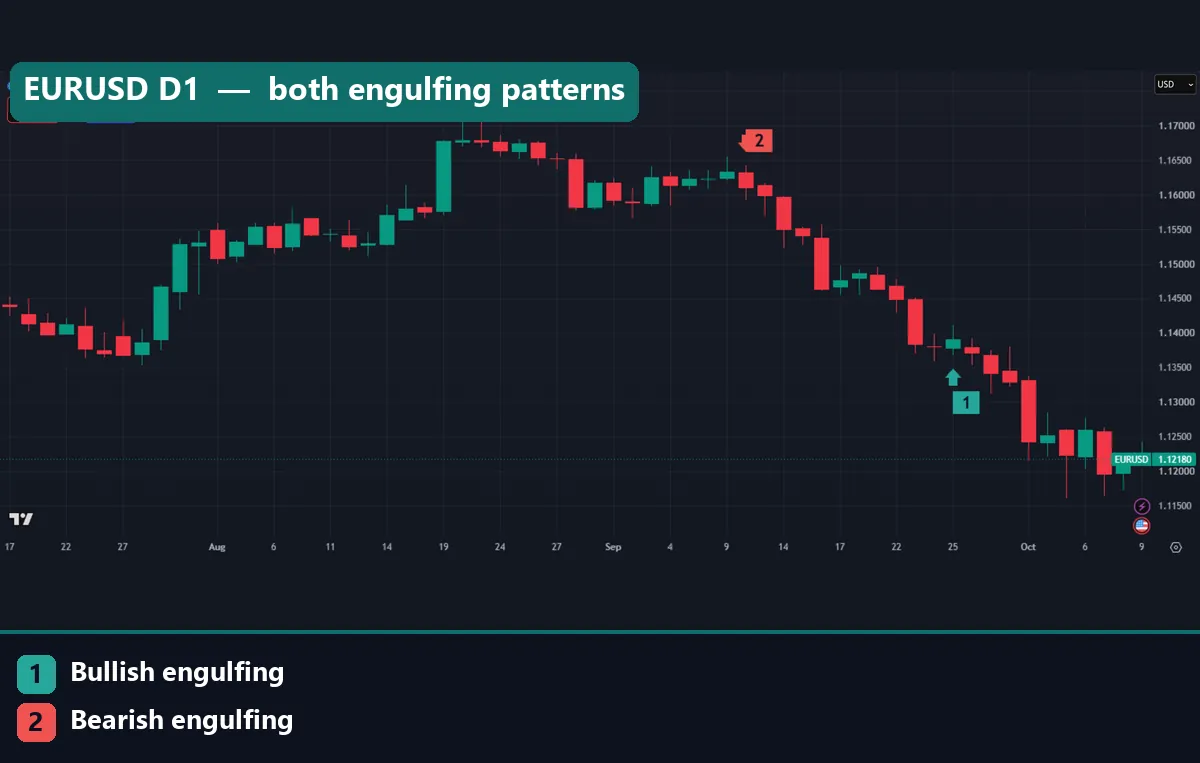
Marker 1 is the bullish engulfing candle of 25 September. It opened at 1.13788, just below the doji’s close, and closed at 1.13911. So its body covered the doji’s tiny body. But look at what followed: price kept falling, and our capture ends at 1.12752. That is the 49.7% figure in action. A bullish engulfing candle followed through less often than a random day at 3 days.
Marker 2 is the bearish engulfing candle of 10 September, which opened at 1.16318 and closed at 1.16100. This one did lead into a sharp slide. However, one good example proves nothing, since across the sample the pattern trailed the base. For the full rules, see our engulfing candle meaning page.
Also note the counts. We found 4,111 bullish engulfing candles but only 2,255 bearish ones. We have not pinned down why, so we simply report it.
Worked example: EURUSD in September 2026
Let’s run the hammer rule by hand on marker 2 from the first chart. The 18 September candle printed these prices: open 1.14792, high 1.14919, low 1.14550, close 1.14863.
- Body: 1.14863 minus 1.14792 = 7.1 pips.
- Lower wick: 1.14792 minus 1.14550 = 24.2 pips, which is 3.4 times the body. That passes the 2x test.
- Upper wick: 1.14919 minus 1.14863 = 5.6 pips.
- Range: 36.9 pips, so the upper wick is 15% of it. That passes the 25% cap.
So the candle is a valid hammer. Next, check what followed. Four sessions later, the doji of 24 September closed at 1.13802. That is about 106 pips below the hammer’s close. So this hammer failed, even though it was a clean one.
Now compare with the table. Across 971 hammers, 53.2% closed higher 3 days later, against 51.6% for any candle. That 1.6-point gap is real in a big sample. Yet it means roughly 47 of every 100 hammers went the other way within 3 days.
The same check works for the shooting star. On 9 September, the candle opened at 1.16238, peaked at 1.16544 and closed at 1.16332. Its upper wick was 21.2 pips against a 9.4-pip body, so it qualified.
Stars and tweezers on the chart
Three-candle stars need a big candle, a pause, and a reversal close past the first candle’s midpoint.
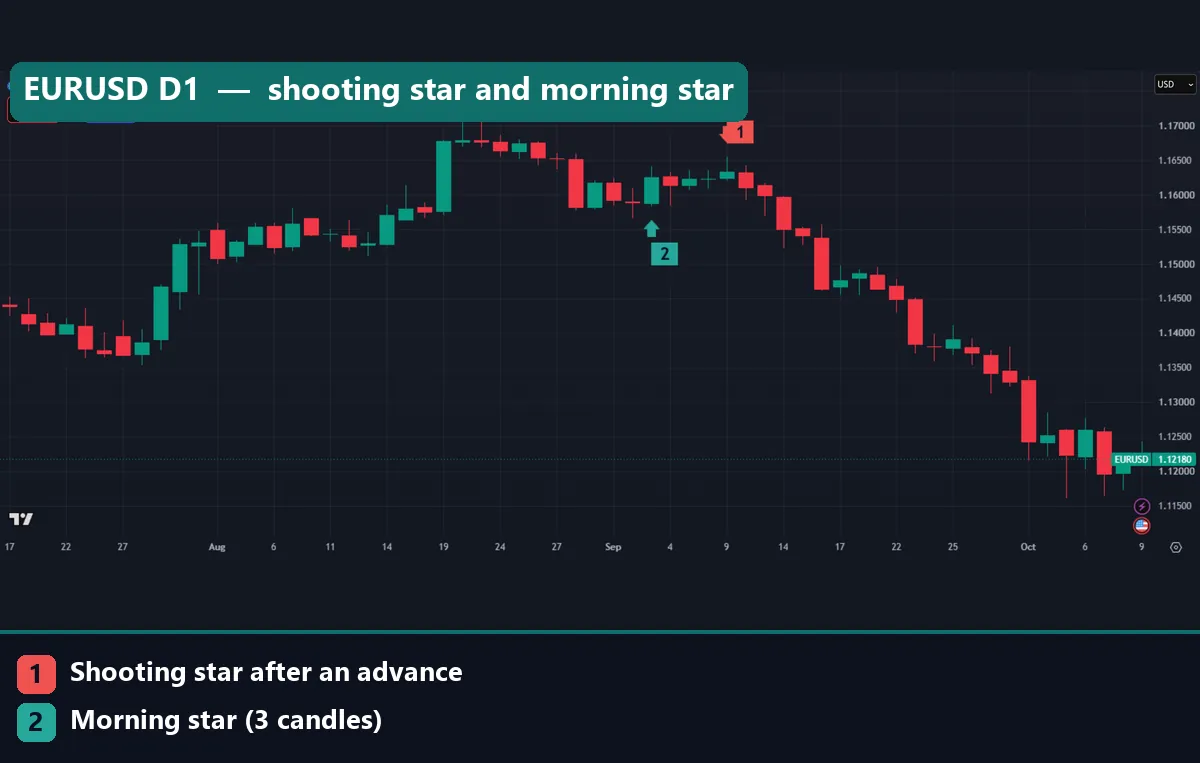
Marker 1 is the shooting star of 9 September from the worked example. Marker 2 marks the morning star that finished on 3 September: a red candle, a small doji-like pause, then a green close at 1.16256. Our morning vs evening star page compares the two in detail.
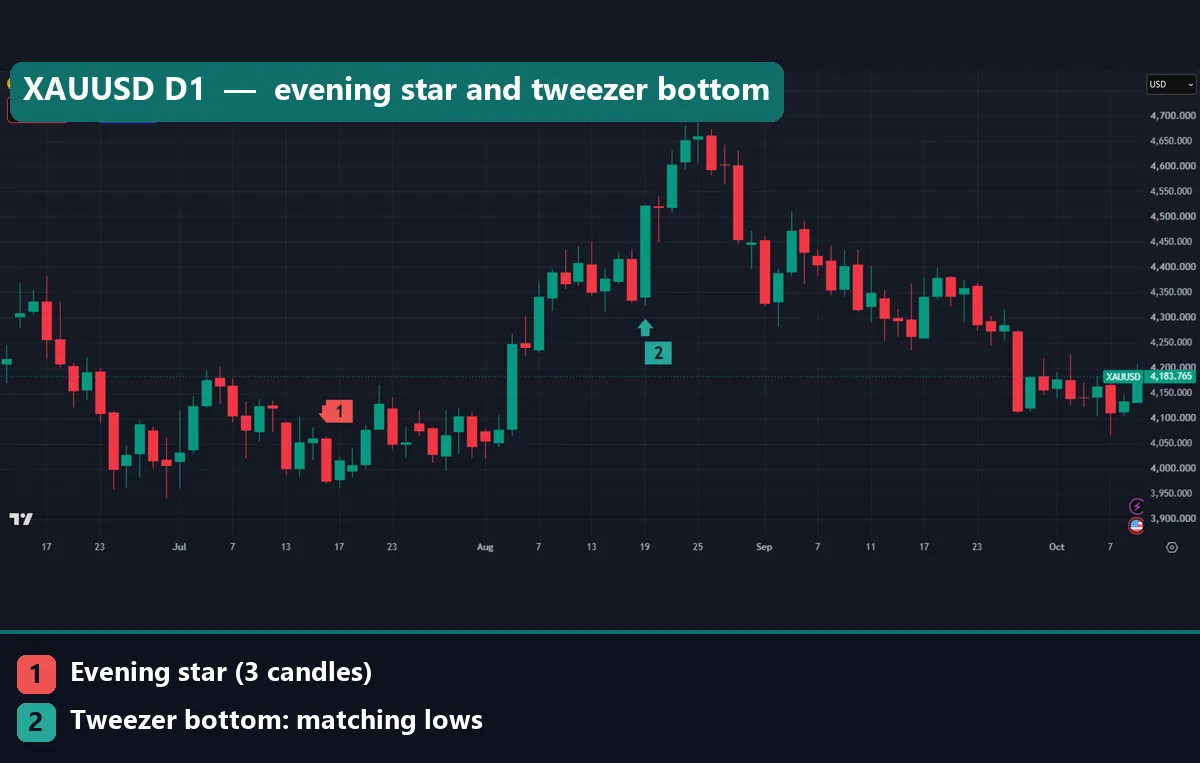
On gold, marker 1 is an evening star that ended on 16 July 2026, with a close at 3,976.58. Marker 2 is a tweezer bottom on 19 August: the low of 4,324.68 matched the prior red candle’s low, then price rallied. Note that our statistics cover FX pairs only, not gold. So treat the gold chart as a shape example. The tweezer tops and bottoms guide covers both sides.
Get the two-page printable PDF
We put this whole sheet into a free two-page PDF. It has the drawing, the rule, the count and the 3-day result for all 11 patterns, next to the base rate. It also has a short “how to read the numbers” box. To get it, enter your email in the form below, and we will send you the download link.
Download the complete indicator database
Put these concepts on your charts. One email unlocks the full library of 1,380+ indicators with compiled MT4 and MT5 files, plus my TradingView scripts. No paywall, no spam, unsubscribe any time.
Download this cheat sheet free
Enter your email and the file is yours. You also get the full MT4 and MT5 library.
Where it fails
First, the gaps are small. The best 3-day gap in our table was 2.8 points. After spreads and a few bad fills, an edge that size can vanish. Note that our counts do not deduct spread, slippage or swap.
Second, the rules are ours. Change the doji body from 10% to 5%, or the trend test from 5 bars to 10, and the counts change. Thomas Bulkowski publishes his own candlestick pattern statistics on ThePatternSite, built on stocks and different rules. So do not expect his numbers and ours to match.
Third, we measured daily candles only. The hourly chart below shows the same shapes on GBPUSD, but we have no hourly statistics for them.
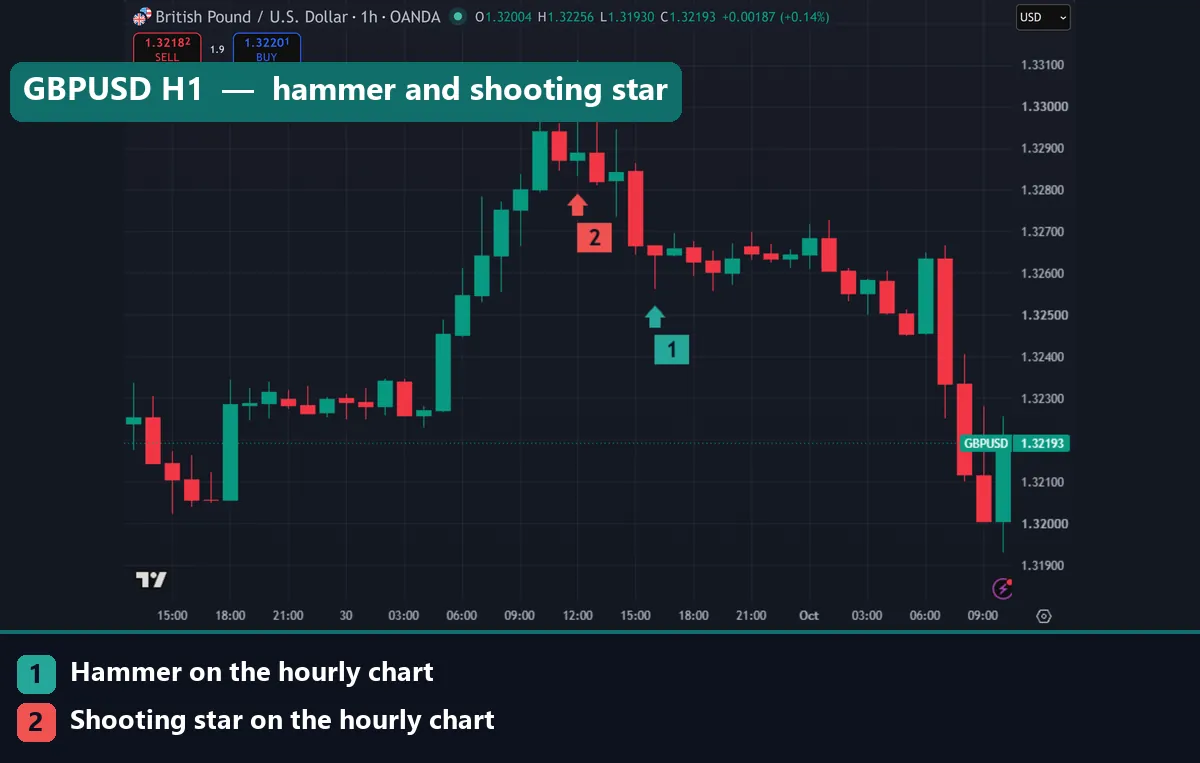
Marker 2 points to the shooting star at 12:00 UTC on 30 September, with a high of 1.33111. Marker 1 points to the hammer at 16:00 UTC, with a low of 1.32563. Both look textbook. But hourly candles carry more noise, so the gaps could be smaller still.
Finally, the past sample covers 2018 to 2026. Markets change, and a pattern that held up there can stop working.
Using patterns as context, not signals
Since no pattern carried much of an edge alone, use it as one piece of evidence. Three questions help.
- Location: is the candle at a level that matters, such as a prior swing or a round number? Our page on candlestick patterns at support and resistance shows how.
- Trend: does the pattern fight a strong trend or join it?
- Confirmation: did the next candle close in the pattern’s direction?
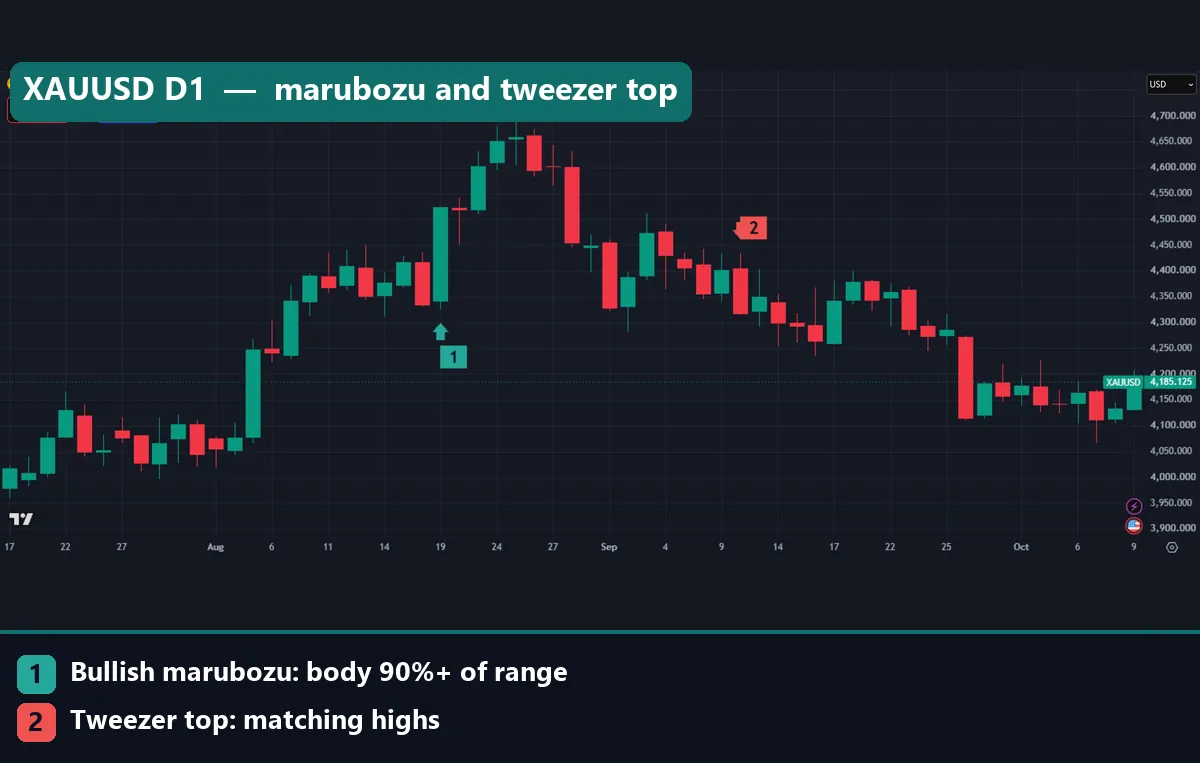
On this gold chart, marker 1 is the bullish marubozu of 19 August. It opened at 4,341.965 and closed at 4,523.05, and its body was about 91% of the range. Yet in our FX sample, a bullish marubozu followed through only 48.8% of the time at 3 days. Marker 2 is the tweezer top of 10 September, where two highs matched after a bounce. That one came at a lower high under the August peak, which is the kind of location that adds weight. Our marubozu candlestick page covers the full-body shape.
Common mistakes with candlestick patterns
- Ignoring the base rate. A 52% result sounds fine until you learn that a random candle scored 51.6%. Always ask: better than what?
- Skipping the trend test. A hammer in the middle of a range is not a hammer. Without the prior decline, the label means little.
- Trading on the open of the next bar without a plan. The pattern gives no stop or target. So set the stop beyond the pattern’s extreme and size the trade before entry.
- Trusting one memorable chart. The 10 September bearish engulfing looked perfect. Still, across 2,255 cases, that pattern trailed a random day.
Our article do candlestick patterns work looks at this question from more angles.
Where to go next
If you want a scanner on your chart, try the candlestick pattern detector indicator or the Japanese candlestick patterns indicator for MT4 and MT5. For the three-candle stars alone, the morning star evening star indicator marks them for you. The downloads are compiled files, and their thresholds may differ from ours, so check the settings first.
For more reading, the candlestick charts article in StockCharts ChartSchool covers the history. Also, the candlestick pattern entry on Wikipedia lists many patterns we left out.
FAQ: Japanese candlestick cheat sheet
Which candlestick pattern did best in your test?
The tweezer bottom was the steadiest, with 53.9%, 53.3% and 53.5% at 1, 3 and 5 days, against a base of 51.0% and 51.6%.
Which patterns did worse than chance?
At 3 days, the evening star (44.5%), bearish engulfing (45.6%), shooting star (46.5%), bullish engulfing (49.7%) and bullish marubozu (48.8%) all trailed their base rates.
What is a base rate here?
It is how often any candle was followed by a higher close: 51.0% after 1 day and 51.6% after 3 or 5 days, so bearish patterns need to beat 49.0% and 48.4%.
How many candles did you test?
We tested 37,748 daily candles from 23 FX pairs, taken from MT4 history between 12 June 2018 and 24 August 2026.
Do these numbers apply to gold or stocks?
No, because the sample holds FX pairs only, so the gold charts on this page show shapes, not tested results.
Do the results include trading costs?
No, they compare closes only, so spread, slippage and swap would shrink every gap in the table.
How do I get the printable cheat sheet?
Enter your email in the form on this page, and we send a link to the free two-page PDF with all 11 patterns and their numbers.
Should I trade a pattern on its own?
We would not, since the gaps were a few points at best, so add location, trend and a next-candle close before acting; results are not guaranteed; past performance is not indicative of future results.
Last updated: 1 October 2026.

About the author
Written by Dominic Walsh, a Forex trader and MT4/MT5 indicator, Expert Advisor and script developer. Every tool on forexmt4systems.com is tested on live charts before release and ships with ready-to-use compiled MT4 (.ex4) and MT5 (.ex5) files. Learn more about the trader and developer behind this site.
How we build, test and correct every tool: Editorial & Testing Policy. Trading carries risk; see the disclaimer.