
A bullish candlestick is any candle that closes above its open, and on its own it tells you far less than most chart guides suggest. We counted 37,748 daily candles on 23 FX pairs and 85,399 fifteen-minute candles on 14 symbols to check the popular bullish patterns against plain chance. This guide settles three questions. What is the candle? How often does it print? And do the famous bullish patterns move price more than an ordinary bar does?
What a bullish candlestick is
A candle records four prices for one period: the open, the high, the low and the close. When the close sits above the open, the candle is bullish. Most platforms paint it green or white. A close below the open makes it bearish. That is the whole definition. Nothing about size, wicks or position is required.
The body is the box between the open and the close. The wicks, also called shadows, are the thin lines above and below the body. The upper wick reaches the high and the lower wick reaches the low. So a bullish candle with a long lower wick tells you sellers pushed price down during the period, but buyers then lifted it back above the open by the close.
Our guide to reading candlestick charts and the page on what candlestick wicks mean cover both parts in more detail.
How a bullish candle works: body, wicks and the numbers behind them
Every candle shape comes from simple arithmetic on the four prices. These are the measures pattern rules use, and they are the same ones we used in our counts:
bullish = close > openbody = |close - open|range = high - lowupper wick = high - max(open, close)lower wick = min(open, close) - lowbody share = body / range
A body share near 1 means the candle has almost no wicks. That is a marubozu. A body share near 0 means open and close nearly match, which is a doji. Then a hammer is a small body with a lower wick at least twice its size.
Many pattern rules also compare size with ATR, the average true range over recent bars. That way “large” means large for that pair at that time, not a fixed number of pips. MetaTrader exposes them through the MqlRates structure in the MQL5 documentation, which is where our scripts read them.
How we tested
We ran two measurements on the site owner’s MetaTrader 4 terminal history (Capital Point Trading MT4, build 1471), read straight from the .hst files. First, daily candles on 23 FX pairs from 12 June 2018 to 24 August 2026, a total of 37,748 candles. Second, 15-minute candles on 14 symbols from 2 June 2025 to 26 August 2026, a total of 85,399 bars.
For each pattern we asked one question: did price close higher a set number of bars later? On daily charts we checked 1, 3 and 5 bars ahead. On 15-minute charts we checked 1, 4 and 8 bars ahead. Then we compared each result with the base rate, which is how often any bar was followed by a higher close over the same span. A pattern only adds information if it beats that base rate.
The chart images come from the TradingView web chart on the OANDA feed, captured on 1 October 2026 and covering late July to 1 October 2026. Those dates sit after our MT4 sample, so the images illustrate shapes, not the statistics. Our full method is in the editorial testing policy.
The pattern rules we coded
Pattern names are loose, so we wrote each rule down before counting. The table shows the exact rules and how often each bullish pattern appeared on the daily chart.
| Pattern | Rule we used | Daily count | Per 1,000 daily bars |
|---|---|---|---|
| Bullish engulfing | A bearish candle, then a bullish candle whose body covers it (open within 0.05 ATR of the prior close counts) | 4,111 | 108.9 |
| Hammer | After a 5-bar decline: lower wick at least 2x the body, upper wick at most 25% of the range | 971 | 25.7 |
| Morning star | Large bearish candle, small-bodied candle, then a bullish close above the first candle’s midpoint | 587 | 15.6 |
| Tweezer bottom | Two candles after a decline whose lows match within 0.05 ATR, bearish then bullish | 1,102 | 29.2 |
| Bullish marubozu | Bullish body at least 90% of the range and larger than 0.7 ATR | 669 | 17.7 |
One caveat applies to the engulfing count. FX daily candles open a few pips from the prior close, so a strict textbook engulfing, where the new candle opens below the prior close, barely exists on FX. We therefore let the open sit within 0.05 ATR of the prior close. That tolerance explains why we found 4,111 engulfing candles, roughly one every nine daily bars.
How often daily candles close bullish
Across our 23 pairs, the share of daily candles that closed above their open ranged from 52.4% on EURUSD and EURAUD to 61.8% on AUDCAD. The median was 56.1%, and 19 of the 23 pairs sat at 58% or lower.
So bullish candles are slightly more common than bearish ones on most pairs. But that does not mean those pairs mostly rose. Also, the base rate for a higher close 5 days later was only 51.6% across the whole sample. In other words, a coin flip with a slight tilt.
In short, a green daily candle is close to the default state of the market, not a signal. Traders look for patterns because they hope a specific shape in a specific place carries more weight. For the mirror shapes, see our page on bearish candlestick patterns.
Reading bullish candlestick patterns on a daily chart
On a chart, start with the candle’s place, not its shape. A hammer means something different after a five-day fall than in the middle of a range. Our rules for hammers, morning stars and tweezer bottoms all require a prior decline for that reason.
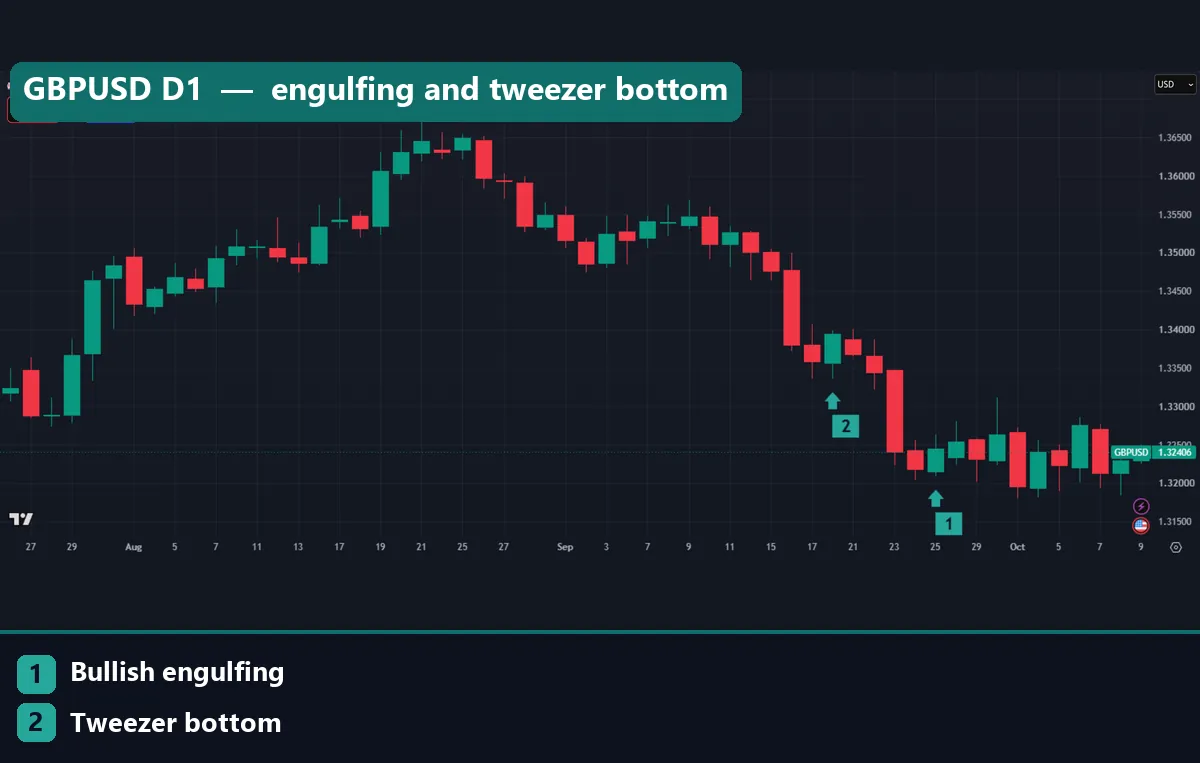
The GBPUSD daily chart shows two marked patterns. Marker 2 sits under 18 September 2026, a tweezer bottom that closed at 1.33947 after opening at 1.33563. Yet the next week, price kept falling. Marker 1 sits under a bullish engulfing on 25 September 2026, opening at 1.32156 and closing at 1.32455. Both fit the rules, yet neither turned the trend.
The tweezer tops and bottoms page explains how the matching lows form. Likewise, the engulfing candle guide shows the body-over-body test in detail.
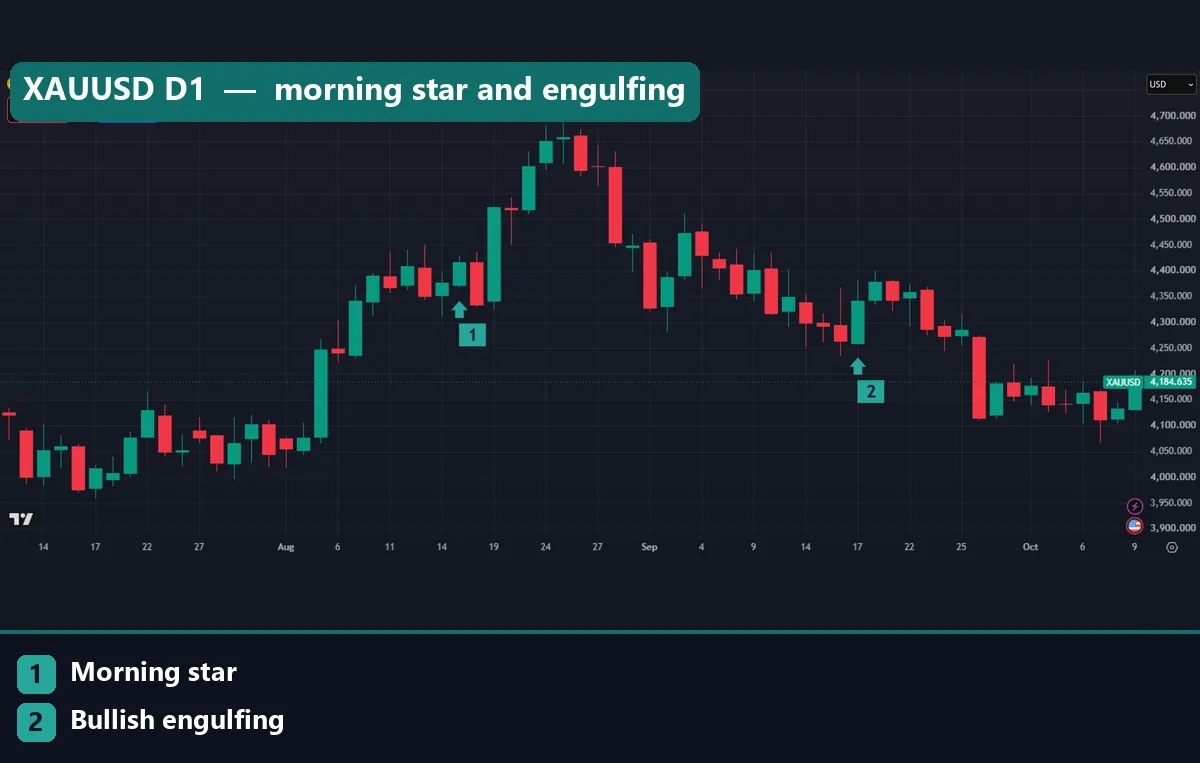
Gold shows the same shapes at a larger scale. On the XAUUSD daily chart, a morning star completed on 17 August 2026, closing at 4,416.68 after opening at 4,372.68. The bullish engulfing of 17 September 2026 opened at 4,260.09 and closed at 4,341.84. Still, price broke lower less than two weeks later.
Follow-through versus the base rate
Here is the core result. Each figure is the share of patterns followed by a higher close, set next to the base rate for any candle.
| Daily pattern | 1 bar | 3 bars | 5 bars | Median 5-bar move (ATR) |
|---|---|---|---|---|
| Any candle (base rate) | 51.0% | 51.6% | 51.6% | n/a |
| Bullish engulfing | 49.6% | 49.7% | 51.6% | 0.054 |
| Hammer | 52.1% | 53.2% | 50.4% | 0.012 |
| Morning star | 50.9% | 52.0% | 54.4% | 0.128 |
| Tweezer bottom | 53.9% | 53.3% | 53.5% | 0.157 |
| Bullish marubozu | 49.6% | 48.8% | 49.0% | -0.046 |
The tweezer bottom beat the base rate by two to three points at every horizon. The morning star reached 54.4% at 5 bars, about three points over the base. Those are the best results, and they are small edges. The hammer helped for 3 bars, then faded to 50.4%, below the 51.6% base.
The bullish engulfing, the most quoted pattern of all, did no better than chance. The bullish marubozu did slightly worse than any candle at 3 and 5 days, and its median 5-day move was negative. A big, clean green bar did not predict more green bars.
Worked example: the EURUSD bullish marubozu of 19 August 2026
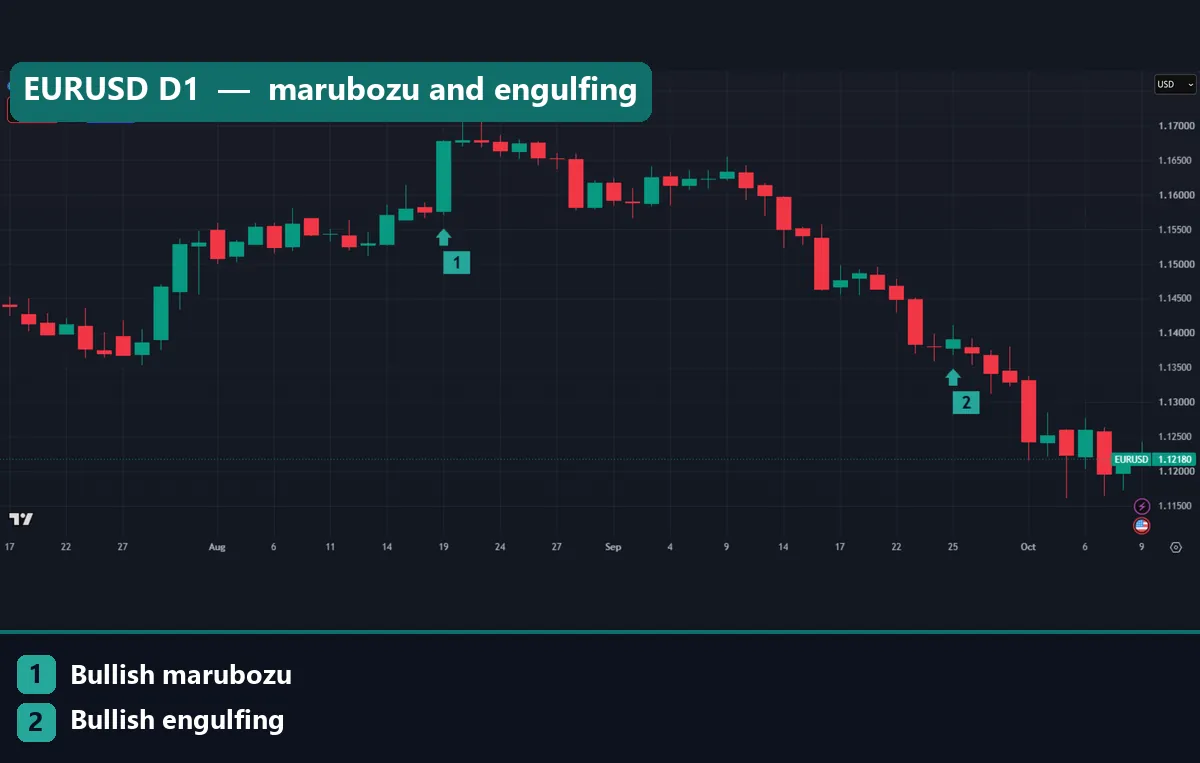
Image 1 at the top of this page shows the candle under marker 1. On 19 August 2026 EURUSD opened at 1.15763, dipped to 1.15702, rose to 1.16792 and closed at 1.16774. Let us run the numbers.
- Range: 1.16792 – 1.15702 = 109.0 pips.
- Body: 1.16774 – 1.15763 = 101.1 pips.
- Body share: 101.1 / 109.0 = 92.8%, above our 90% marubozu line.
- Upper wick: 1.8 pips. Lower wick: 6.1 pips.
By the textbook, buyers controlled the whole day. Our scan also flagged the same candle as a bullish engulfing.
Now the result. Five trading days later, on 26 August 2026, EURUSD closed at 1.16534. That is 24 pips below the marubozu close. One case proves nothing, but it matches the table: across 669 daily marubozu candles, only 49.0% closed higher 5 bars later, against a 51.6% base rate.
Image 1 also marks a bullish engulfing on 25 September 2026 under marker 2. It opened at 1.13788 and closed at 1.13911. Its prior candle was a near-doji, so it covered a body of under one pip, and price kept falling into October. The marubozu candlestick page covers the shape itself.
The same bullish candlestick patterns on hourly charts
Intraday charts print the same shapes many times a day. Image 4 shows EURUSD on the 1-hour chart. Our scan found a hammer at 00:00 UTC on 30 September 2026: open 1.13406, low 1.13360, close 1.13391. At 05:00 UTC a morning star completed with a bullish candle from 1.13318 to 1.13448.
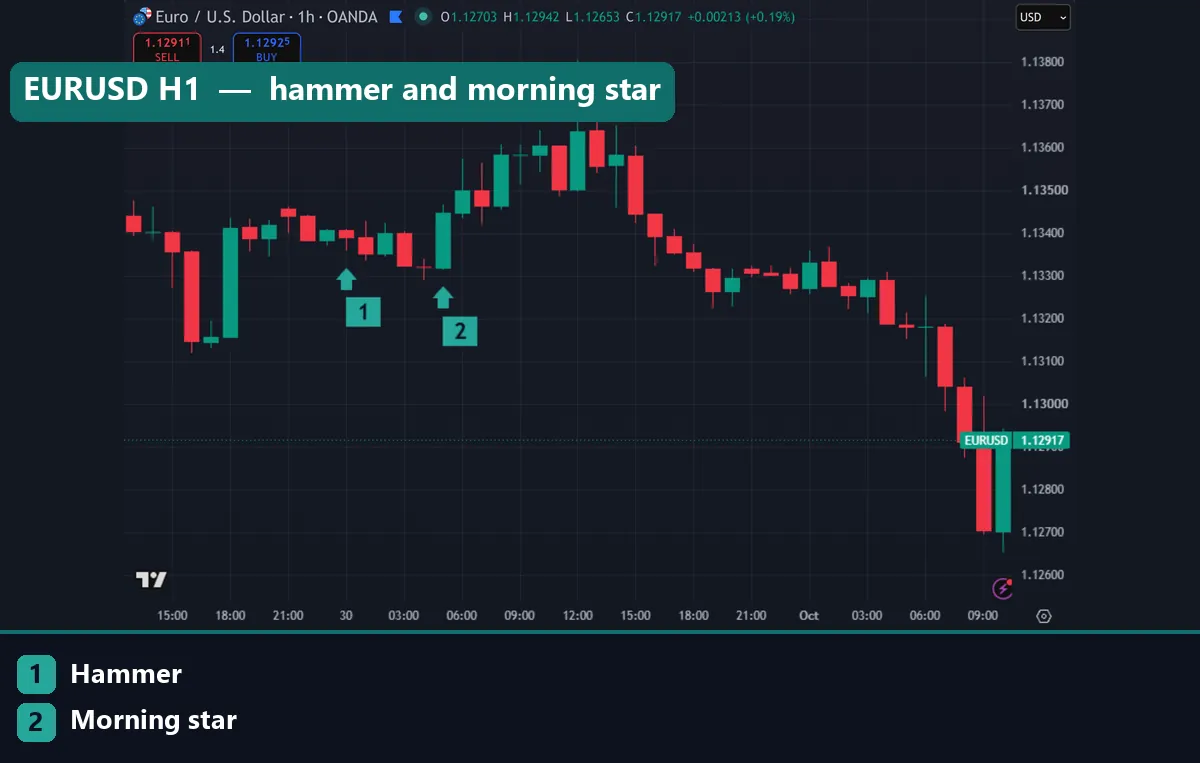
Price rose for a few hours after the morning star, then rolled over. By the evening it was below the hammer’s low. The hammer candlestick guide and the morning star pattern page explain both shapes step by step.
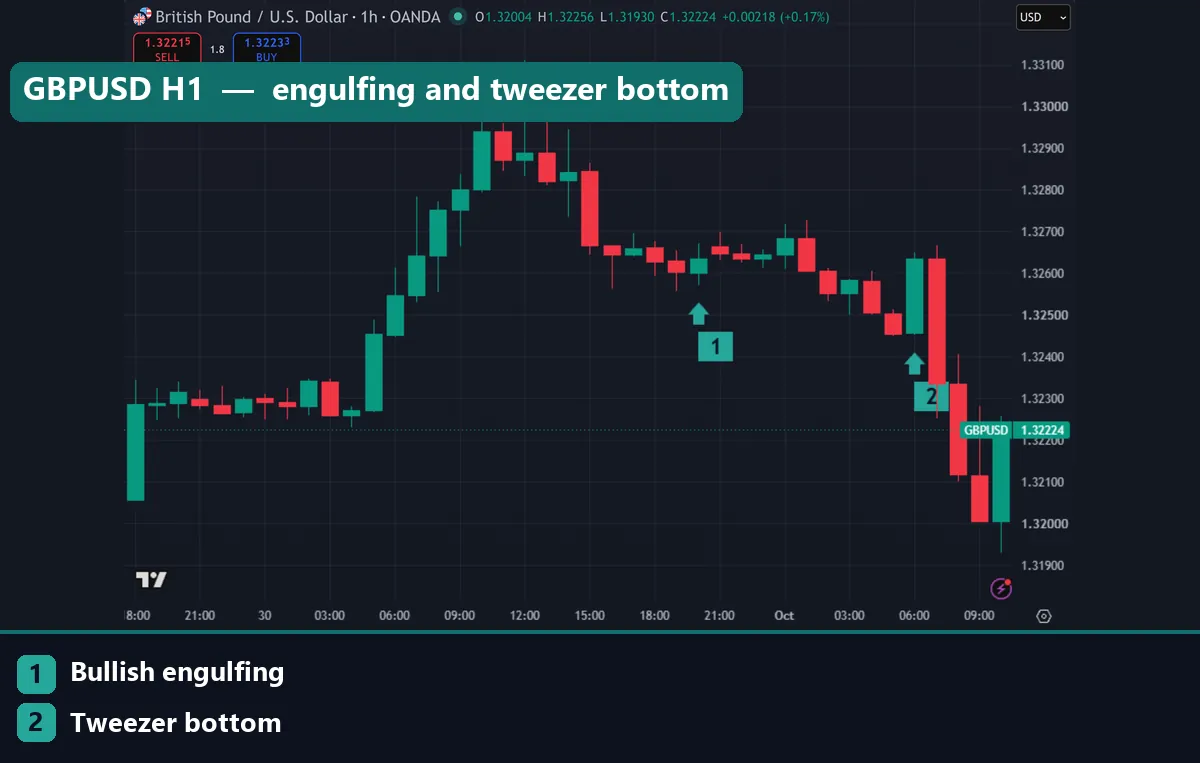
Image 5 shows GBPUSD on the 1-hour chart. A bullish engulfing completed at 20:00 UTC on 30 September (1.32602 to 1.32636). Then a tweezer bottom closed at 1.32634 at 06:00 UTC on 1 October. The very next hour printed a large bearish candle, and price fell toward 1.3200.
Our 15-minute statistics agree with what these charts suggest. Over 85,399 bars, the bullish engulfing closed higher 4 bars later only 49.0% of the time, against a 50.4% base. The morning star managed 48.4%. The hammer did best at 52.6% after 4 bars, about two points over the base.
Download the complete indicator database
Put these concepts on your charts. One email unlocks the full library of 1,380+ indicators with compiled MT4 and MT5 files, plus my TradingView scripts. No paywall, no spam, unsubscribe any time.
Get free access to my indicator database
One email unlocks 1,380+ free MT4, MT5 and TradingView indicators — the complete library. No single-tool download; you get the whole database.
Where it fails
A single bullish candle fails as a signal most of the time, because roughly half of all candles are bullish and the next bar is close to a coin flip. Every bullish pattern we tested landed within a few points of the 51.0% one-day base rate.
Patterns fail hardest in strong trends. Image 7 shows a bullish engulfing on EURUSD on 3 September 2026. It opened at 1.15874 and closed at 1.16256, a 38-pip body covering a near-doji. Five days later, on 10 September, EURUSD closed at 1.16100, lower than the signal close. A week after that, the pair was in a steep decline.
Definitions drift too: change the engulfing tolerance or the decline length, and the counts move a lot. Our sample also has limits. The daily data covers 2018 to 2026 on one broker’s feed. The 15-minute data covers just over a year. A different period could shift each figure by a point or two, which is the size of the edges we found. For more, read do candlestick patterns work.
Two more charts where the bullish signal faded
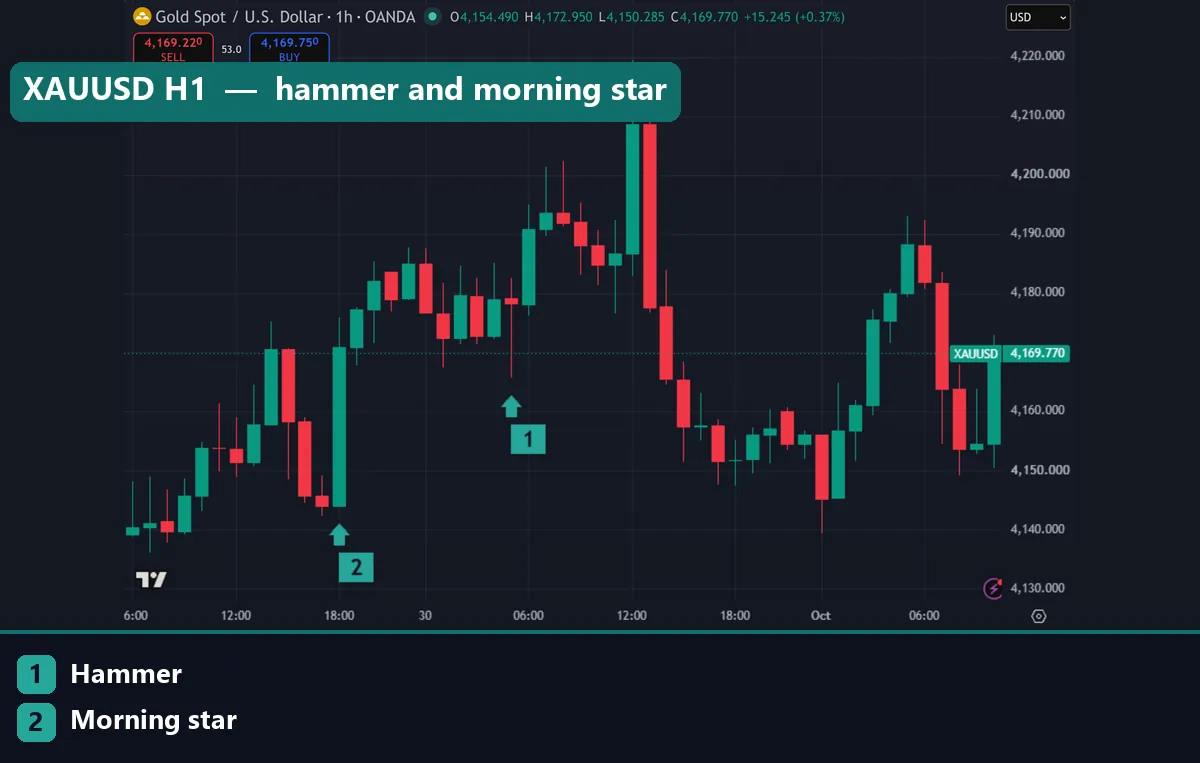
Image 6 shows gold on the 1-hour chart. A morning star completed at 18:00 UTC on 29 September 2026, with a bullish candle from 4,144.035 to 4,170.875. Next, a hammer printed at 05:00 UTC on 30 September: open 4,179.035, low 4,165.69, close 4,178.19. Gold did rally to about 4,210 by midday. But by the afternoon it had given back the gain and traded below the hammer’s low.
That is a fair picture of our results: some upside, then a fade.
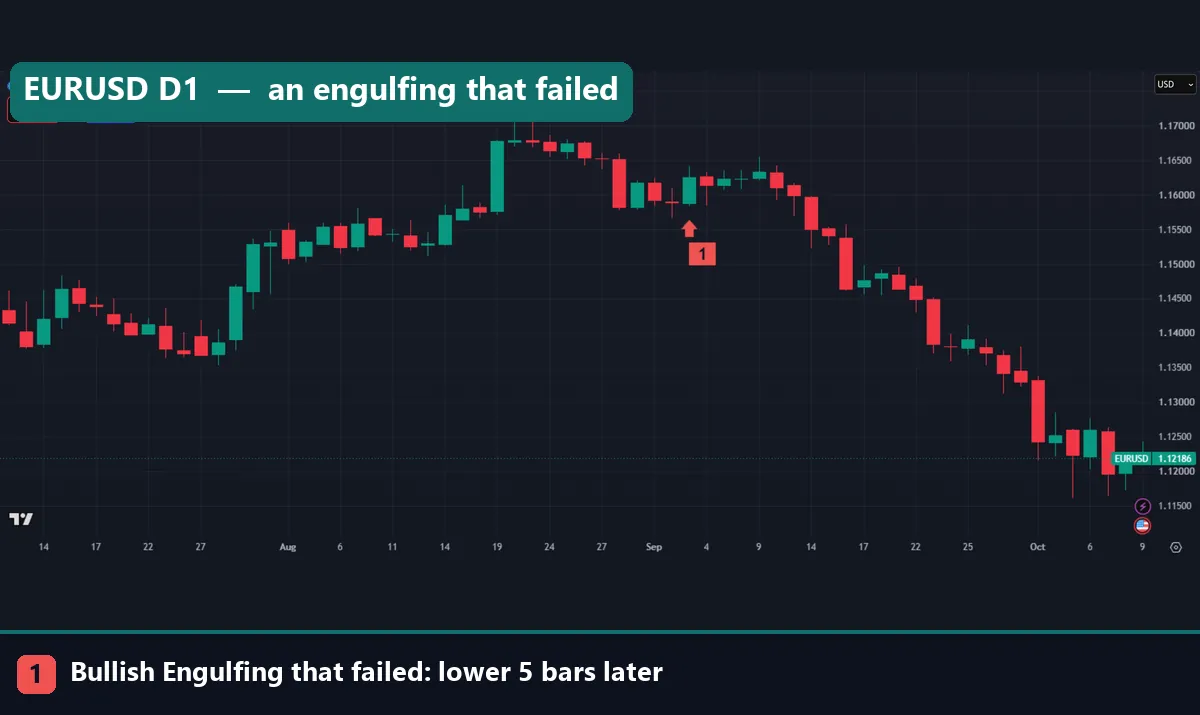
Image 7 is the failed EURUSD engulfing described above. It is a clean green body after a small doji, right where many traders would call a bottom. The candle looked right on the day it closed and was wrong for the month.
Common mistakes with bullish candles
- Treating colour as a signal. Between 52.4% and 61.8% of daily candles closed bullish on the pairs we measured. A green candle is the normal state of the chart, so it cannot carry a trade on its own.
- Ignoring the base rate. A pattern that “works 52% of the time” sounds useful until you learn any candle did 51.6%.
- Trusting big bodies. The bullish marubozu looks like conviction. Yet in our sample it trailed the base rate at 3 and 5 days.
- Skipping location. Our better results came from patterns that require a prior decline, such as the tweezer bottom and morning star. A pattern at a tested level carries more information than one in open space. See candlestick patterns at support and resistance for that approach.
Where to go next
If you want the theory behind each shape, start with candlestick patterns explained. Then compare our counts with the candlestick charts section of StockCharts ChartSchool and the candlestick pattern article on Wikipedia. For a forex-focused definition of the engulfing shape, see the bullish engulfing entry at BabyPips.
Our candlestick pattern detector indicator marks common shapes on MT4 and MT5. The engulfing candle alert indicator and the morning star and evening star indicator each focus on one pattern. Treat their marks as prompts to check context, not as entries. The MT4 and MT5 installation guide takes a few minutes.
FAQ
What makes a candlestick bullish?
A candle is bullish when it closes above its open. Size and wicks do not change that.
Is a bullish candle a buy signal?
No, not by itself. In our daily data the base rate for a higher close 5 days later was 51.6%.
Which bullish pattern did best in your test?
On daily FX charts, the tweezer bottom closed higher 53.5% of the time after 5 bars, and the morning star reached 54.4%. Both beat the 51.6% base rate, but only by a few points.
Does a bullish engulfing candle work?
In our sample of 4,111 daily cases it closed higher 51.6% of the time after 5 bars, exactly the 51.6% base rate.
Why did the bullish marubozu do worse than average?
We can describe the result, not prove the cause. One plausible reason is that a large one-day burst often exhausts short-term buying, so the next days pause or retrace. Its median 5-day move was -0.046 ATR.
Are bullish patterns better on lower timeframes?
No. On 15-minute charts the bullish engulfing closed higher 49.0% of the time after 4 bars, below the 50.4% base. You get more patterns intraday, not stronger ones.
How should I use a bullish candlestick, then?
Use it as one input. Check where it formed, the higher-timeframe trend, and where your stop would sit.
Can these statistics change?
Yes. They come from one broker’s history over a set period and would shift with other data, other rules or other markets, so size every trade for being wrong; results are not guaranteed; past performance is not indicative of future results.
Last updated: 1 October 2026.

About the author
Written by Dominic Walsh, a Forex trader and MT4/MT5 indicator, Expert Advisor and script developer. Every tool on forexmt4systems.com is tested on live charts before release and ships with ready-to-use compiled MT4 (.ex4) and MT5 (.ex5) files. Learn more about the trader and developer behind this site.
How we build, test and correct every tool: Editorial & Testing Policy. Trading carries risk; see the disclaimer.