
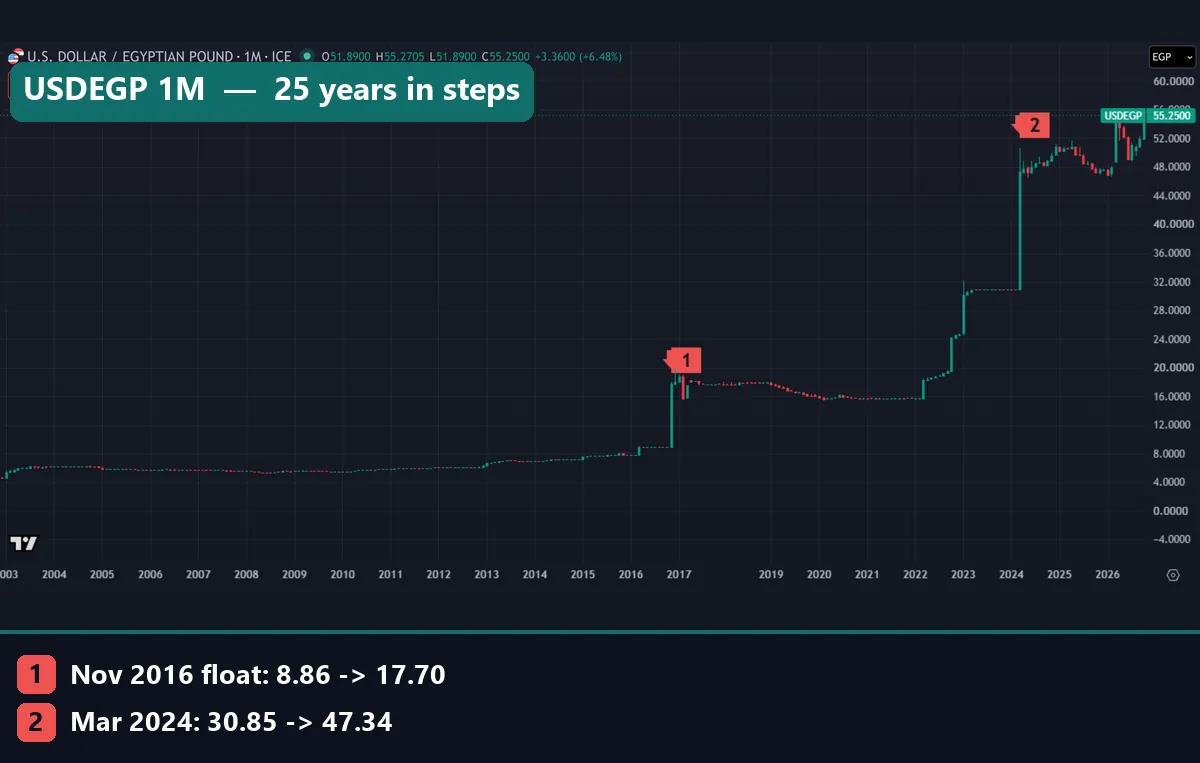
The Egyptian pound (EGP) has lost 92.3% of its value against the US dollar since October 2001. Back then, one dollar bought 4.24 pounds; on 23 October 2026 it bought 55.25. This guide settles three questions with our own data: what the pound is, why its chart rises in sudden steps instead of smooth trends, and what a devaluation does to money held in pounds.
What the Egyptian pound is
The Egyptian pound is the national currency of Egypt. Its central bank, the Central Bank of Egypt (CBE), sets interest rates and runs the exchange-rate regime. Markets know the pound by its code, EGP, and ISO’s page on ISO 4217 currency codes explains the rule behind it: the first two letters match the country code, and the third, where possible, is the first letter of the currency name. So EG stands for Egypt and P for pound.
Prices come as pounds per US dollar, so the symbol reads USDEGP. A rising line means a weaker pound, because each dollar buys more pounds. To get the pound’s own value, divide 1 by the quote. At 55.25, one pound was worth about 1.81 US cents. Our African currencies guide sets the pound beside its neighbours on the continent.
How the Egyptian pound exchange rate works
For years Egypt held the pound on a peg. A World Bank program document on Egypt dated 29 November 2016 says the central bank rationed access to foreign currency through its auctions under that peg. Shortages grew, and so did a parallel market. Then, on 3 November 2016, the CBE abandoned its currency peg and moved to a market-determined exchange rate, the same document says. It also raised its key interest rates by 300 basis points.
Since then the pound has behaved like a managed float on our charts. The rate can sit almost still for a year, then reset in one move. A step like that is a devaluation: the pound buys fewer dollars from one day to the next. Our guide on whether central banks trade forex covers why a bank steps into its own market.
Three formulas turn a quote into a change you can compare:
value of one pound (USD)  = 1 / USDEGP
rise in the quote (%)     = (new quote / old quote - 1) x 100
change in pound value (%) = (old quote / new quote - 1) x 100
The two percentages differ, and the gap grows with the size of the move. In November 2016 the quote rose 99.8%, from 8.86 to 17.70. Yet the pound’s value fell 50.0%: it halved. A currency can never lose more than 100% of its value, while its quote can rise without limit.
How we tested
We read FX_IDC exchange-rate data (ICE) for USDEGP on the TradingView web chart and pulled it on 23 October 2026. The monthly series runs from October 2001 to October 2026. Our weekly capture starts in mid-2021, and the daily data covers roughly the past year.
Next, we flagged every month in which the close sat 8% or more above the previous month’s close, and we ran the same rule on weekly closes. For each step we noted the old rate, the new rate and the change in the pound’s value. The two data charts below are our own drawings of these numbers.
Our MetaTrader 4 history (Capital Point Trading, build 1471) holds 23 FX pairs, and none of them includes the Egyptian pound. So MT4 played no part here. These are quoted rates, not bank counter prices or parallel-market prices. We placed no trades, so no spread, swap or commission applies. Our editorial testing policy sets out how we collect and report data like this.
Measurement settings
| Setting | What we used |
|---|---|
| Data source | FX_IDC (ICE) on the TradingView web chart |
| Symbol | USDEGP: Egyptian pounds per 1 US dollar |
| Monthly window | October 2001 to October 2026 |
| Weekly window | Mid-2021 to October 2026 |
| Daily window | About the last 300 daily bars, to 23 October 2026 |
| Jump rule | Close 8% or more above the previous close |
| Value of one pound | 1 / USDEGP, shown in US cents on our line chart |
| Daily range | High minus low as a share of price, median of the window |
| Data pulled | 23 October 2026 |
| Costs | None modelled; no trades placed |
The 8% line is our choice. It keeps the large steps and drops the slow drift between them. A lower line could add months but would blur the pattern.
Reading the 2016 float on the chart
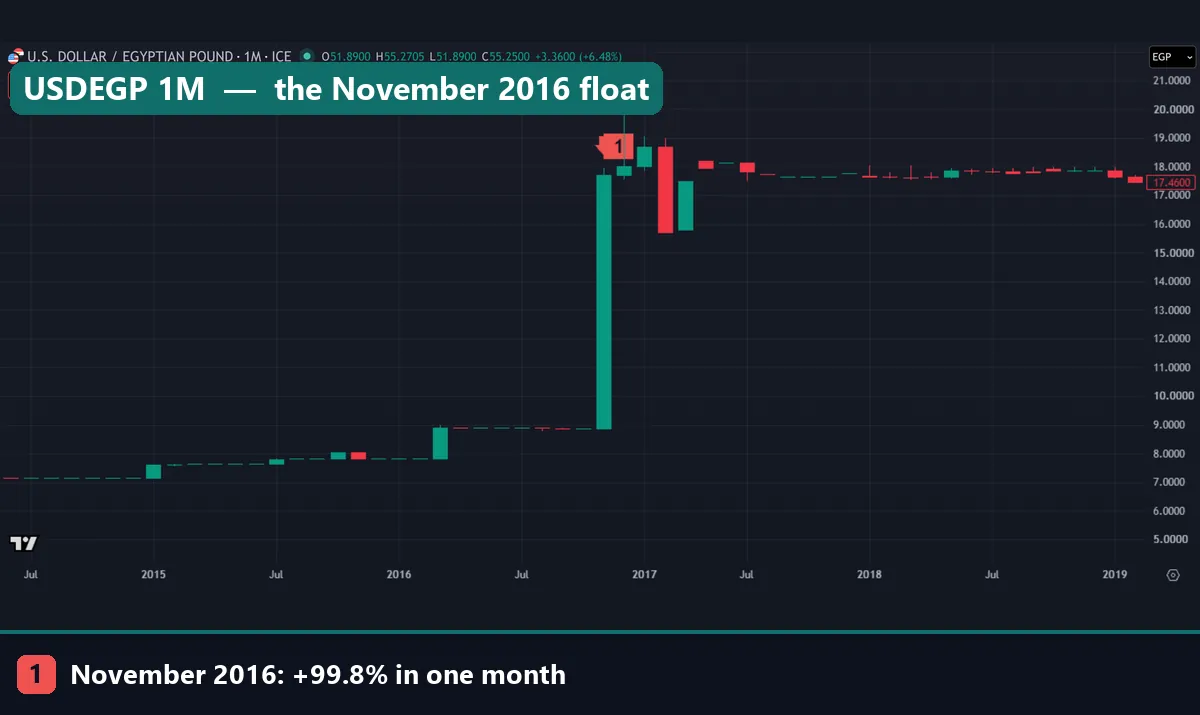
This zoom runs from mid-2014 to early 2019, and it shows how a peg breaks. At first the line barely moves. Then come small steps in 2015 and a bigger one in March 2016, when the quote rose 13.4%, from 7.83 to 8.88. The World Bank document calls that one the March 2016 devaluation of the official exchange rate.
After March the line goes flat again, near 8.88, for several months. Then marker 1 arrives. In November 2016 a single monthly bar carries the quote from 8.86 to 17.70, a rise of 99.8%. That is the biggest month in our 25 years of data.
What follows matters too. The quote swings both ways for a few months, with an intramonth high near 20. Next it drops back to 15.70 in February 2017, before March takes it to 17.50, up 11.5%. After that, the line settles between 17 and 18 through 2018. So a float does not move in one direction only. Still, the pound never came close to its old level of 8.86.
Reading the weekly chart since 2021
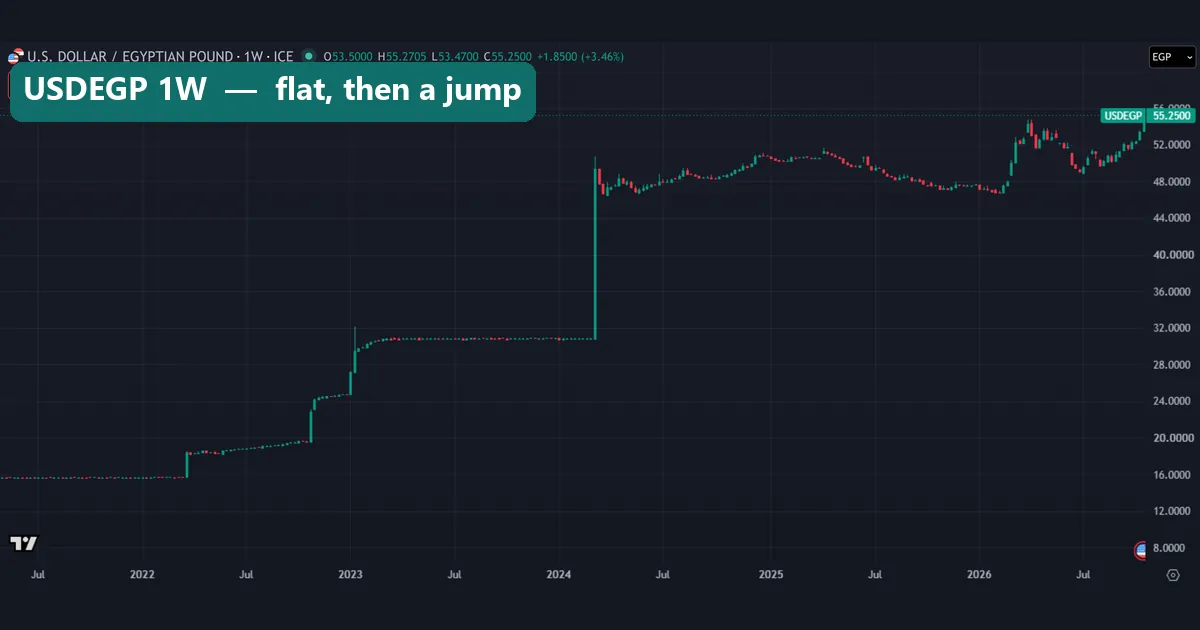
The weekly chart shows the same pattern four times. Until March 2022 the quote sits flat near 15.7. In the week of 21 March 2022 it jumps 17.7%, from 15.68 to 18.45, and then creeps higher. The week of 24 October 2022 adds 17.1%, from 19.52 to 22.85. Two January 2023 weeks add 10.0% and 8.7%, taking the rate from 24.69 to 29.50.
After that, the line stays flat near 30.85 for more than a year. The week of 4 March 2024 ends the calm with the largest bar in our weekly data: 30.85 to 49.35, up 60.0%. That week holds 6 March 2024, the date of the CBE’s special MPC press release of 6 March 2024. In it, the bank said it would keep inflation as its anchor and let market forces set the exchange rate. It also raised its overnight deposit rate by 600 basis points, to 27.25%.
Since then the weekly candles trade both ways, roughly between 46.5 and 55. That two-way movement is new. Before 2024, almost every move on this chart went up.
Worked example: 1,000 Egyptian pounds in dollars
Take 1,000 pounds held as cash from October 2001 to October 2026. At the first rate of 4.243, they were worth 235.68 dollars. At 55.25, the same notes buy 18.10 dollars.
Now run the quote formula on the same dates. The rate went from 4.243 to 55.25, so it grew 13.02 times. That is a rise of about 1,202%. Yet the loss in value is 92.3%, because value uses the inverse. So always check which of the two numbers a headline reports.
The March 2024 step shows the same gap on a smaller scale. Before it, at 30.85, 1,000 pounds were worth 32.41 dollars. At the month’s close of 47.34, they were worth 21.12 dollars. The quote rose 53.5%, but the pound lost 34.8% of its dollar value in one month.
Last, the past year. Our data puts the 1-year value change at -14.0%, so the rate a year ago sat near 47.5. Back then 1,000 pounds bought about 21 dollars; now they buy 18.10. You can repeat these sums for any amount with our currency converter.
Nine months that did most of the damage
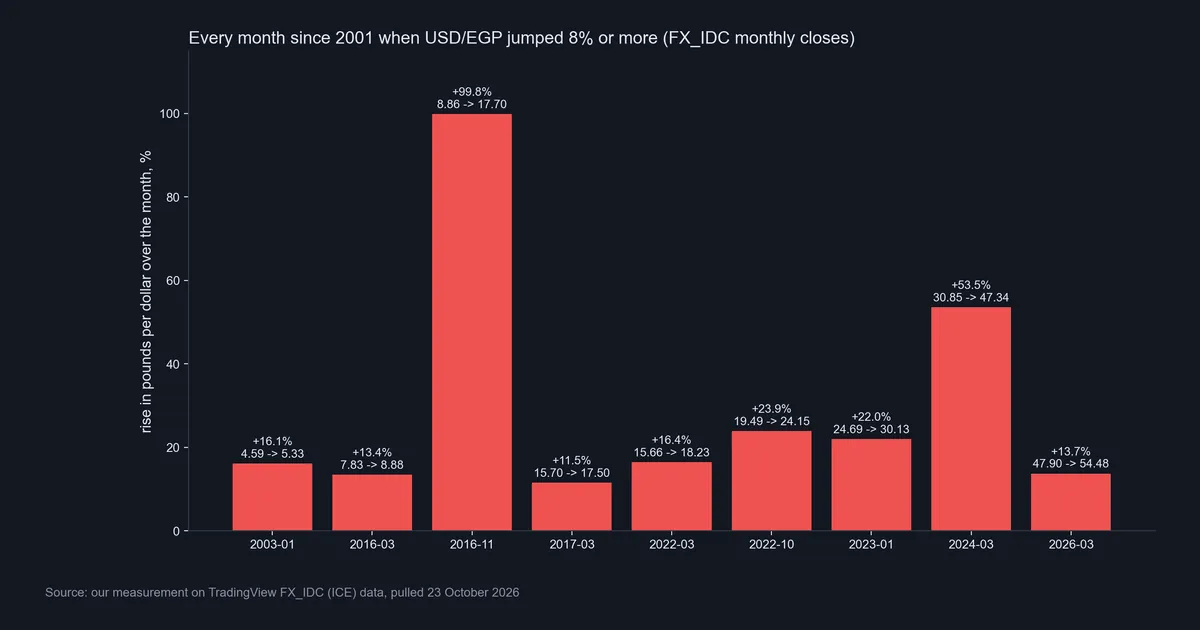
Our first data chart shows every month since 2001 in which USDEGP closed 8% or more above the month before. There are nine. November 2016 leads at +99.8%, then March 2024 at +53.5%. The other seven range from +11.5% to +23.9%, from January 2003 to March 2026.
Multiply the nine steps together and the quote grows about 9.0 times. Over the whole period it grew 13.0 times. So all the other months combined added only about 45%. In short, the long fall happened mostly in nine bars, with gaps of a few months to more than 13 years between them.
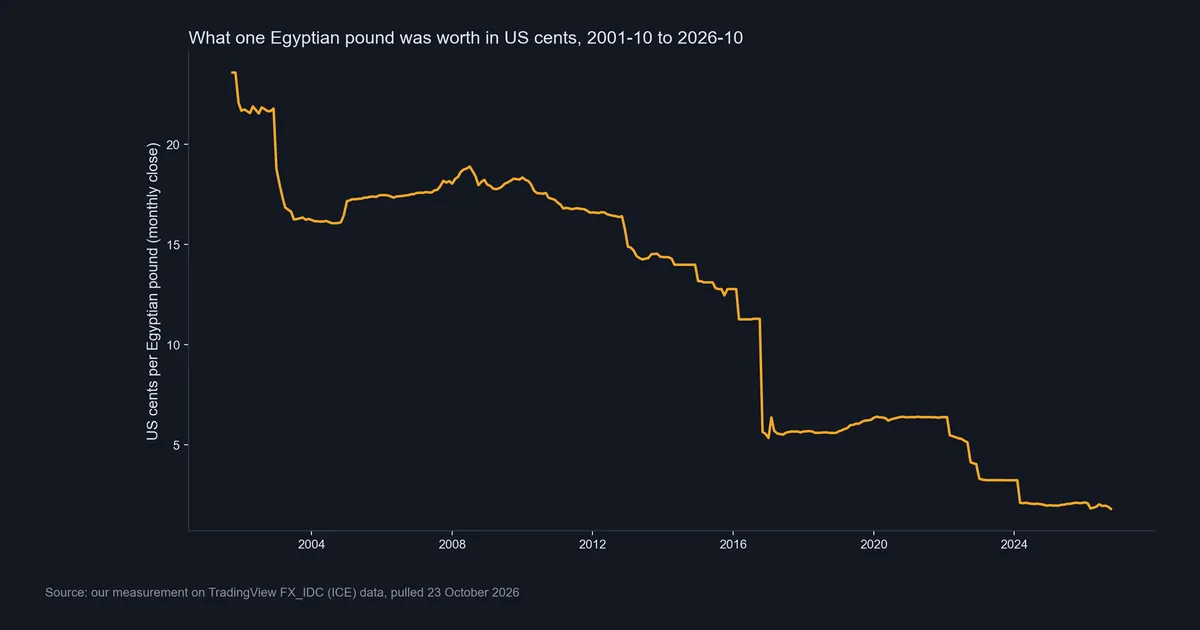
The second chart shows the pound’s value in US cents: near 23.6 in October 2001, near 1.8 now. From about 2005 to 2008 the line rose, so the pound did gain at times. Still, no climb came close to undoing the step before it. Our weakest currency in the world rankings judge currencies the same way, by the value they lose.
Download the complete indicator database
Put these concepts on your charts. One email unlocks the full library of 1,380+ indicators with compiled MT4 and MT5 files, plus my TradingView scripts. No paywall, no spam, unsubscribe any time.
Get free access to my indicator database
One email unlocks 1,380+ free MT4, MT5 and TradingView indicators — the complete library. No single-tool download; you get the whole database.
Where it fails
First, a quoted rate is one price, not the price everyone gets. The CBE’s March 2024 release said foreign exchange shortages had led to a parallel market. So during the flat stretch at 30.85, a second rate existed outside the official quote. Our data cannot see it.
Second, calm numbers can hide big risk. Over the last 300 daily bars, the median day’s range was only 0.354% of price, below the 0.49% we measured on EUR/USD over a similar window. Yet the pound has moved 60.0% in one week. Range tools, like those behind our list of volatile forex pairs, read a step currency as quiet right up to the step.
Third, monthly closes hide what happens inside the month. The March 2024 week rose 60.0%, but the month closed only 53.5% higher, because the pound won some ground back. Fourth, the dollar is one yardstick. The pound’s fall against it is not the same thing as Egyptian inflation, though the two are linked, as our guide on how inflation affects forex explains.
Finally, high local interest rates do not shield a holder from a step. The CBE’s overnight deposit rate reached 27.25% in March 2024, yet that month cost the pound 34.8% of its dollar value. That is the classic way a carry trade breaks. And nothing in our data predicts when the next step comes.
The Egyptian pound since October 2025
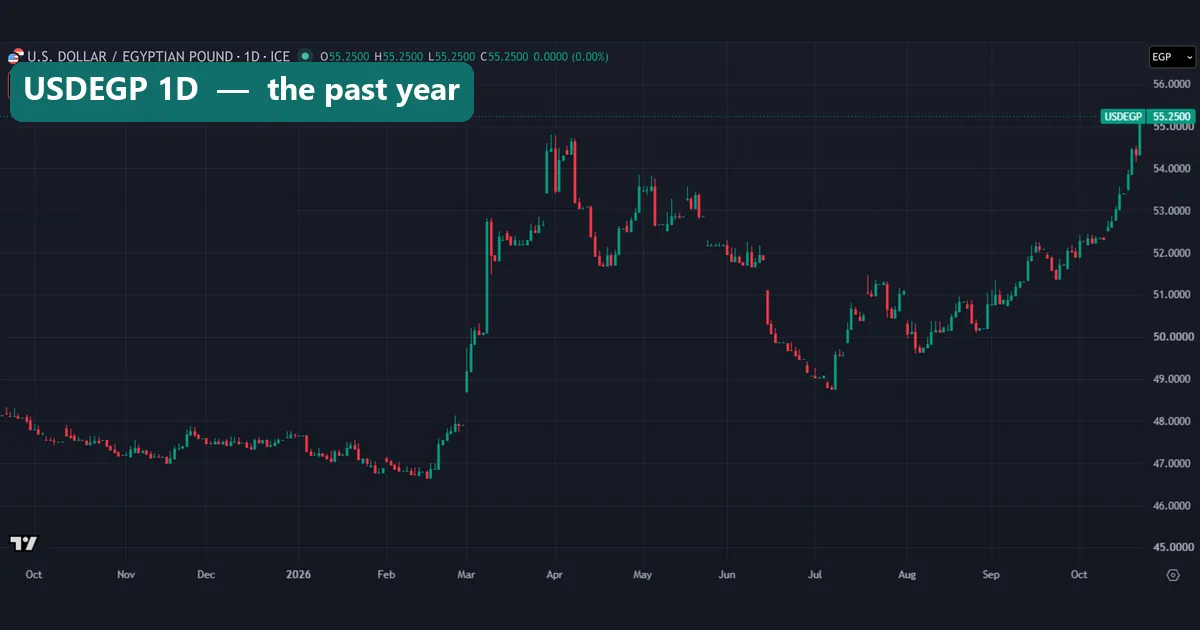
The daily chart covers the past year, and it looks very different from the 2024 step. From October 2025 to February 2026, the quote drifted down from about 48 to about 46.7, so the pound gained a little. Then, from late February, a run of wide green bars lifted it to about 53 by mid-March. The month of March closed 13.7% higher, from 47.90 to 54.48.
That rise took about four weeks of daily bars, not one. After it, the quote peaked near 54.8 in early April, then fell back to about 48.8 by early July, which was the pound gaining ground. From there it climbed to 55.25 on 23 October 2026. Over the past year, one pound lost 14.0% of its dollar value, with real moves both ways. Our data shows what happened in 2026, not why.
What a devaluation does: the 2022 to 2024 steps
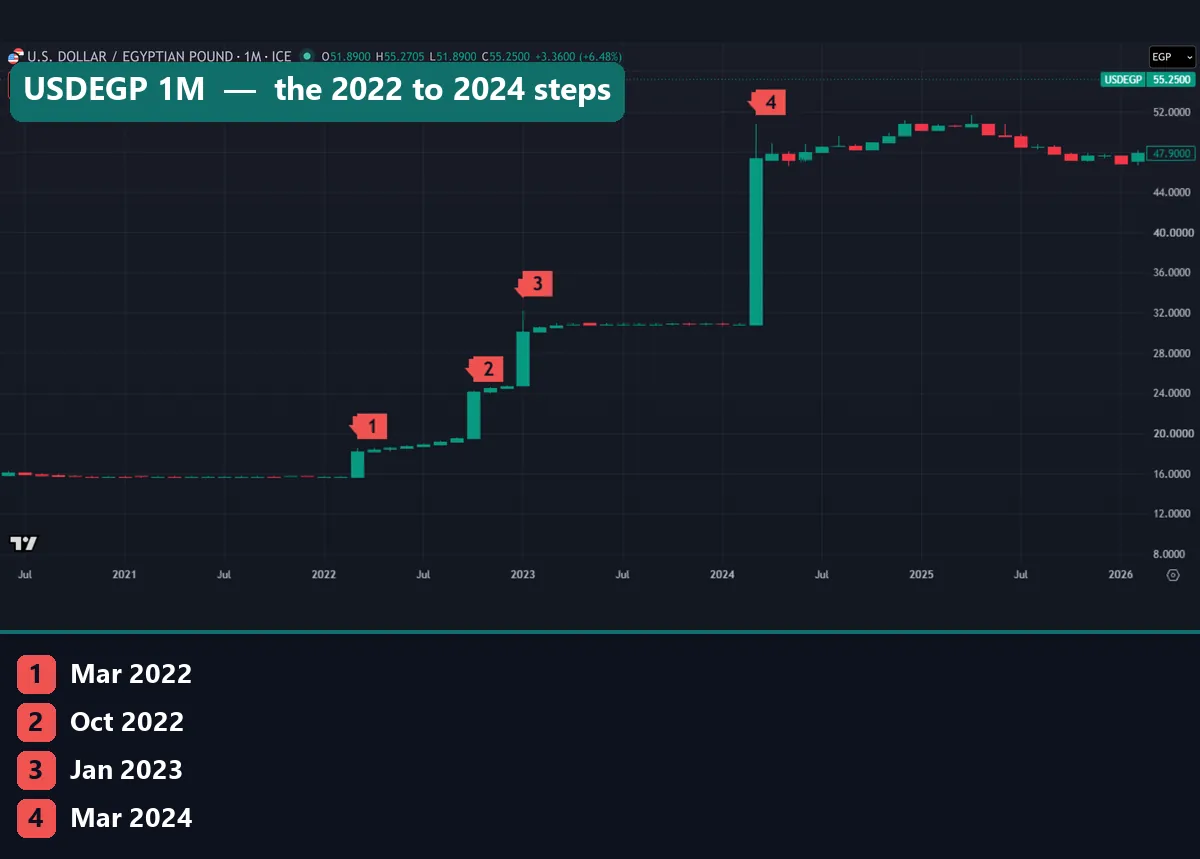
This monthly zoom marks the four steps of 2022 to 2024. Marker 1 is March 2022: +16.4%, from 15.66 to 18.23. October 2022 comes next at marker 2, with +23.9% from 19.49 to 24.15. Then marker 3, January 2023, adds 22.0%, from 24.69 to 30.13. Marker 4 is March 2024: +53.5%, from 30.85 to 47.34. From the February 2022 close to the March 2024 close, the quote roughly tripled, and one pound lost 66.9% of its dollar value.
So what does a step like this do? Anything priced in dollars, such as imported goods, costs more pounds the next day. Debts owed in dollars grow in pound terms, and savings held in pounds buy fewer dollars. On the other side, Egyptian goods and holidays get cheaper for foreign buyers.
In both of its biggest steps, the CBE paired the move with higher rates: 300 basis points in November 2016 and 600 in March 2024. Higher rates aim to slow the inflation that tends to follow. Our guides on central bank rate decisions and how interest rates affect forex cover that link. For a trader, a step also means gaps: a stop cannot fill at a price the market skipped, and spreads can widen, as our page on why spreads widen shows.
Common mistakes with Egyptian pound data
Mistake 1: reading the quote upside down. USDEGP rising means the pound is falling. A chart that climbs from 4.24 to 55.25 tells a story of decline, not growth.
Mistake 2: mixing up the two percentages. November 2016 was a 99.8% rise in the quote but a 50.0% loss in value. Quote one without the other and the size of the move gets distorted.
Mistake 3: treating a flat line as safe. The rate sat near 30.85 for more than a year, then moved 60.0% in one week. A flat managed rate stores up pressure; it does not remove it.
Mistake 4: expecting a big fall to reverse. The pound did win ground back at times, in early 2017 and in mid-2026. Yet after November 2016 it never came near 8.86 again, and after March 2024 it never returned to 30.85. A low unit value is a separate trap, and our guide to the most valuable currency in the world explains why units per dollar say little about strength.
Where to go next
To check the live quote, open the FX_IDC USD/EGP symbol page on TradingView. It shows the same ICE data we used here. For the dollar side of the quote, read our dollar index guide.
If you are new to trading, start with the major currency pairs before you look at an exotic one like USDEGP. Then read about swap in forex, since overnight costs matter most on pairs with large rate gaps.
FAQ about the Egyptian pound
What is the currency code for the Egyptian pound?
EGP. Under the ISO 4217 rule, EG is the country code for Egypt and P stands for pound. Charts quote it as USDEGP, the number of pounds one US dollar buys.
Who manages the Egyptian pound?
The Central Bank of Egypt. It ended its currency peg on 3 November 2016, according to the World Bank. In March 2024 it said market forces would set the rate while it keeps inflation as its anchor.
How much is one Egyptian pound worth in US dollars?
On 23 October 2026, one dollar bought 55.25 pounds on FX_IDC. So one pound was worth about 1.81 US cents, and 1,000 pounds about 18.10 dollars.
Why does the Egyptian pound fall in steps?
Because the central bank manages the rate. It can stay almost flat for months while pressure builds, as it did before the 2016 and 2024 steps, when a parallel market grew beside it. When the bank lets go, much of the change can land in a single month.
How much value has the Egyptian pound lost since 2001?
About 92.3% against the US dollar. One dollar bought 4.24 pounds in October 2001 and 55.25 in October 2026, so the quote rose about 13 times.
What was the Egyptian pound’s biggest one-month fall?
November 2016. The quote rose 99.8% that month, from 8.86 to 17.70, so the pound lost half its dollar value. The second biggest was March 2024, when the quote rose 53.5%.
Can I trade the Egyptian pound on MT4 or MT5?
That depends on the broker. Our own MT4 history of 23 pairs has no EGP pair. Where USDEGP exists, check the spread and the overnight swap first, because both can be large on an exotic pair.
Will the Egyptian pound recover?
Our data cannot say. The pound won back ground in early 2017 and in mid-2026, but neither move undid the step before it. Nothing here is a forecast, and results are not guaranteed; past performance is not indicative of future results.
Last updated: 23 October 2026.

About the author
Written by Dominic Walsh, a Forex trader and MT4/MT5 indicator, Expert Advisor and script developer. Every tool on forexmt4systems.com is tested on live charts before release and ships with ready-to-use compiled MT4 (.ex4) and MT5 (.ex5) files. Learn more about the trader and developer behind this site.
How we build, test and correct every tool: Editorial & Testing Policy. Trading carries risk; see the disclaimer.