
The weakest currency in the world, measured by how many units one US dollar buys, was the Iranian rial in our data: 1 USD = 1,800,165 IRR at the quoted rate on 14 October 2026. But “weakest” has a second meaning, the currency that lost the most value, and that ranking looks different. This guide settles both rankings across 33 currencies. It also shows why redenominations and quote changes bend the numbers, and why a big number per dollar does not make a currency bad.
What the weakest currency in the world actually means
People use the phrase in two ways. The first is value per unit: how many US dollars one unit is worth. On that measure, one rial is worth about 0.00000056 USD. At the other end, one Kuwaiti dinar was worth 3.2457 USD on the same data.
The second meaning is loss of value. Which currency fell the most against the dollar over a set period? That question is about the economy behind the money, not the size of the unit.
Value per unit mostly reflects history. A country that went through high inflation in the past, and never removed the zeros, still counts in thousands. So the Vietnamese dong sits third on our value list at 25,894 per dollar, yet its value rose 1.6% over the past year. The fall in value says more about recent trouble, and there the bolivar, the rial and the Argentine peso lead.
How the two measures work
Most of these currencies trade as units per US dollar, so the symbol starts with USD. USDIRR shows how many rials one dollar buys. When that quote rises, the rial falls. Read it the wrong way round and every conclusion flips. The pound and the euro work the other way (GBPUSD shows dollars per pound), so we invert those two.
Two formulas turn a quote into a ranking:
value of one unit (USD) = 1 / units per USD
value change = (units per USD then / units per USD now) - 1
The first gives the rial’s 0.00000056 USD. The second gives the fall in value. If a dollar buys more units today than five years ago, the ratio sits below 1 and the change is negative. We report falls in value, not rises in the quote, because a quote can rise far more than 100% while a currency cannot lose more than 100% of its value.
Both measures use the dollar as the yardstick, though. A currency can look weak partly because the dollar was strong, and our guide to the dollar index in forex covers that side of the ratio.
How we tested
We pulled weekly closes for 33 currencies from FX_IDC exchange-rate data (ICE) and read them on the TradingView web chart. The snapshot is the close of 14 October 2026, or 13 October 2026 for the Lebanese pound, the Myanmar kyat and the Kuwaiti dinar. Most series hold 300 weekly bars from 17 January 2021. The new Sierra Leonean leone only starts in July 2022.
From those closes we worked out units per dollar, the dollar value of one unit, and its change over one year and over about five years. Next, we captured five weekly charts on 15 October 2026: USDIRR, USDLBP, USDVES, USDTRY and USDLAK. The two bar charts are our own drawings of the same numbers. Our MetaTrader 4 history (Capital Point Trading, build 1471) only holds pairs built from the major currencies, so it played no part here.
The 33 currencies cover the usual candidates plus a few strong and pegged ones for contrast. A currency outside our list could rank lower. This is a measurement, not a trade or a forecast, and our editorial testing policy explains how we run and report these.
Measurement settings
| Setting | What we used |
|---|---|
| Data source | FX_IDC on TradingView (ICE exchange-rate data) |
| Quote | Units per 1 USD; GBP and EUR inverted |
| Snapshot | Weekly close of 13 or 14 October 2026 |
| Value of one unit | 1 / units per USD |
| Windows | Value change over 1 year and over about 5 years |
| History | Weekly bars from 17 January 2021 (SLE from July 2022) |
| Left out of the fall ranking | SYP (redenominated), SLE (no 5-year history) |
| Flagged | IRR (quote source change), LBP (official resets), VES (2021 redenomination) |
| Rate type | Quoted rates only; no parallel-market rates |
The flags matter most. Three of the top four fallers carry one, so read the fall ranking with the notes beside it.
Reading the charts: a quote switch and a reset peg
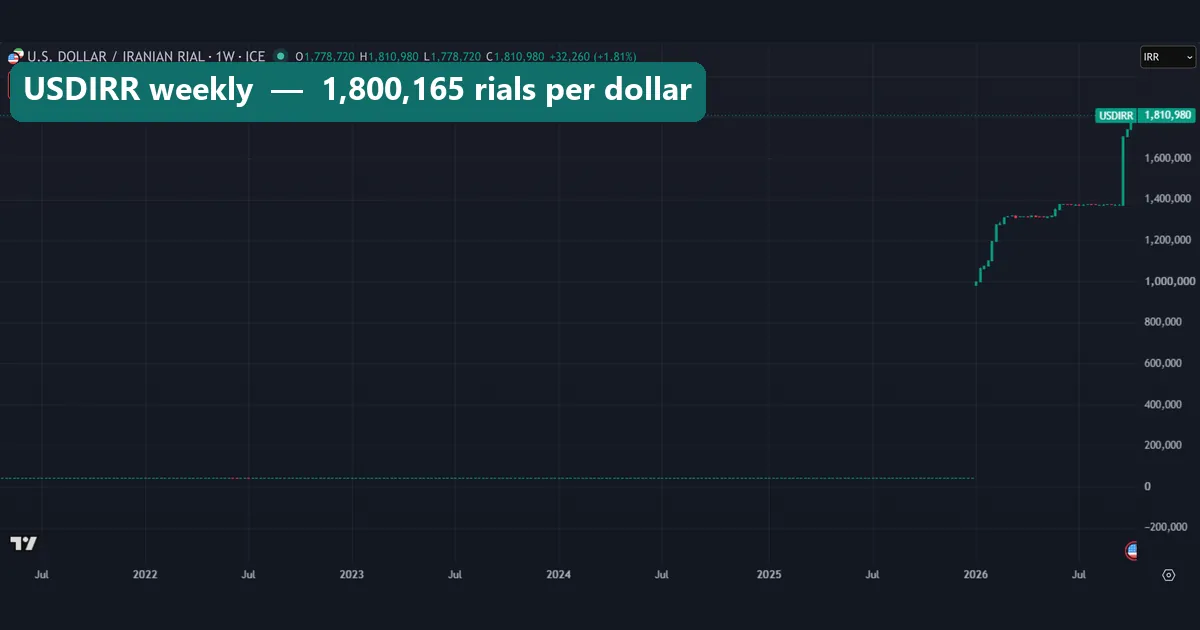
Start with the rial chart at the top of this page. For most of the window, USDIRR sits as a flat line near the bottom of the scale. Then, around the start of 2026, the series reappears near 1,000,000 and climbs in steps to 1,800,165. That is not one week of panic. FX_IDC moved from the official rate to a market rate inside our window, so the chart joins two different prices. Part of the change is a real fall and part is the new source, and the data cannot split them. The switch falls inside the last year and the old line was flat, so the 1-year and 5-year changes match at -97.7%.
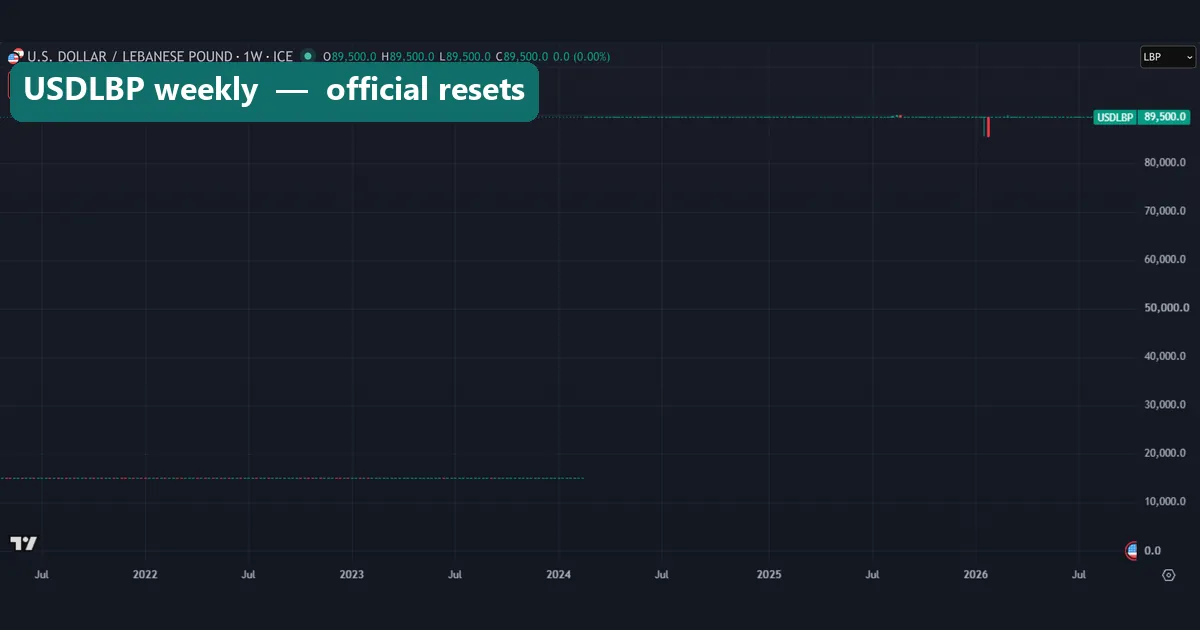
The Lebanese pound shows a different problem. Its official rate has been reset in steps, from 1,507 to 15,000 and then to 89,500. Our FX_IDC chart shows a flat line near 15,000, a jump to 89,500 in early 2024, and a flat line since. A flat line looks calm, but it only means the official quote did not change. So the 1-year change reads 0.0%, while the 5-year change is -83.2%.
Reading a redenomination: the Venezuelan bolivar
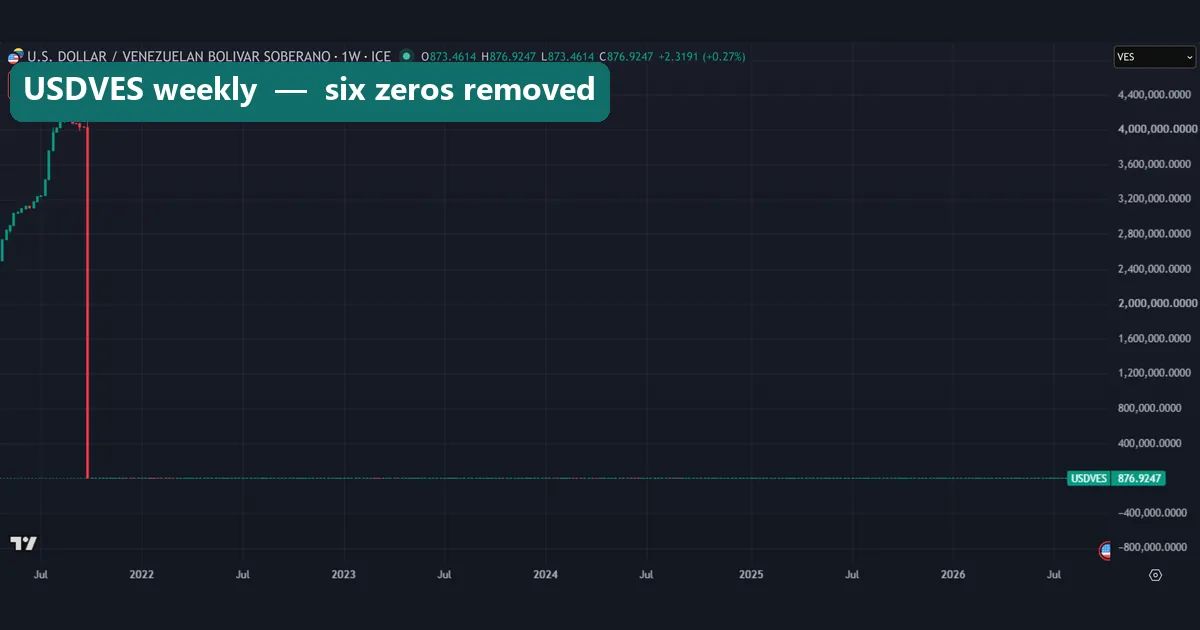
The bolivar chart looks like a rescue. At its left edge, USDVES climbs to about 4,000,000 per dollar. Then, in late 2021, one red bar drops almost to zero. Nothing improved that week. Venezuela redenominated in 2021 and removed six zeros, so the chart simply switched units.
After that bar, the line hugs the bottom of a scale built for millions. So the later climb to 876.92 per dollar is almost invisible, even though it is a large fall. Our 5-year change of -99.5% straddles the redenomination, so treat it as approximate. The 1-year change, -77.4%, sits fully after it.
The same trap applies to the Syrian pound, which dropped two zeros, and to the Sierra Leonean leone, where the new SLE replaced the old SLL in 2022. New codes like SLE appear in the ISO 4217 currency code list at ISO, and the redenomination article on Wikipedia lists more cases.
Worked example: the Argentine peso against the Paraguayan guarani
Here is the full method on two currencies with no data flag. First, read the quotes. On 14 October 2026, one dollar bought 1,513 Argentine pesos and 5,683.84 Paraguayan guaranis at the quoted rates.
Next, invert them. One peso was worth 0.00066094 USD, and one guarani 0.00017594 USD. So by value per unit, the guarani is the weaker one. You can run the same check with our currency converter.
Then compare with the past. Over about five years, the dollar value of a peso changed by -93.5%, so it now buys less than a tenth of the dollars it once did. Over the same window, the guarani’s value rose 21.4%. The 1-year gap is just as clear: the peso lost 10.0% while the guarani gained 23.1%.
So which is weaker? By units per dollar, the guarani. By loss of value, the peso, by a wide margin. The fall over time is closer to what people mean by a weak currency, because it usually tracks inflation and policy trouble. Our guide on how inflation affects forex explains that link.
Ranking 1: the lowest value per unit
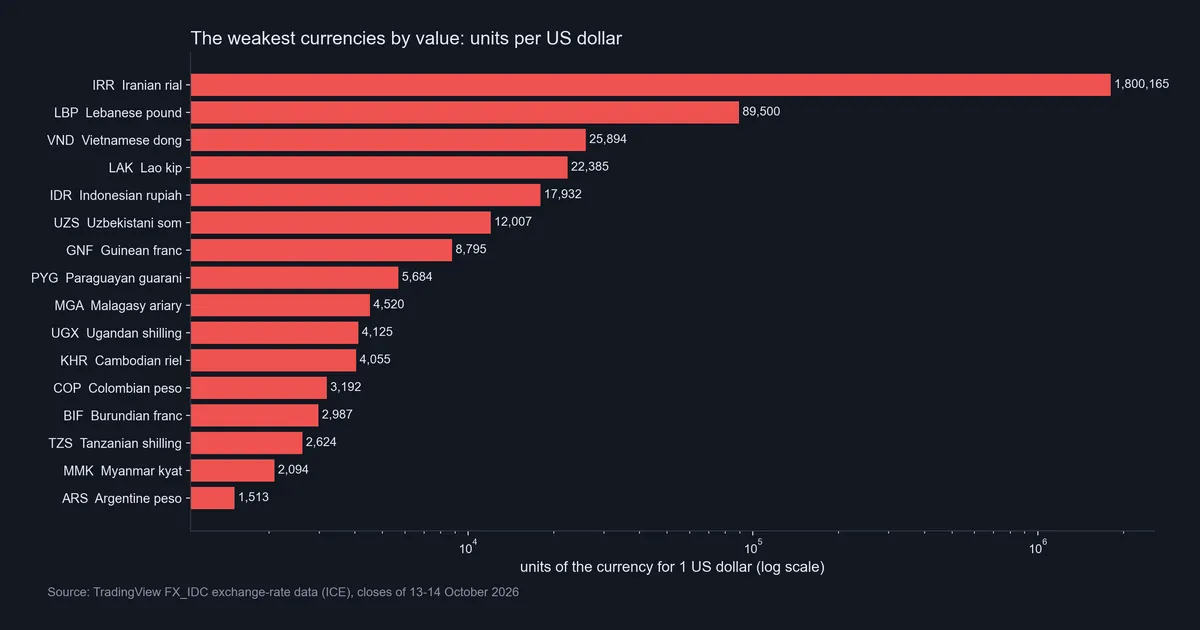
Our first data chart ranks currencies by units per US dollar on a log scale, so each step on the axis is ten times the last. Without it, the rial’s bar would squash the rest flat.
The rial leads by a wide margin at 1,800,165. The Lebanese pound follows at 89,500, then the Vietnamese dong at 25,894, the Lao kip at 22,385 and the Indonesian rupiah at 17,932. Next come the Uzbekistani som (12,007), the Guinean franc (8,795) and the Paraguayan guarani (5,684).
Now check the 5-year changes of some names here. The Guinean franc gained 9.7% in value. At 4,055 per dollar, the Cambodian riel moved +0.3%. Meanwhile the Colombian peso, at 3,192, gained 17.8%. These currencies count in thousands, yet they held or gained value. So a high count per dollar is a label from history, not a verdict on today.
Ranking 2: the biggest fall in value
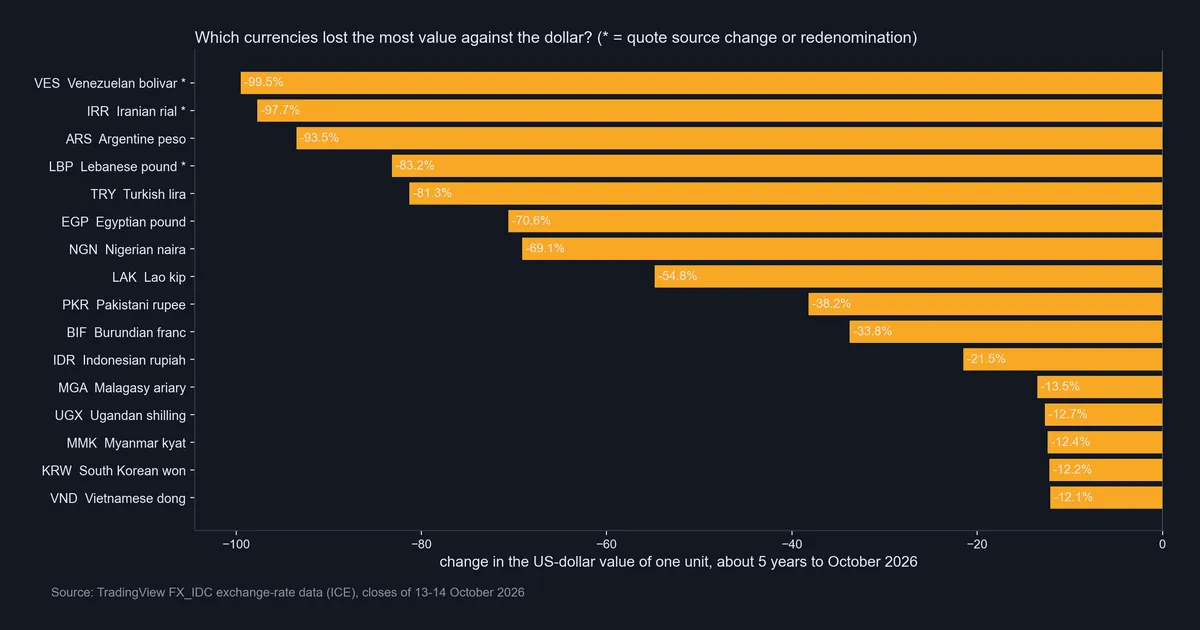
The second chart ranks the change in the dollar value of one unit over about five years. An asterisk marks a quote source change or a redenomination. The Venezuelan bolivar tops it at -99.5%, then the Iranian rial at -97.7% and the Argentine peso at -93.5%. The Lebanese pound (-83.2%), the Turkish lira (-81.3%), the Egyptian pound (-70.6%) and the Nigerian naira (-69.1%) follow.
Three of the top four carry an asterisk. So the biggest fall with no data caveat belongs to the Argentine peso. If you accept the caveats, the bolivar and the rial lead.
The 1-year view differs again. Leaving aside the rial and its quote switch, the bolivar lost 77.4%, the Ugandan shilling 16.4% and the lira 15.4%. Meanwhile the naira gained 9.9% and the Colombian peso 21.9%. Policy drives much of this, as our guides to central bank rate decisions and how interest rates affect forex show.
Download the complete indicator database
Put these concepts on your charts. One email unlocks the full library of 1,380+ indicators with compiled MT4 and MT5 files, plus my TradingView scripts. No paywall, no spam, unsubscribe any time.
Get free access to my indicator database
One email unlocks 1,380+ free MT4, MT5 and TradingView indicators — the complete library. No single-tool download; you get the whole database.
Where it fails
Quoted rates are not street rates. FX_IDC shows quoted rates. In countries with capital controls or official resets, people often deal at parallel or black-market rates that can differ a lot from the quoted figure. The World Bank’s official exchange rate series has the same limit, since it also tracks official rates.
Quote sources change. The rial series switched from an official rate to a market rate inside our window, and the pound moved through official resets. In both cases, part of the measured fall comes from a change of source, not from the market.
Units change. Redenominations break the series. That is why we dropped the Syrian pound and treat the bolivar’s 5-year figure as approximate.
The list is partial, and the dollar is the yardstick. We measured 33 currencies, not all of them. Also, a strong dollar makes many currencies look weaker at once.
It is one snapshot. These figures are quoted rates on 13-14 October 2026. Rates change daily, and some of these can jump in a single week, as the rial chart shows. Check a live quote before you rely on any figure here.
Slow falls on a chart: the Turkish lira and the Lao kip
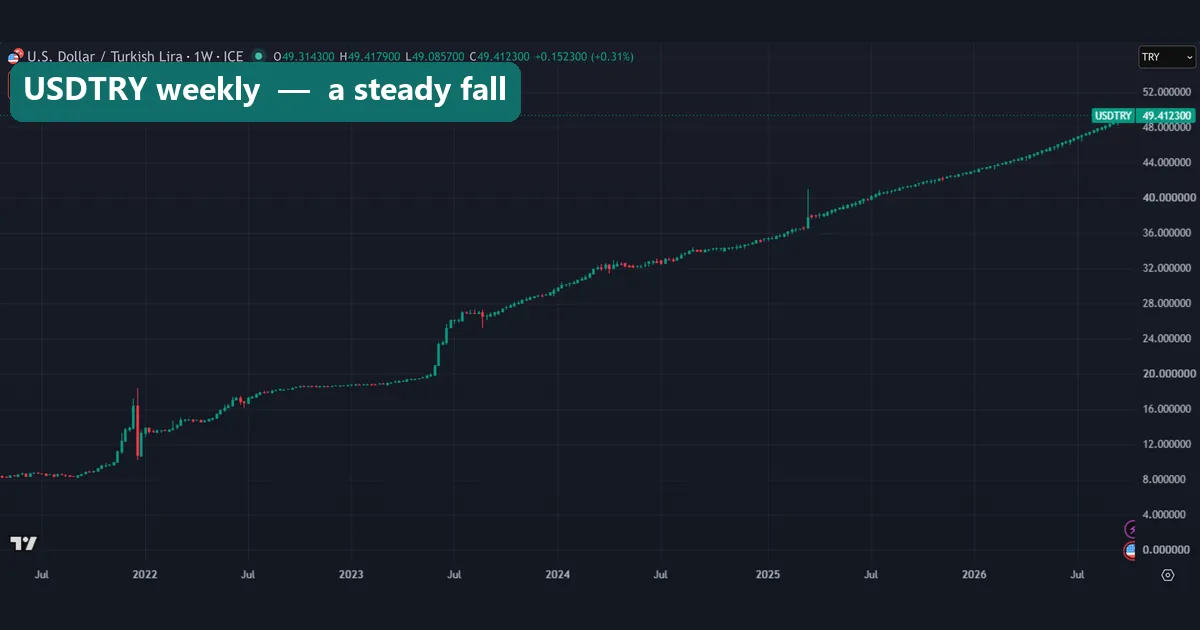
Not every weak currency falls off a cliff. USDTRY climbs from single digits in mid-2021 to 49.41 on 14 October 2026, with no data flag. There is a sharp spike in late 2021, a jump in mid-2023 and a one-week spike in early 2025. Between those events, the line rises week after week. The result is a -81.3% change in the lira’s value over about five years, and -15.4% over the last year.
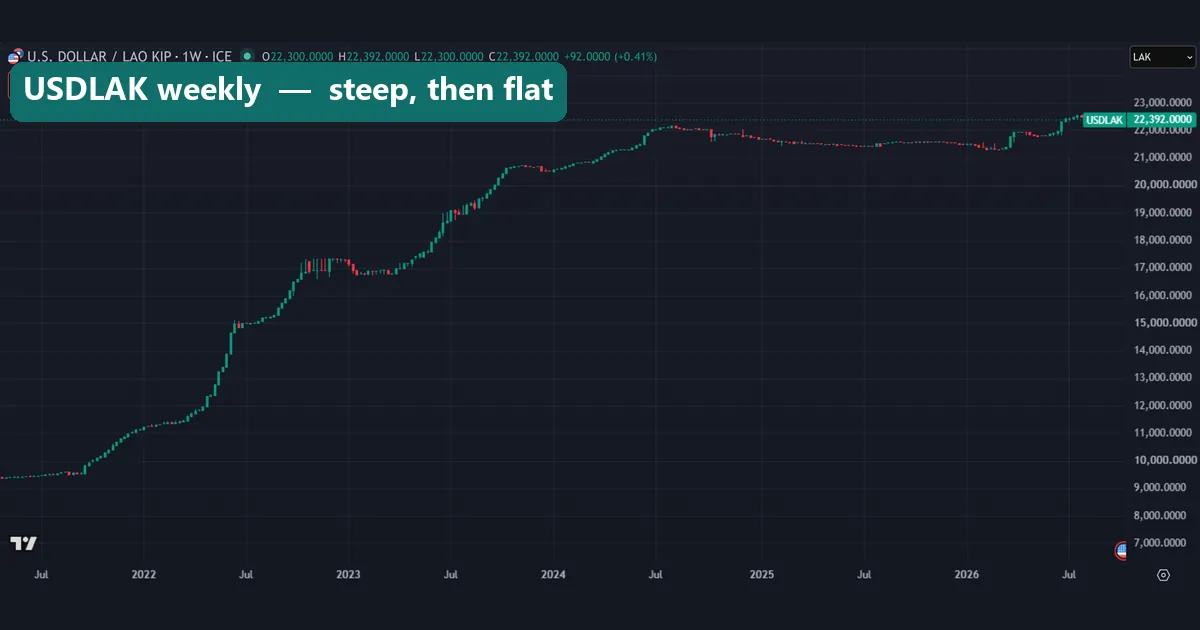
The Lao kip shows a slower version. USDLAK rises from a little under 10,000 in mid-2021 to about 22,000 by mid-2024, with the steepest climb in 2022. It then drifts sideways before stepping up in 2026 to 22,385. That adds up to -54.8% over about five years, but only -3.6% over the past year. So the kip ranks fourth by units per dollar and eighth by fall.
Common mistakes when ranking weak currencies
Reading a big number as a bad currency. The dong, the rupiah and the guarani all count in thousands per dollar. Yet the guarani gained 21.4% over about five years and the dong lost only 12.1%.
Comparing across a redenomination or a quote switch. A chart that drops six zeros in one bar has not rallied. Likewise, a jump caused by a new quote source is not market panic. Check the flags first.
Treating a flat line as stability. The Lebanese pound shows 0.0% over one year because the official quote did not move. A managed rate looks calm until someone resets it.
Taking the quote as the price people pay. Where parallel markets exist, the quoted rate can sit far from what a person pays. A wide gap between buy and sell prices is a warning sign too, as our guides on the bid and ask price and why spreads widen explain.
Where to go next
These currencies sit far from the pairs most traders watch. For those, start with our guide to the major currency pairs, then see which ones hold up under stress in safe haven currencies.
Weak currencies often come with high interest rates, and our explainer on the carry trade covers why that pairing carries real risk. Also, CPI in forex shows how inflation data moves a currency, and do central banks trade forex covers interventions and pegs. To compare the majors, try our currency strength meter.
Outside our site, check a live quote on the USD/IRR page on TradingView and compare it with the World Bank series above.
FAQ: weakest currency in the world
What is the weakest currency in the world right now?
By units per dollar, the Iranian rial on our data: 1 USD = 1,800,165 IRR at the quoted rate on 14 October 2026. By loss of value over about five years, the bolivar and the rial lead, both with data caveats. Rates change daily.
Why do the value ranking and the fall ranking disagree?
They measure different things. Value per unit mostly reflects past inflation and whether a country removed zeros. The fall shows a recent window. The Lao kip ranks fourth by units per dollar but eighth by fall.
Does a low value per unit make a currency bad?
No. The Paraguayan guarani counts 5,683.84 per dollar, yet its value rose 21.4% over about five years. Unit size alone says little about health.
Why did the bolivar chart drop almost to zero in 2021?
Venezuela redenominated in 2021 and removed six zeros. The quote switched to new units in one bar. It was a change of units, not a rally.
Which currency fell the most without a data caveat?
On our list, the Argentine peso, at -93.5% over about five years. Among unflagged currencies, the Turkish lira (-81.3%), the Egyptian pound (-70.6%) and the Nigerian naira (-69.1%) come next.
Why does the Lebanese pound show 0.0% over one year?
Because the official quote did not change that year. Over about five years it shows -83.2%, mostly from official reset steps.
Are these the rates I would get at an exchange office?
Not necessarily. These are quoted FX_IDC rates on 13-14 October 2026. Parallel or black-market rates can differ a lot, dealers add a spread, and rates change daily.
Is a weak currency cheap to buy?
A low price per unit only reflects unit size, not a bargain. Nothing here predicts where any currency goes next or is a buy or sell call. As with any market data, results are not guaranteed; past performance is not indicative of future results.
Last updated: 15 October 2026.

About the author
Written by Dominic Walsh, a Forex trader and MT4/MT5 indicator, Expert Advisor and script developer. Every tool on forexmt4systems.com is tested on live charts before release and ships with ready-to-use compiled MT4 (.ex4) and MT5 (.ex5) files. Learn more about the trader and developer behind this site.
How we build, test and correct every tool: Editorial & Testing Policy. Trading carries risk; see the disclaimer.