
The most valuable currency in the world, measured by how many US dollars one unit buys, is the Kuwaiti dinar. At the quoted rate on 13 October 2026, one dinar (KWD) bought 3.2457 US dollars. Next came the Bahraini dinar, the Omani rial and the Jordanian dinar, and only then the British pound. This guide settles three things. First, which currencies top the list, from our own pull of 33 exchange rates. Second, why central banks peg four of the top five. Third, why “most valuable” and “strongest” are different questions with different answers.
Which is the most valuable currency in the world?
“Most valuable” here means unit value: the price of one unit of a currency in another currency. We use the US dollar as the yardstick, because most quotes run through it. On that measure, the Bahraini dinar came second at 2.6490 dollars and the Omani rial third at 2.5974. Then the gap narrowed: the Jordanian dinar stood at 1.4124 and the British pound at 1.3249.
Unit value is a price, not a score. It says nothing about the size of an economy, or whether the currency gained or lost value. For example, the Kuwaiti dinar sits far above the Swiss franc per unit. Yet over about five years the franc gained 11.1% against the dollar, while the dinar lost 2.2%.
How unit value works: the quote and the flip
An exchange rate always comes as a pair. The quote USDKWD 0.3081 means one US dollar buys 0.3081 dinar. To get the dinar’s own value, flip it:
USD per unit = 1 / (units per USD)
So 1 / 0.3081 gives 3.2457 dollars per dinar. Pairs such as GBPUSD and EURUSD already quote the dollar price of one unit, so they need no flip. Our guide to the major currency pairs explains which currency sits on which side. The currency converter does the flip for you.
The size of a unit is a choice. A government picks it when it creates the currency, and it can change it later. Venezuela removed six zeros from the bolivar in 2021. Sierra Leone’s new leone replaced the old one in 2022, with three zeros gone. Each move lifted the unit value overnight. Still, nobody got richer, because prices and wages shrank by the same factor.
Pegs: why the top of the list barely moves
A peg is a promise by a central bank to hold its currency at, or near, a set rate against an anchor. The Central Bank of Bahrain’s monetary policy page describes a fixed rate between the Bahraini dinar and the US dollar. Oman, Jordan and the Cayman Islands also peg their currencies to the dollar.
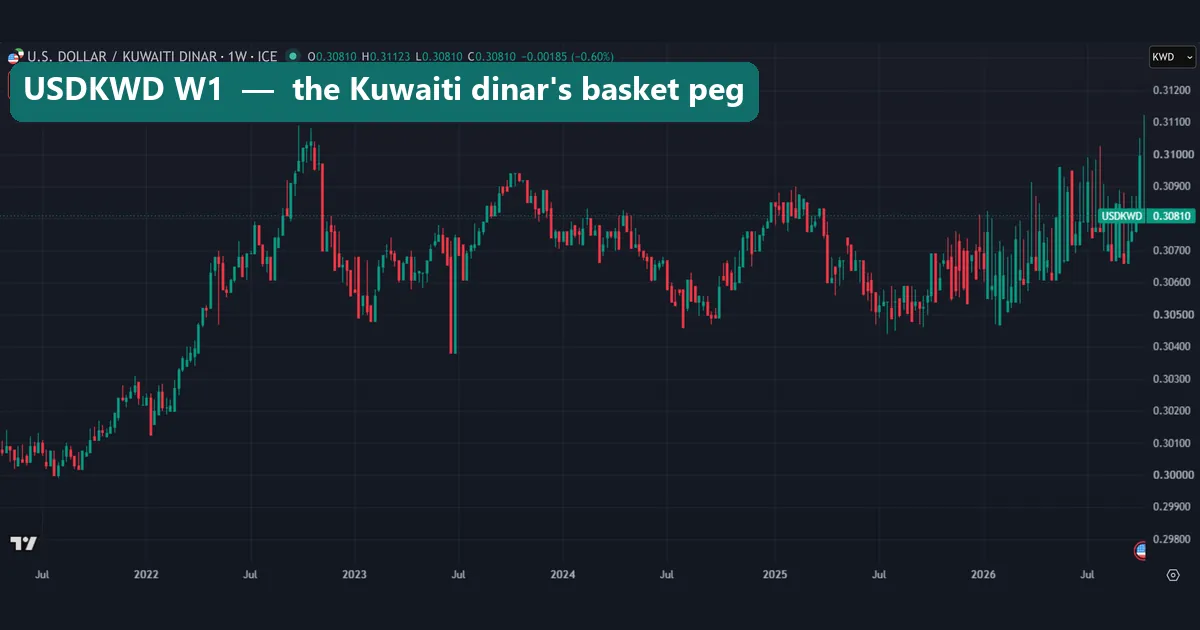
Kuwait works differently. The Central Bank of Kuwait’s exchange rate policy page says it pegs the dinar to an undisclosed weighted basket of its main trade and financial partners’ currencies. Because the dollar is only part of that basket, the dinar can drift a little against it.
Our first image shows that drift. USDKWD rose from near 0.3000 in 2021 to about 0.3110 late in 2022. Those months match the dollar’s peak on our pound and franc charts. A pure dollar peg would have stayed flat. Instead, the basket let the dinar give up a little ground. After that, it moved in a narrow band between roughly 0.3040 and 0.3110.
For the theory behind all this, see fixed exchange rate systems on Wikipedia. In short, a peg trades freedom for stability, and the central bank needs reserves to defend it.
How we tested
We pulled weekly bars for 33 currencies on a TradingView web chart, using the FX_IDC exchange-rate feed, which comes from ICE. Most series start on 17 January 2021 and hold 300 weekly bars. The last closes are from 14 October 2026. For the Kuwaiti dinar, the Lebanese pound and the Myanmar kyat, the last close was 13 October. We took the screenshots on 15 October 2026.
For each currency, we turned the last close into dollars per unit. Then we measured the 1-year and the roughly 5-year change in that dollar value, from the weekly closes. A negative figure means one unit now buys fewer dollars. The six price charts in this guide are FX_IDC:USDKWD, USDBHD, USDOMR, USDJOD, GBPUSD and USDCHF, all weekly. Image 4 is our own bar chart, drawn from the same data.
Some series carry warnings. FX_IDC moved the Iranian rial from the official rate to a market rate inside the window. Lebanon reset its official rate in steps. Syria removed two zeros, so we left the Syrian pound out of the change ranking. Venezuela’s 2021 redenomination and Sierra Leone’s 2022 switch to the new leone also bend the long-run figures. Parallel or black-market rates can differ a lot from these quoted rates. Our methods follow the editorial testing policy.
The top nine currencies by unit value
The table lists the nine highest unit values in our set. “Regime” means how each government manages its currency against others. Rates change every day, so treat the figures as a snapshot of 13 and 14 October 2026.
| Rank | Currency | USD per unit | Units per USD | 1-year change | About 5-year change | Regime |
|---|---|---|---|---|---|---|
| 1 | Kuwaiti dinar (KWD) | 3.2457 | 0.3081 | -0.4% | -2.2% | Basket peg |
| 2 | Bahraini dinar (BHD) | 2.6490 | 0.3775 | -0.1% | -0.1% | US dollar peg |
| 3 | Omani rial (OMR) | 2.5974 | 0.3850 | 0.0% | -0.1% | US dollar peg |
| 4 | Jordanian dinar (JOD) | 1.4124 | 0.7080 | 0.0% | 0.0% | US dollar peg |
| 5 | British pound (GBP) | 1.3249 | 0.7548 | -1.1% | -3.6% | Floating |
| 6 | Gibraltar pound (GIP) | 1.3247 | 0.7549 | -1.2% | -3.7% | At par with sterling |
| 7 | Cayman Islands dollar (KYD) | 1.2195 | 0.8200 | 0.0% | 0.0% | US dollar peg |
| 8 | Swiss franc (CHF) | 1.2044 | 0.8303 | -4.1% | +11.1% | Floating |
| 9 | Euro (EUR) | 1.1207 | 0.8923 | -3.7% | -3.4% | Floating |
Two patterns stand out. First, the dollar pegs hardly moved: their changes sit between -0.1% and 0.0% over both windows. Second, the floating currencies moved far more. The franc lost 4.1% in a year but still gained 11.1% over five. The Gibraltar pound tracks sterling at par, and our quotes show it, at 1.3247 against 1.3249.
Reading a pegged currency on a chart
A pegged currency’s chart can look broken at first sight. TradingView stretches the price scale to fit the bars, so tiny moves fill the whole screen.
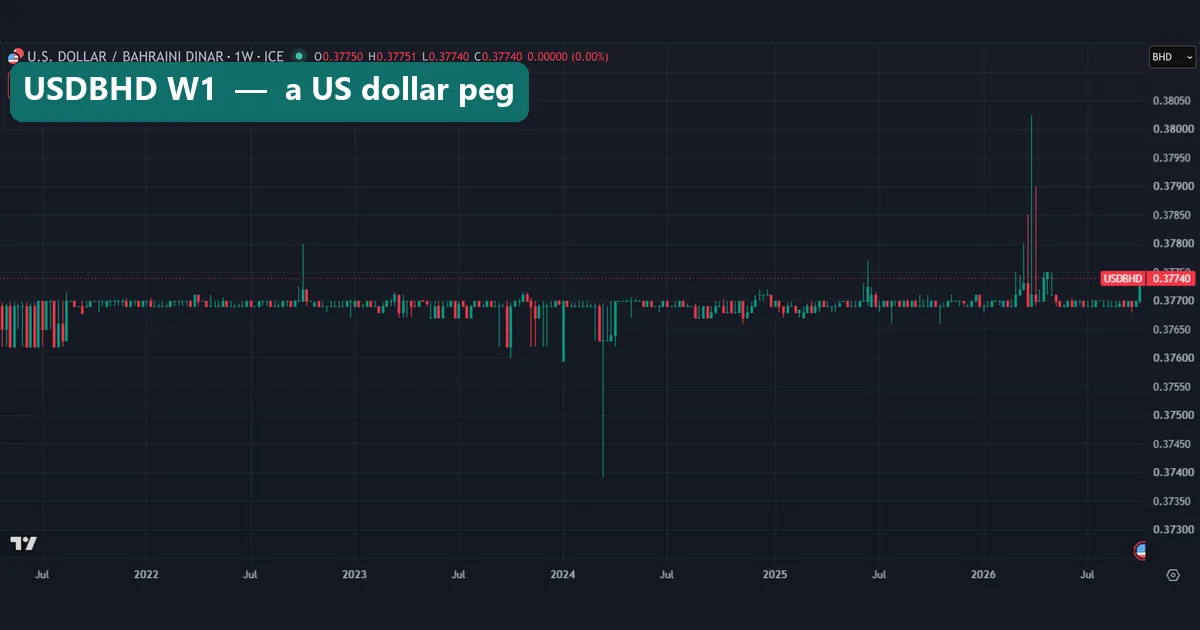
The Bahraini dinar shows the effect. Most weekly bars sit on the 0.3770 line, and the price scale only runs from about 0.3730 to 0.3805. A few long wicks stand out, such as a dip toward 0.3740 in 2024 and spikes near 0.3800 early in 2026. On a floating pair, wicks of that size would vanish into the noise. Here they look dramatic.
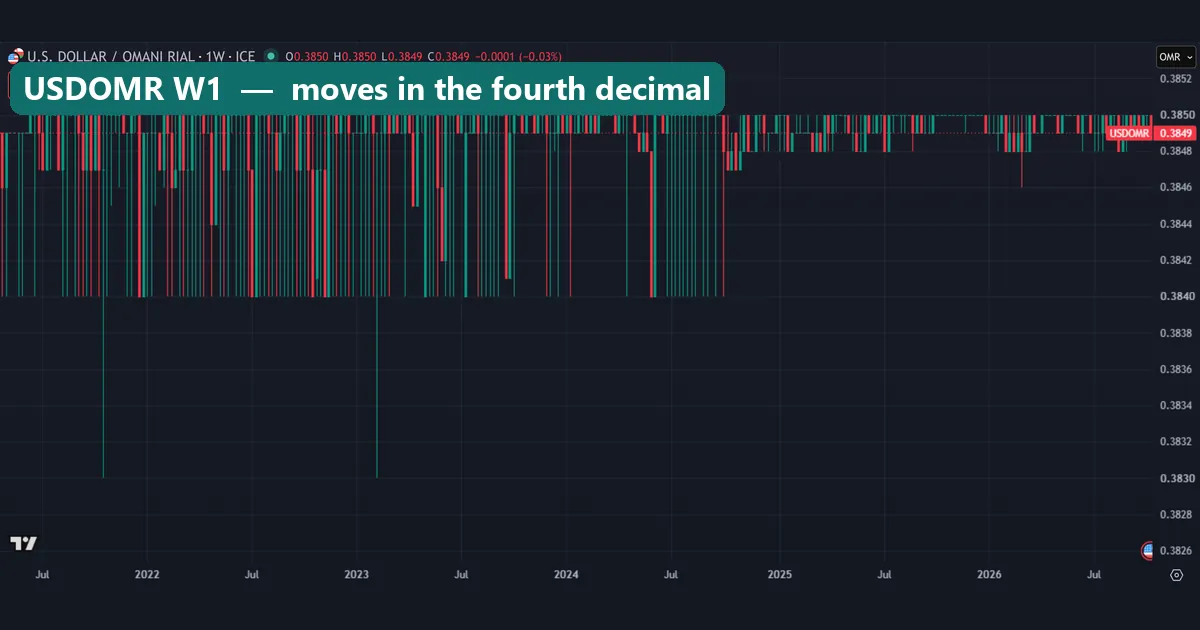
The Omani rial looks like a barcode. Until late 2024, weekly bars swing between 0.3840 and 0.3850, with two wicks down to 0.3830. After that, the band tightens to roughly 0.3848 to 0.3850. These are moves in the fourth decimal place. In dollar terms, one rial was worth 2.5974 on 14 October 2026, and its 1-year change was 0.0%.
So check the price scale before you judge the shape. For the rial, the whole scale spans about 0.0026, well under 1% of the price.
Worked example: pricing one Kuwaiti dinar
Here is the arithmetic behind the headline, using only the quoted rates from our data.
- Read the quote. USDKWD closed at 0.3081 on 13 October 2026, so one dollar bought 0.3081 dinar.
- Flip it. 1 / 0.3081 = 3.2457, so one dinar bought 3.2457 dollars.
- Cross into pounds. GBPUSD stood at 1.3249, so one dinar bought 3.2457 / 1.3249 = 2.4498 pounds.
- Cross into francs. One franc was worth 1.2044 dollars, so one dinar bought 3.2457 / 1.2044 = 2.6949 francs.
- Check the trend. Over about five years, the dinar’s dollar value fell 2.2%, while the franc’s rose 11.1%.
Step 5 is the one most rankings skip. Suppose you had swapped dollars into dinars about five years ago. Before interest and costs, those dinars would now buy 2.2% fewer dollars. Francs bought at the same time would buy 11.1% more. The cheaper unit did better.
Also note that these are mid-market style quotes. A bank or money changer adds its own margin, so its bid and ask prices sit on either side of the numbers above.
Our ranking in one chart, and the Jordanian dinar
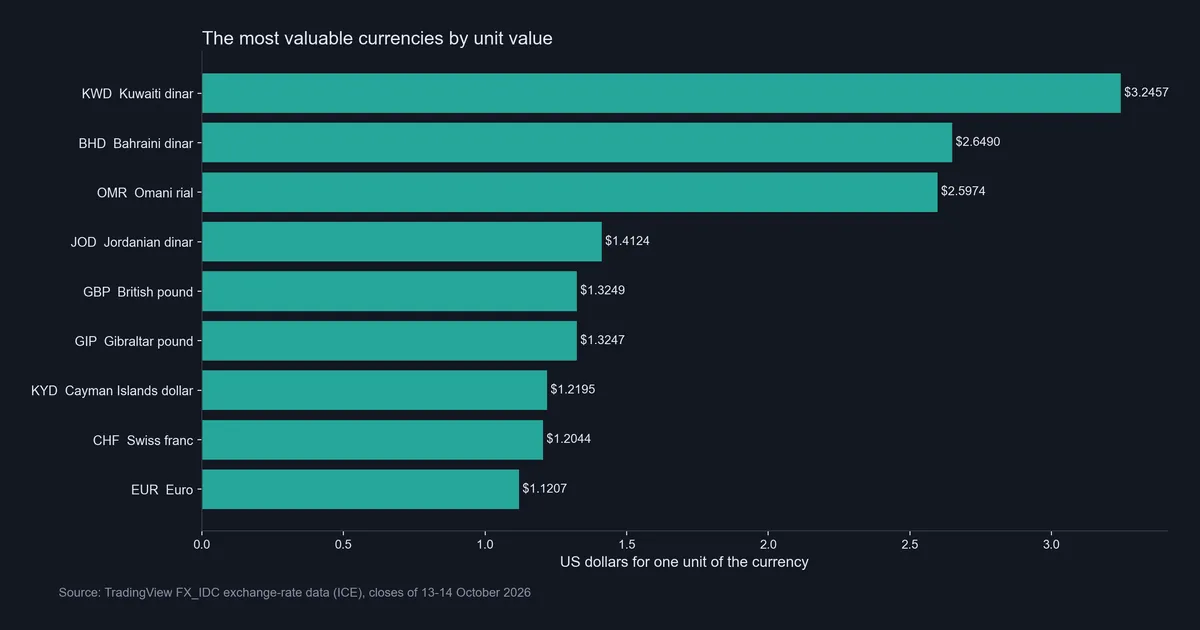
Image 4 draws the nine unit values as bars. Three bars stand far out: the two Gulf dinars and the Omani rial, all above 2.5 dollars. After them, the values bunch between 1.12 and 1.42 dollars. The pound, the Cayman dollar and the franc sit within about 12 cents of each other. The franc trailed the Cayman dollar by about 1.3%, yet it moved 4.1% in a single year. So ordinary currency swings can reshuffle the lower half of the list, while the top three stay put.
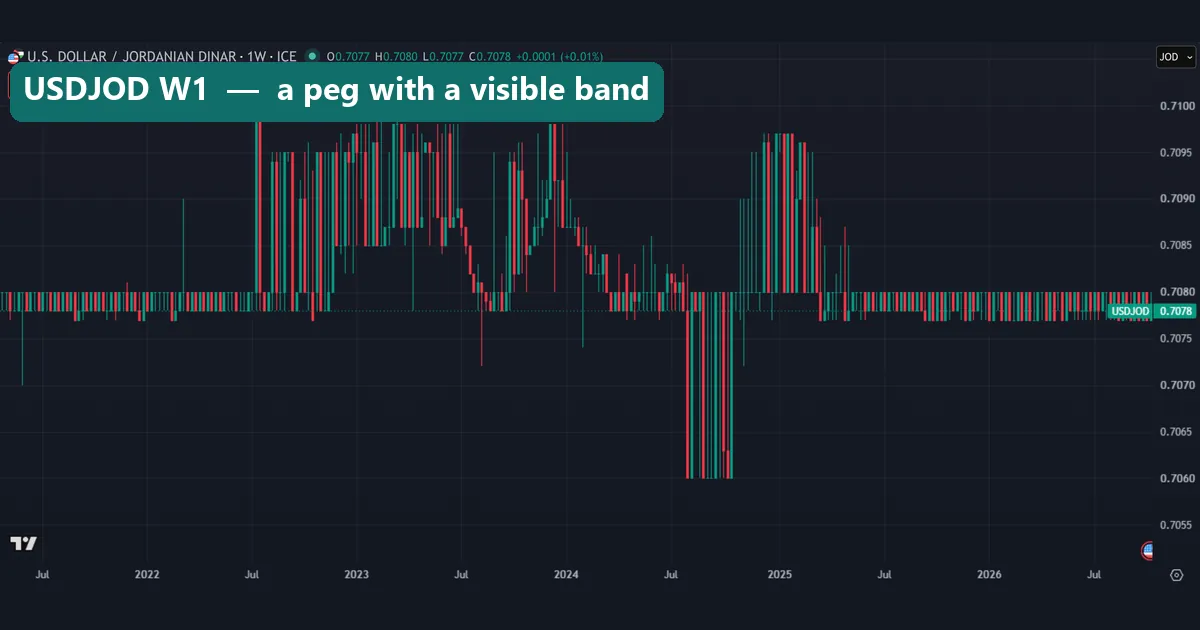
The Jordanian dinar shows a peg with a visible band. Weekly bars hold between about 0.7060 and 0.7100, and most of the time they sit near 0.7078 to 0.7080. From mid-2022 into late 2023, and again around the turn of 2025, bars climbed into the 0.7090 to 0.7100 area. In the second half of 2024 they dipped to 0.7060. Even so, the dollar value of one dinar changed 0.0% over about five years. A peg does not mean a frozen quote. It means a quote that keeps coming back.
Download the complete indicator database
Put these concepts on your charts. One email unlocks the full library of 1,380+ indicators with compiled MT4 and MT5 files, plus my TradingView scripts. No paywall, no spam, unsubscribe any time.
Get free access to my indicator database
One email unlocks 1,380+ free MT4, MT5 and TradingView indicators — the complete library. No single-tool download; you get the whole database.
Where it fails: what unit value cannot tell you
The ranking answers one narrow question, and it fails on any other.
It is a snapshot. Quoted rates change daily, and the lower half of the list can reorder. For the floating majors, the Federal Reserve’s H.10 daily exchange rate release gives an official cross-check.
A quote is not the only rate. FX_IDC is a vendor quote. Parallel or black-market rates can differ a lot, mainly where capital controls apply. The Iranian rial series even switched from an official to a market rate inside our window.
Our set is not every currency. We pulled 33. Any currency outside the set could change the order, so treat our list as a ranking of what we measured.
Pegs can break. Lebanon’s official rate was a peg, and it went from 1,507 to 15,000 pounds per dollar in 2023, then to 89,500. A move like that would rewrite the ranking overnight. We make no forecast for any Gulf peg.
It ignores prices at home. A unit value says nothing about what the currency buys locally or how fast its prices rise. Our page on how inflation affects forex covers that side.
Most valuable is not the same as strongest
“Strongest” usually means a currency that gained value, or one that held up when others fell. That is a change, not a level. On change, the leaders in our set were not the Gulf currencies. Over about five years, the Paraguayan guarani gained 21.4% against the dollar, the Colombian peso 17.8% and the Swiss franc 11.1%. Yet one guarani was worth just 0.00017594 dollars.
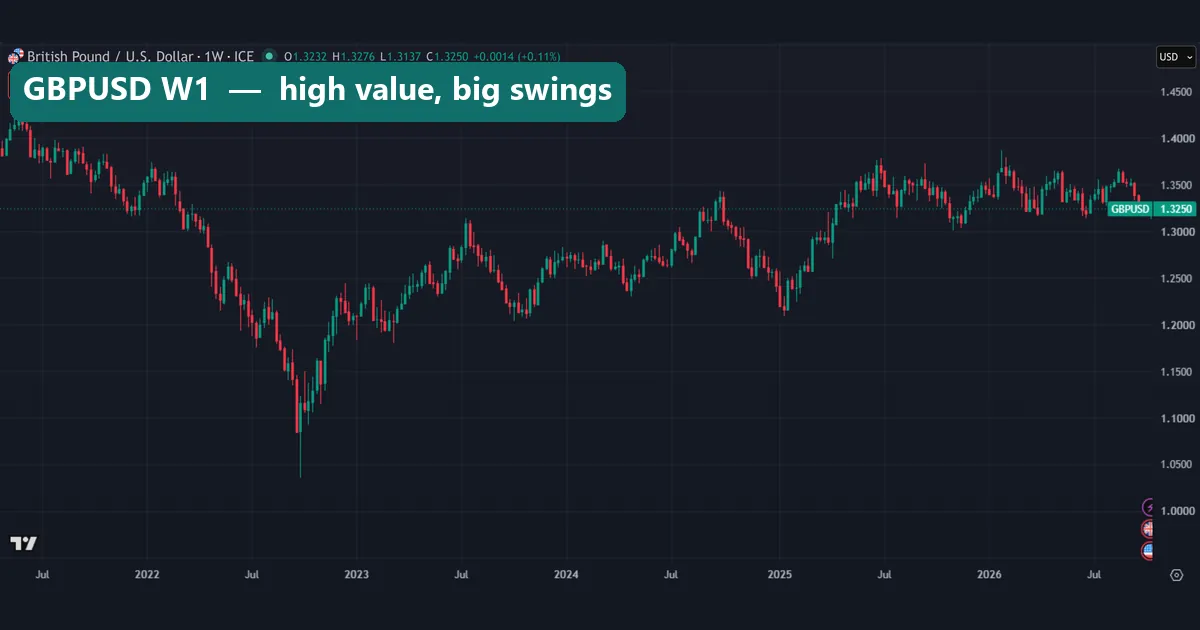
The pound shows the difference. It ranked fifth by unit value, at 1.3249 dollars. Yet its weekly chart runs from above 1.40 in mid-2021 to below 1.05 in late 2022, then back above 1.35 in 2025 and 2026. Over about five years, its dollar value fell 3.6%. A high unit value did not stop a large fall.
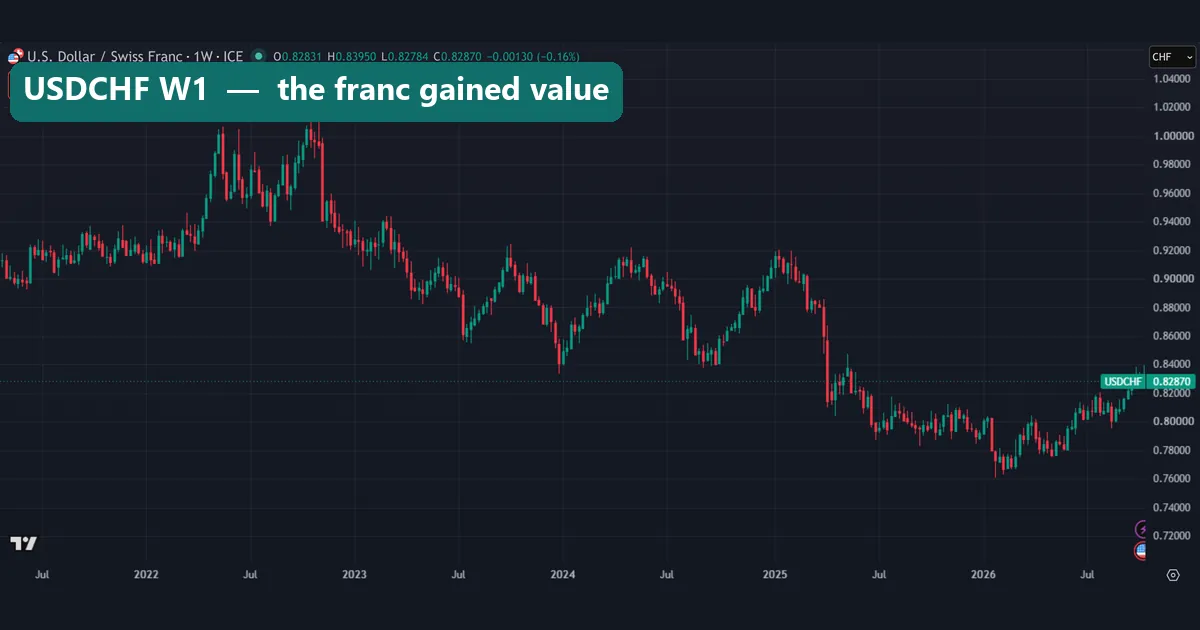
The Swiss franc tells the opposite story. USDCHF rose above 1.00 in late 2022, so for a while one franc was worth less than a dollar. Then the pair fell to about 0.76 early in 2026 and stood at 0.8303 on 14 October. Many traders treat the franc as one of the safe-haven currencies, and its chart fits that reputation better than any peg. To compare strength across currencies, use a currency strength meter, because it measures change rather than level.
What this means for forex traders
For trading, the top of the list is mostly a curiosity. A tight peg leaves little movement to trade, and the main risk is a rare break rather than daily swings. First, check whether your broker lists Gulf dinar pairs at all. Where it does, compare the spread and the overnight swap with a major pair before you open anything.
Pegs matter more as information. To hold a dollar peg, a central bank has to keep its interest rates close to US rates. Otherwise money would flow to whichever side paid more, which is the interest rate differential at work. As a result, US central bank rate decisions travel straight into pegged economies.
Defending a peg also takes reserves. Our guide on whether central banks trade forex covers how that works. When you want the dollar’s own strength, the dollar index is the better gauge than any single peg.
Common mistakes with currency rankings
- Reading unit value as strength. The dinar tops the list, but it lost 2.2% of its dollar value over about five years while the franc gained 11.1%.
- Treating one quote as the rate. Vendor, official and street rates can differ, and all of them change daily.
- Comparing across a redenomination. Venezuela, Sierra Leone and Syria all removed zeros. A unit value before and after such a change measures two different units.
- Assuming a peg cannot move. Lebanon’s official rate moved in large steps. A flat chart shows a policy, and a policy can change.
Where to go next
If you trade the majors, read how risk-on and risk-off currencies behave. It covers which currencies tend to gain when markets turn nervous. For floating currencies tied to raw materials, read our guide to commodity currencies.
For primary sources, use the Central Bank of Kuwait and Central Bank of Bahrain pages linked above.
FAQ about the most valuable currencies
What is the most valuable currency in the world right now?
In our data it was the Kuwaiti dinar, at 3.2457 US dollars on the quoted rate of 13 October 2026. Rates change daily.
Why is the Kuwaiti dinar worth so much?
Mostly because of where its unit was set and how Kuwait manages it. The central bank pegs the dinar to a basket of partner currencies, so its value per unit stays high and moves slowly.
Is the British pound the strongest currency?
By unit value it ranked fifth in our set, at 1.3249 dollars, behind four Middle East currencies. By change, it lost 3.6% of its dollar value over about five years.
Is the Swiss franc worth more than the US dollar?
Yes, per unit. One franc was worth 1.2044 dollars on 14 October 2026. Its dollar value also rose 11.1% over about five years.
Why is the US dollar not in the ranking?
Because it is the measuring stick. One dollar always equals one dollar, so it would rank just below the euro, which was worth 1.1207 dollars.
Does a high unit value mean a strong economy?
No. Unit size is a choice, and redenominations change it overnight. Venezuela removed six zeros in 2021, and nothing about its economy improved that day.
Can I trade the Kuwaiti dinar on MT4 or MT5?
Only if your broker lists a dinar pair. If it does, compare the spread and swap with a major pair first, because a pegged market leaves little room to trade.
Will the Kuwaiti dinar stay the most valuable currency?
We make no forecast. Pegs can hold for decades or move in one day, as Lebanon’s official rate did. Treat any ranking as a snapshot and check it again; results are not guaranteed; past performance is not indicative of future results.
Last updated: 15 October 2026.

About the author
Written by Dominic Walsh, a Forex trader and MT4/MT5 indicator, Expert Advisor and script developer. Every tool on forexmt4systems.com is tested on live charts before release and ships with ready-to-use compiled MT4 (.ex4) and MT5 (.ex5) files. Learn more about the trader and developer behind this site.
How we build, test and correct every tool: Editorial & Testing Policy. Trading carries risk; see the disclaimer.