
African currencies cover a huge range of unit values, and our data tracks 38 of them. On 18 October 2026, one US dollar bought 2.995 Tunisian dinars but 8,807 Guinean francs at the quoted rates. This guide lists all 38 by region, shows which ones peg to the euro, the rand or the dollar, and ranks them by unit value and by 5-year fall. Those two rankings disagree, and that gap is the main lesson.
What counts as an African currency
An African currency is the legal money of an African state or of a monetary union on the continent. Most countries issue their own, but some share one. The West African CFA franc (XOF) serves states such as Senegal and Mali, and the Central African CFA franc (XAF) serves states such as Cameroon and Gabon. They are separate currencies, yet both traded at 584.05 per dollar, because both peg to the euro at the same rate.
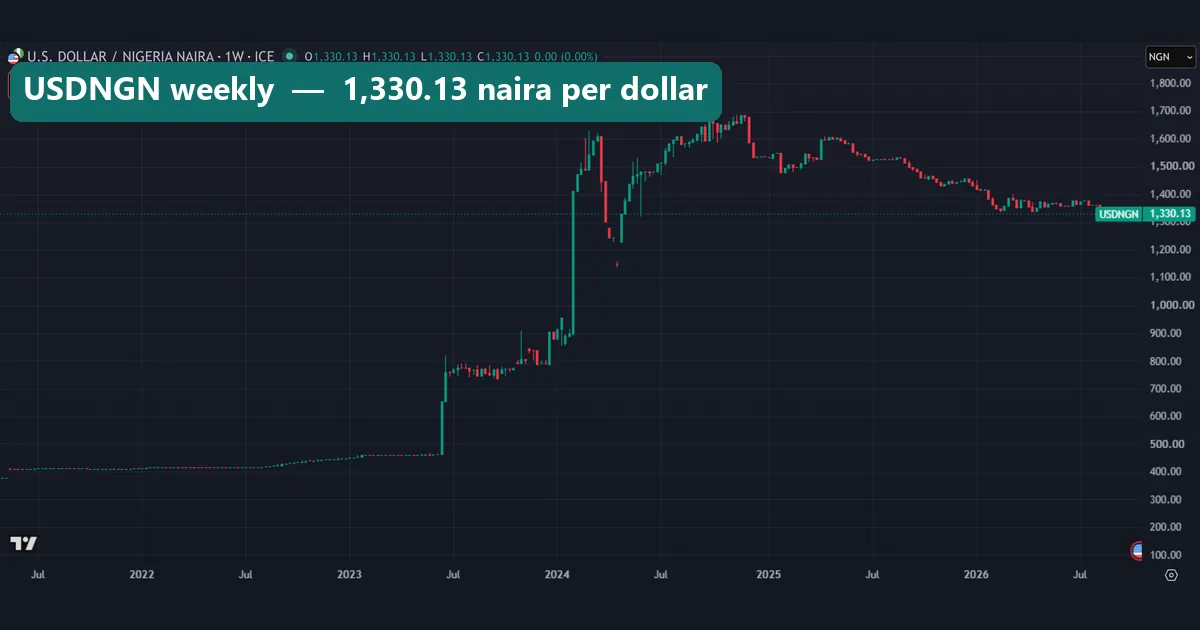
Prices usually come as units per US dollar, so the symbol starts with USD. The chart above is USDNGN: how many naira one dollar buys. So a rising line means a falling naira. Our set is not complete; Zimbabwe, Eritrea, South Sudan and Mauritania sit outside it.
How African currencies get their price: pegs, crawls and floats
Each currency’s regime decides how far its rate can move. Our data sorts the 38 into four groups:
- Euro pegs: both CFA francs at 655.957 per euro, the Comorian franc at 491.968, the Cape Verdean escudo at 110.265 and the Sao Tome and Principe dobra at 24.5.
- Rand pegs: the Namibian dollar, the Lesotho loti and the Eswatini lilangeni, each at 1:1 to the South African rand.
- Other anchors: the Djiboutian franc at 177.721 per US dollar, the Botswana pula on a crawling peg to a rand and SDR basket, and the Moroccan dirham against a euro and dollar basket.
- Floats: the other 27, from the rand and the naira to the Kenyan shilling.
A pegged currency moves against the dollar only as much as its anchor does. The BCEAO’s history of the CFA franc dates the 655.957 rate to 1999. A floating currency moves on supply and demand instead, and the South African Reserve Bank’s foreign exchange page says the rand floats, but the bank may step in to smooth abrupt moves.
Three formulas turn a quote into numbers you can compare:
dollar value of one unit = 1 / units per USD
value change (%)         = (units per USD then / units per USD now - 1) x 100
implied EURUSD           = units per EUR (the peg) / units per USD (the quote)
We track what one unit is worth in dollars, not the quote itself. That way a fall can never pass -100%, so every currency shares one scale.
How we tested
We read weekly closes for 38 African currencies from FX_IDC exchange-rate data (ICE) on the TradingView web chart, pulled on 19 October 2026. Most series end with a quote dated 18 October 2026; the birr, the Somali shilling and the loti stop on 14 October, and the kwanza on 15 October. Most histories start in January 2021, and the new Sierra Leonean leone only in July 2022. From each series we took units per dollar, the value of one unit, and its change over one year and about five years.
Next, we captured five weekly charts on 19 October 2026: USDNGN, USDEGP, USDGHS, USDZAR and USDETB. The two bar charts are our own drawings of the same numbers. Our MetaTrader 4 history (Capital Point Trading, build 1471) holds 23 FX pairs, and none of them includes an African currency, so it played no part here.
These are quoted rates, not tradable or parallel-market prices, and nothing here is a forecast. Our editorial testing policy explains how we collect and report data like this.
Measurement settings
| Setting | What we used |
|---|---|
| Data source | FX_IDC on TradingView (ICE exchange-rate data) |
| Currencies | 38, including both CFA francs |
| Quote | Units of the currency per 1 US dollar |
| Latest quote | 18 October 2026; 14 October for ETB, SOS and LSL; 15 October for AOA |
| Value of one unit | 1 / units per USD |
| Windows | 1 year and about 5 years |
| Bar size | Weekly |
| Regime | Peg anchor and rate where one exists, otherwise float |
| Rate type | Quoted rate only |
| No 5-year figure | SLE (new leone, data from July 2022) |
The last row matters. The new leone replaced the old one in 2022 with three zeros removed, so a 5-year change would compare two different units.
African currencies list by region
Each table gives the quoted rate per dollar, the 1-year and 5-year value change, and the regime. Positive means the currency gained value.
North Africa
The north holds the strongest unit: one Tunisian dinar was worth 0.33389 dollars, the most in our set. It also holds the biggest faller, the Egyptian pound. Algeria’s dinar is one of only three currencies that gained over five years.
| Currency | Per USD | 1 year | 5 years | Regime |
|---|---|---|---|---|
| Egyptian pound (EGP) | 53.89 | -11.8% | -71.0% | Float |
| Moroccan dirham (MAD) | 9.7827 | -6.4% | -7.5% | EUR/USD basket |
| Tunisian dinar (TND) | 2.995 | -2.7% | -6.2% | Float |
| Algerian dinar (DZD) | 134.15 | -4.3% | +1.9% | Float |
| Libyan dinar (LYD) | 6.408 | -15.5% | -29.2% | Float |
| Sudanese pound (SDG) | 598.55 | 0.0% | -26.7% | Float (quoted rate) |
West Africa
West Africa mixes a large peg with deep falls. Yet the naira’s +10.4% was the second-best 1-year move in our set. The Guinean franc is the weakest unit in Africa, but it gained value over five years.
| Currency | Per USD | 1 year | 5 years | Regime |
|---|---|---|---|---|
| Nigerian naira (NGN) | 1,330.13 | +10.4% | -69.2% | Float |
| Ghanaian cedi (GHS) | 11.63 | -9.3% | -48.5% | Float |
| West African CFA franc (XOF) | 584.05 | -3.7% | -3.6% | Euro peg |
| Gambian dalasi (GMD) | 74 | -2.1% | -30.1% | Float |
| Guinean franc (GNF) | 8,807 | -1.7% | +8.9% | Float |
| Liberian dollar (LRD) | 169.74 | +7.4% | -7.8% | Float |
| Sierra Leonean leone (SLE) | 22.85 | -1.3% | n/a | Float |
| Cape Verdean escudo (CVE) | 98.05 | -3.6% | -3.4% | Euro peg |
Central Africa
Central Africa splits between a peg and floats. The CFA franc and the dobra follow the euro, while the kwanza lost 35.1% in five years.
| Currency | Per USD | 1 year | 5 years | Regime |
|---|---|---|---|---|
| Central African CFA franc (XAF) | 584.05 | -3.7% | -3.6% | Euro peg |
| Congolese franc (CDF) | 2,265.5 | -6.2% | -12.6% | Float |
| Angolan kwanza (AOA) | 912.8 | -0.1% | -35.1% | Float |
| Sao Tome and Principe dobra (STN) | 21.8 | -3.7% | -3.7% | Euro peg |
East Africa and the Horn
East Africa shows how much the regime matters. The birr tied the Egyptian pound for the largest fall, while the Djiboutian franc, tied to the dollar, moved just 0.2%.
| Currency | Per USD | 1 year | 5 years | Regime |
|---|---|---|---|---|
| Kenyan shilling (KES) | 129.65 | -0.5% | -14.4% | Float |
| Tanzanian shilling (TZS) | 2,624 | -7.1% | -12.3% | Float |
| Ugandan shilling (UGX) | 4,113.3 | -15.3% | -12.8% | Float |
| Rwandan franc (RWF) | 1,470.22 | -1.8% | -32.6% | Float |
| Burundian franc (BIF) | 2,987.18 | -1.7% | -33.8% | Float |
| Ethiopian birr (ETB) | 160.5 | -8.5% | -71.0% | Float |
| Somali shilling (SOS) | 568 | 0.0% | +0.5% | Float |
| Djiboutian franc (DJF) | 177.91 | -1.6% | -0.2% | US dollar peg |
Southern Africa
The rand sets the pace for three neighbours that track it at 1:1. Zambia’s kwacha posted the best 1-year gain in our set. Malawi’s kwacha lost 53.0% over five years, yet its quote did not move in the past year.
| Currency | Per USD | 1 year | 5 years | Regime |
|---|---|---|---|---|
| South African rand (ZAR) | 16.42 | +5.7% | -9.8% | Float |
| Namibian dollar (NAD) | 16.42 | +5.7% | -10.2% | Rand peg 1:1 |
| Lesotho loti (LSL) | 16.5 | +5.2% | -11.5% | Rand peg 1:1 |
| Eswatini lilangeni (SZL) | 16.41 | +5.8% | -9.8% | Rand peg 1:1 |
| Botswana pula (BWP) | 13.37 | -0.5% | -16.4% | Crawling peg |
| Zambian kwacha (ZMW) | 19.95 | +13.5% | -14.3% | Float |
| Malawian kwacha (MWK) | 1,717.02 | 0.0% | -53.0% | Float |
| Mozambican metical (MZN) | 63.25 | 0.0% | -0.1% | Float |
Indian Ocean islands
Three of the four island currencies fell less than the median African currency, which lost 11.5% over five years. Still, the Malagasy ariary is the second-weakest unit in Africa.
| Currency | Per USD | 1 year | 5 years | Regime |
|---|---|---|---|---|
| Mauritian rupee (MUR) | 47.09 | -4.7% | -9.5% | Float |
| Seychellois rupee (SCR) | 14.52 | +2.2% | -1.2% | Float |
| Malagasy ariary (MGA) | 4,561.61 | -1.2% | -14.9% | Float |
| Comorian franc (KMF) | 437.55 | -3.8% | -3.5% | Euro peg |
Reading the charts: Egypt’s steps and Ghana’s round trip
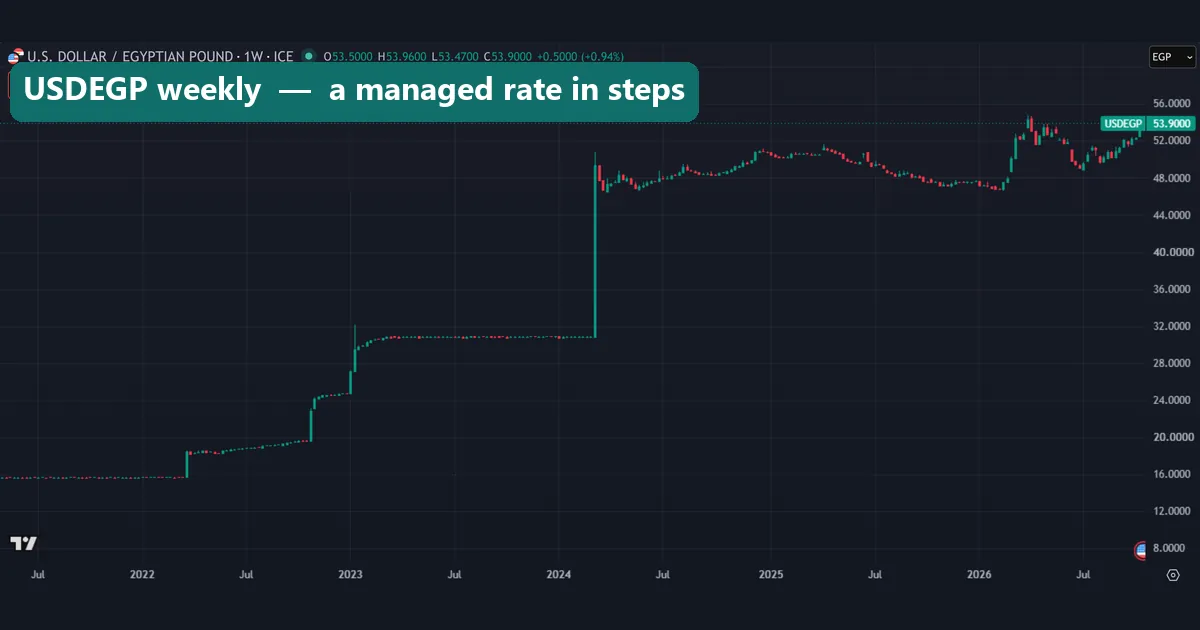
The Egyptian pound chart moves in steps, not waves. USDEGP sits flat near 15.7 until early 2022, then climbs to the 18 to 20 area. Late in 2022 it steps to about 24.5, and then to about 30.9, where it stays for more than a year. In early 2024 one bar jumps to around 50.
That is what a managed rate looks like: long flat stretches, then a sudden reset. The flat parts show a rate held in place by policy, not a calm market. The Central Bank of Egypt’s exchange rate page publishes the official quotes.
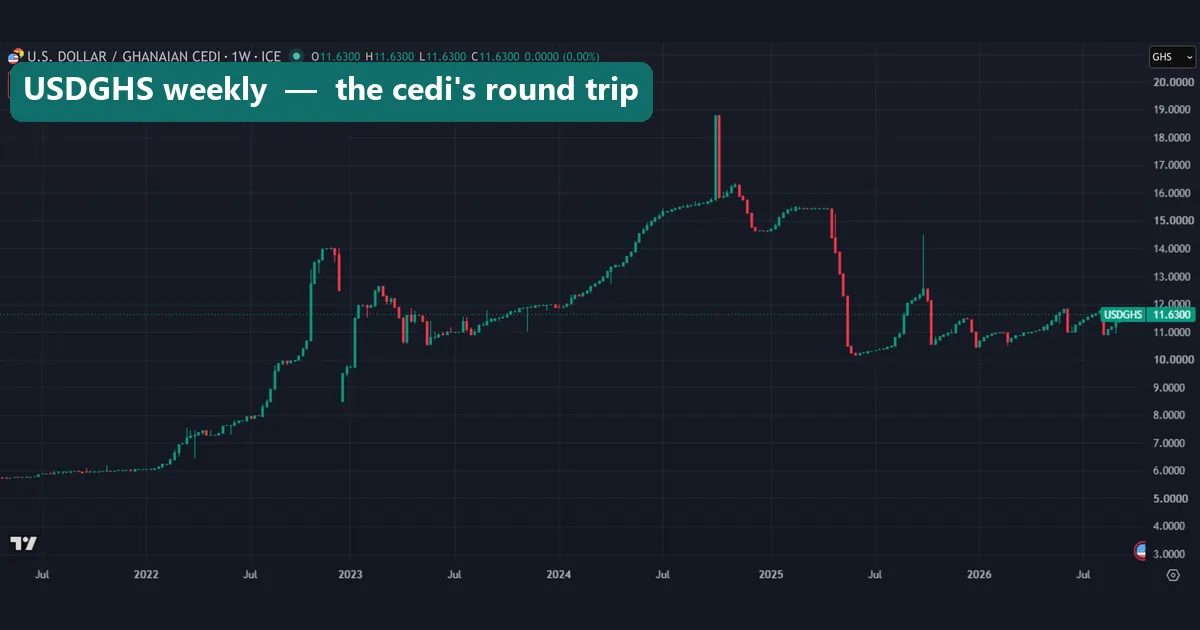
Ghana’s chart looks different. USDGHS climbs from about 6 in 2021 to about 14 late in 2022, and it swings both ways through 2023. Then it rises to about 16 in late 2024. In the first half of 2025 it drops hard, to around 10.3.
That drop is the cedi gaining value. So a float can claw back part of a fall, and one 5-year number hides that path. The cedi still lost 48.5% over five years, and 9.3% over the last one as part of the recovery faded.
Worked example: the naira, and a peg check
Start with the naira chart at the top of this page. On 18 October 2026, one dollar bought 1,330.13 naira. So one naira was worth 0.000752 dollars, which makes 1,000 naira worth about 75 US cents.
Next, undo the 5-year change. The value change was -69.2%, so the old quote equals 1,330.13 x (1 – 0.692), or about 410 naira per dollar. The left edge of the chart sits right there. Back then, 1,000 naira bought about 2.44 dollars.
The 1-year change runs the other way. It was +10.4%, so a year ago the quote stood near 1,330.13 x 1.104, about 1,468. On the chart, the line eases from its late-2024 peak near 1,700. You can redo these sums for any amount with our currency converter, and the Central Bank of Nigeria’s exchange rate table lists the official daily rate.
Now test a peg. The West African CFA franc pegs at 655.957 per euro, and its quote was 584.05 per dollar. Divide the two: 655.957 / 584.05 gives about 1.1231 dollars per euro. Our EUR/USD data closed at 1.12224 on 19 October 2026. The Comorian franc gives 1.1244, the escudo 1.1246 and the dobra 1.1239.
All four land close to the market rate, so the pegs held; rounding and timestamps explain the small gaps. It also explains the CFA franc’s -3.6% over five years: that is the euro’s own move against the dollar.
Which African currency is weakest? Two rankings
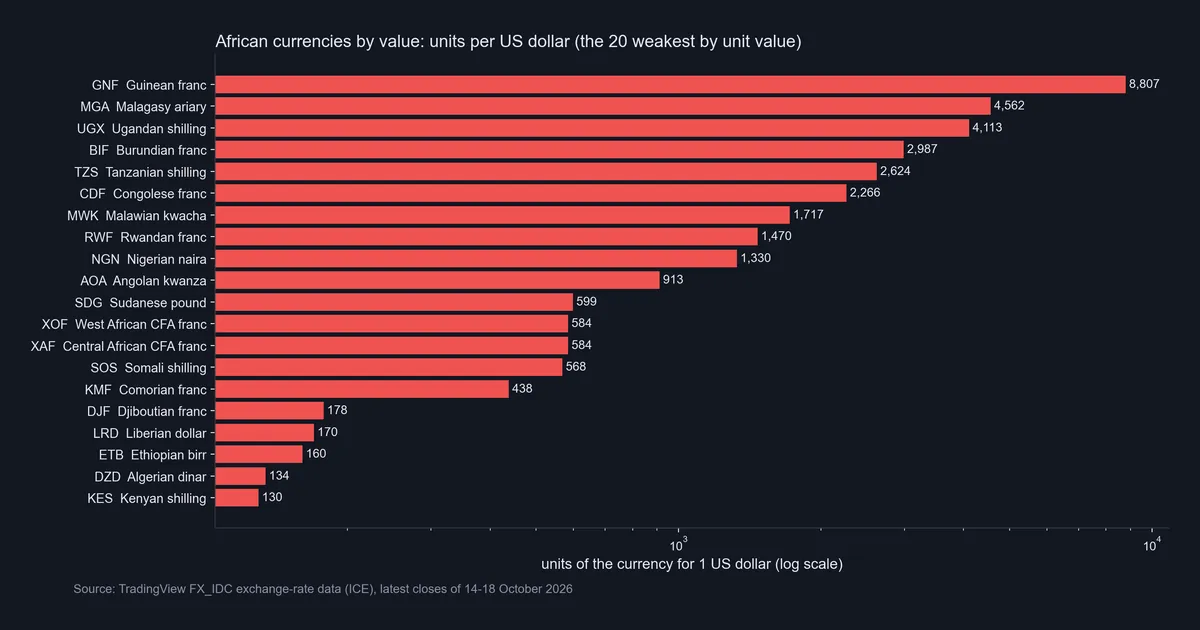
Our first data chart ranks the 20 African currencies with the lowest unit value, on a log scale. The Guinean franc leads at 8,807 per dollar, then the Malagasy ariary at 4,562 and the Ugandan shilling at 4,113. The naira sits ninth at 1,330. A large count mostly reflects old inflation that nobody cut out of the unit. So it says little about recent years, and the Guinean franc gained 8.9% in value over five.
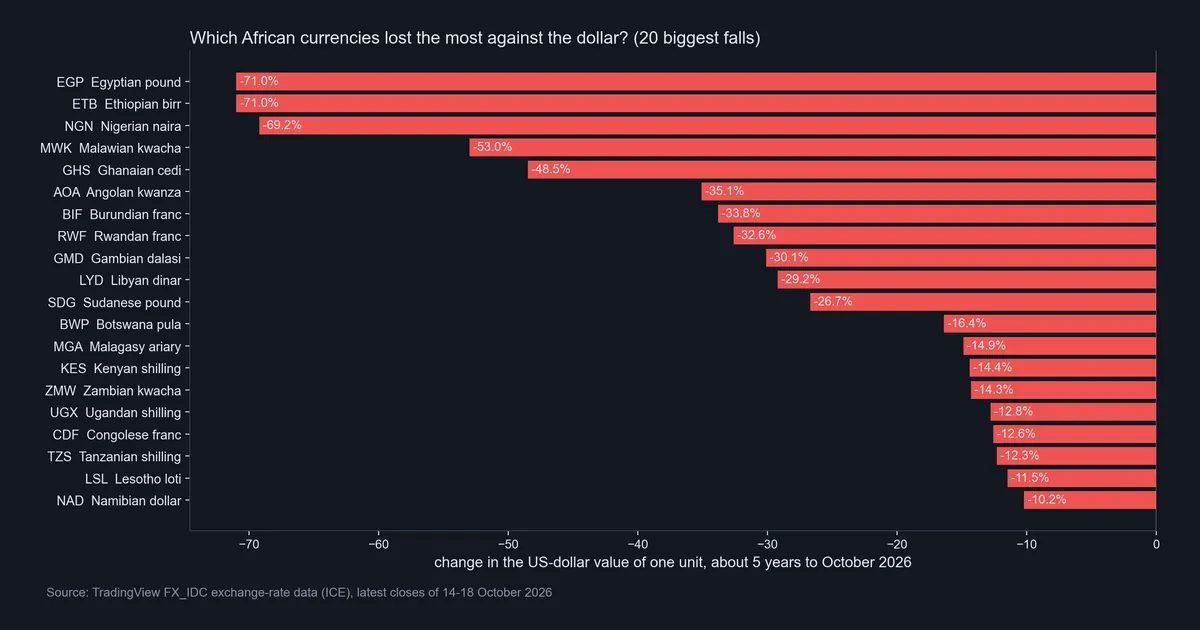
The second chart ranks the 20 biggest falls over about five years. The Egyptian pound and the Ethiopian birr tie at -71.0%, then come the naira at -69.2% and the Malawian kwacha at -53.0%. Nine currencies lost 30% or more.
Now compare them. At 53.89 per dollar, the Egyptian pound misses the first chart, yet it tops the second. The cedi is the fourth most valuable unit in our set and still the fifth-biggest faller. A weak currency, in everyday use, is one that keeps losing buying power, and that shows in the fall, not the count. Our guide on how inflation affects forex explains that link. Our weakest currency in the world rankings run the same split globally.
Download the complete indicator database
Put these concepts on your charts. One email unlocks the full library of 1,380+ indicators with compiled MT4 and MT5 files, plus my TradingView scripts. No paywall, no spam, unsubscribe any time.
Get free access to my indicator database
One email unlocks 1,380+ free MT4, MT5 and TradingView indicators — the complete library. No single-tool download; you get the whole database.
Where it fails
A quoted rate is only one price. Sudan is the clear case: its official and parallel rates moved far apart during the 2023 to 2026 war, and FX_IDC shows only the quoted rate. So our numbers are not what a traveller or importer may pay.
Flat lines can hide pressure. The Sudanese pound, the Malawian kwacha, the Mozambican metical and the Somali shilling all show a 1-year change of 0.0%. A rate that does not move for a year can reflect a held quote rather than a calm market.
Thin data also adds noise. The Djiboutian franc pegs at 177.721 per dollar, yet our series shows a 1.6% move over one year. And the loti’s 5-year change reads -11.5% against the rand’s -9.8%, partly because its last quote is older.
High local rates can tempt carry traders, but a single step devaluation, like Egypt’s in early 2024, can erase years of interest. Finally, nothing here tells you where a rate goes next. A large past fall is not a signal to buy or sell.
Reading the rand and birr charts
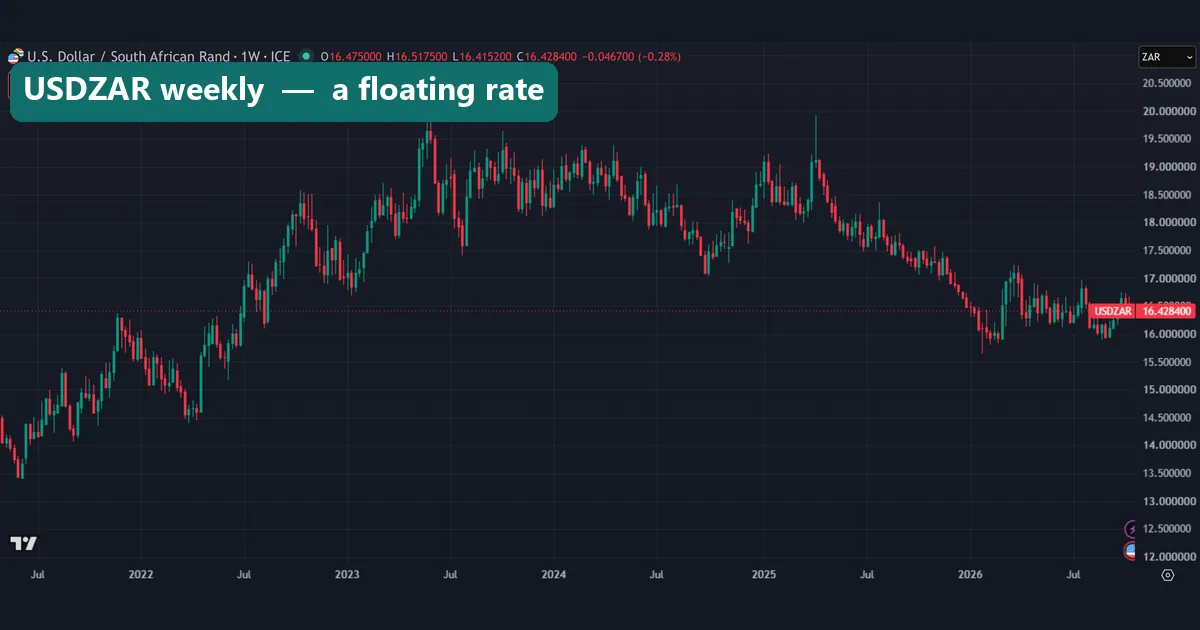
The rand chart looks like a normal traded market. USDZAR swings between about 13.5 and 20 across the window, with wide weekly candles in both directions. It stood at 16.4284 on our capture. The rand gained 5.7% over the past year but lost 9.8% over five, and its three pegged neighbours share that path. Traders often group the rand with commodity currencies, since metals loom large in South Africa’s exports.
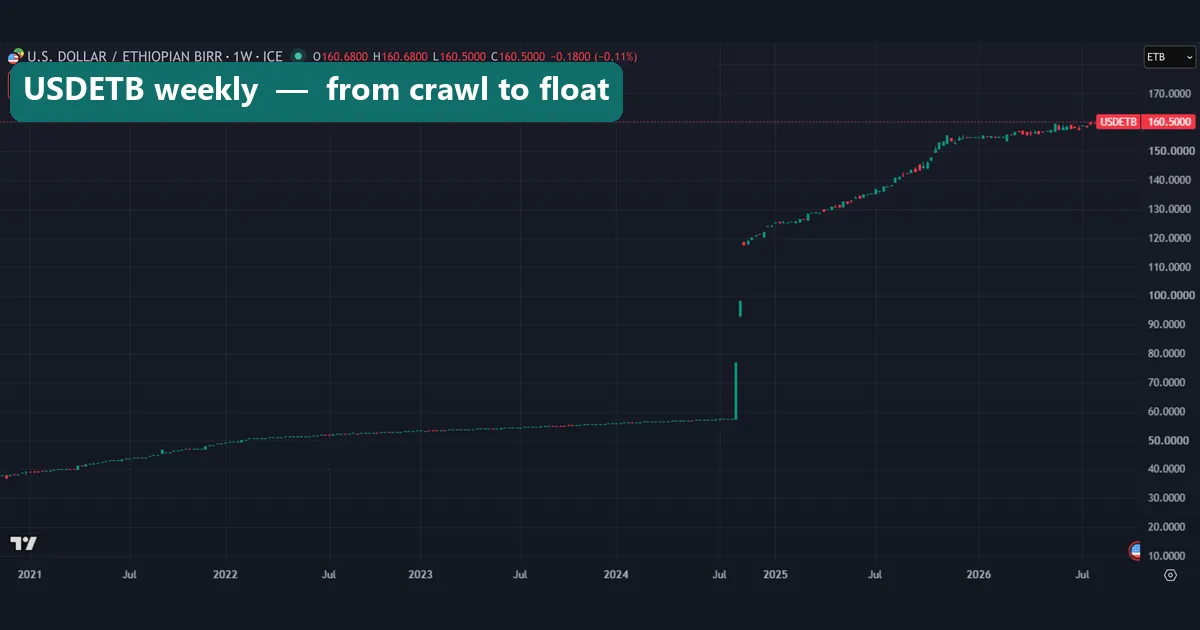
The birr chart tells a different story. From 2021 to mid-2024, USDETB climbs in a slow, steady line from about 37 to about 57. That smooth slope is the shape of a crawling, managed rate. Then, in late July 2024, the line breaks: a few bars carry it past 100 and on to about 120. Since then it has climbed to 160.50. The break marks Ethiopia’s move to a market-based rate, and most of the 71.0% loss came after it.
Common mistakes with African currency data
Mistake 1: reading the quote upside down. USDNGN rising means the naira falls, and a long USDZAR position gains when the rand weakens.
Mistake 2: calling a currency weak because of a big count. The Guinean franc needs 8,807 units per dollar, yet it gained value over five years. Judge weakness by the change, not the zeros.
Mistake 3: analysing a peg as if it floats. USDXOF has no life of its own. It is EUR/USD turned upside down and scaled by 655.957, so study the euro instead.
Mistake 4: treating the quoted rate as the rate you can get. Where a parallel market exists, as in Sudan, the quoted rate can sit far from real trades. Spreads on exotic pairs also run wide, and our page on why spreads widen covers the mechanics.
Where to go next
For the global top of the value table, read our guide to the most valuable currency in the world. For the forces behind long falls, read how interest rates affect forex and central bank rate decisions.
Our dollar index guide covers the other side of every quote. If you trade, start with the major currency pairs. Then read about volatile forex pairs before you try an exotic one.
FAQ about African currencies
How many currencies does Africa have?
Our data covers 38, and a few more sit outside our set. Africa has more countries than currencies, because each CFA franc serves several states.
What is the strongest African currency?
By value per unit, the Tunisian dinar, worth 0.33389 dollars on 18 October 2026. The Libyan dinar and the Moroccan dirham come next. That says nothing about stability, though: the Libyan dinar lost 15.5% over the past year.
What is the weakest African currency?
By units per dollar, the Guinean franc at 8,807. By loss of value over about five years, the Egyptian pound and the Ethiopian birr, both down 71.0%, with the naira close behind at -69.2%.
Which African currencies peg to the euro?
The West and Central African CFA francs at 655.957 per euro, the Comorian franc at 491.968, the Cape Verdean escudo at 110.265 and the dobra at 24.5. Against the dollar, all of them move with EUR/USD.
Does the South African rand float?
Yes. The South African Reserve Bank runs a floating rate but may step in to smooth abrupt moves. Its three pegged neighbours move with it.
Why did the naira and the Egyptian pound fall so much?
Our data shows how, not why. Both fell in a few large steps: USDNGN jumped in mid-2023 and early 2024, and USDEGP stepped up through 2022 and early 2023, then again in early 2024.
Can I trade African currencies on MT4 or MT5?
That depends on your broker. USDZAR is the African pair you are most likely to find, and others are rare. Where they exist, expect wider spreads and swap costs than on the majors.
Does a big fall mean a currency will bounce back?
No. The cedi won back part of its fall in 2025, while the birr kept sliding after its 2024 break. Our numbers describe the past only, and results are not guaranteed; past performance is not indicative of future results.
Last updated: 19 October 2026.

About the author
Written by Dominic Walsh, a Forex trader and MT4/MT5 indicator, Expert Advisor and script developer. Every tool on forexmt4systems.com is tested on live charts before release and ships with ready-to-use compiled MT4 (.ex4) and MT5 (.ex5) files. Learn more about the trader and developer behind this site.
How we build, test and correct every tool: Editorial & Testing Policy. Trading carries risk; see the disclaimer.