
The Honduras lempira has lost about half its value against the US dollar since 1997. It lost it slowly, in small steps. This guide settles three things. First, how far it fell: from 13.17 to 26.8745 lempiras per dollar over 29 years of daily quotes. Second, why the chart went flat for years and then started to climb again in August 2011. Third, which bars on a USD/HNL chart to ignore, since some of the biggest moves are data errors.
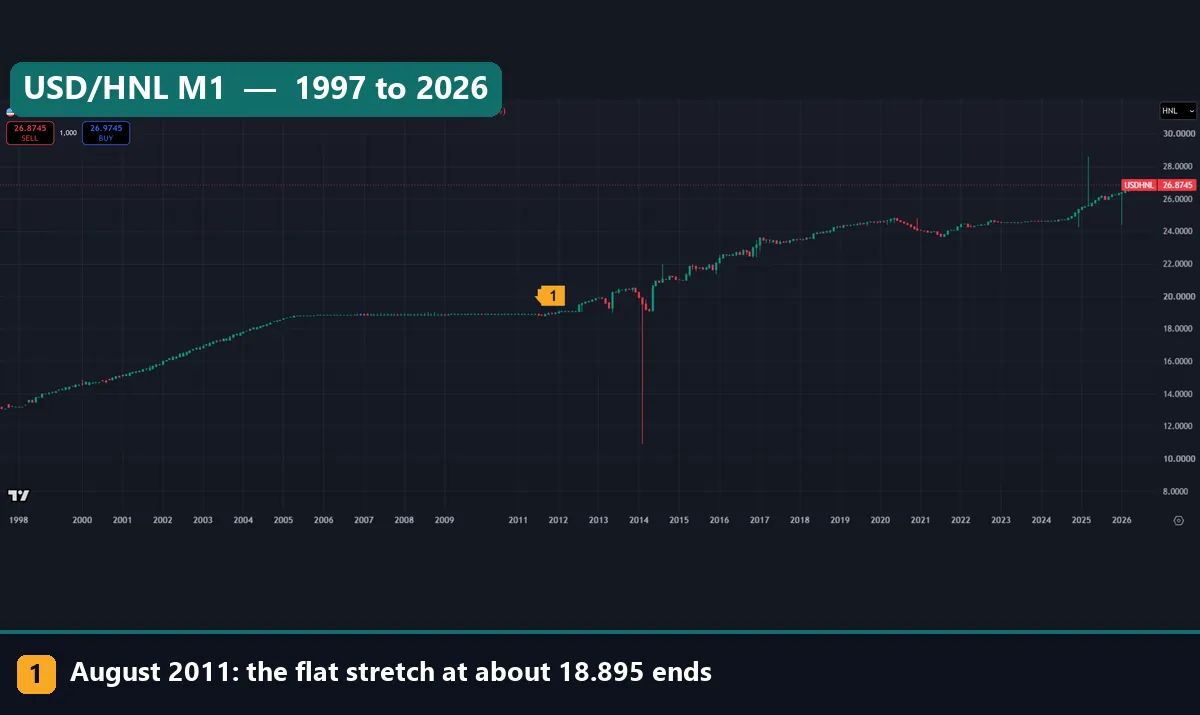
The monthly chart shows the whole story: the line climbs, goes flat, then climbs again. Marker 1 shows where the flat stretch near 18.895 ends, in August 2011. Two bars are bad data: the 2014 wick to about 11 and the 2025 spike to about 28.59. Never read a level off them.
What the Honduras lempira is
The lempira is the national currency of Honduras. Its code is HNL and its numeric code is 340. It uses two decimal places, according to the ISO 4217 code lists published by SIX, the standard’s official maintenance agency. On charts the pair shows up as USD/HNL: the number of lempiras one US dollar buys.
The issuer is the Banco Central de Honduras, or BCH. The Banco Central de Honduras website shows its “Tipo de Cambio de Referencia”, or reference rate. Like nearly all money today, the lempira is a fiat currency. Its value rests on policy and trust, not on gold.
Keep the direction straight. When USD/HNL rises, the lempira loses value. To turn two quotes into a change for the lempira, use this formula.
change in the lempira's dollar value = old USD/HNL / new USD/HNL - 1
For example, 13.17 / 26.8745 – 1 = -0.510, a loss of 51.0%. Over the same years the dollar rose 104% in lempiras, but the lempira fell 51%, not 104%.
How the BCH sets the lempira’s rate
Honduras does not let the lempira float freely. The IMF’s 2018 Article IV annex for Honduras calls the official setup a crawling band since July 2011. In that month the BCH brought back a band that had run until mid-2005. In practice, the IMF classed it as a crawling peg. Cut down from the IMF’s text, it works like this:
- The BCH runs foreign exchange auctions, and those auctions set the rate.
- Every bid must sit within 7% above or below a “base price” that the BCH sets each week.
- The base price follows the inflation gap with trading partners, their currencies against the dollar, and the BCH’s reserves.
- Each day the BCH turns the accepted bids into an official rate, as a weighted average, for use the next day.
As a formula, the auction limit reads bid range = base price x 0.93 to base price x 1.07. The IMF says “the lempira has followed a slow depreciating trend against the U.S. dollar”. Our data agrees. That text dates from 2018, so check the BCH for the rules in force today. Our guide on whether central banks trade forex covers managed rates in general.
How we tested
We pulled FX_IDC:USDHNL on the TradingView web chart on 6 November 2026. The daily history runs from 20 August 1997 to 5 November 2026. We left out bars dated 6 November, which were still forming. TradingView’s USD/HNL symbol page lists the pair, and the chart header names ICE as the source. So this is a reference quote, not a tradable price.
First, we dropped four bad closes: 11 August 2014, 16 January 2017, 13 December 2024 and 15 January 2026. Each was a one-day break that reversed the next day. Then we measured the change in the lempira’s dollar value from each year-end close to the next. We also found the longest flat stretch: daily closes within 0.5% of the run’s first close. Last, we counted the days with no change.
We checked every chart reading here against our stored daily bars. We ran no trade test and did not use MetaTrader 4. So every figure comes before spread, swap, financing and commission. Our editorial testing policy explains how we handle such data. The bar and line charts below are our own measurement.
The numbers that define the lempira
| Parameter | Value | Source |
|---|---|---|
| Currency code | HNL, numeric 340, two decimals | ISO 4217, SIX |
| Official regime | Crawling band since July 2011 | IMF, 2018 |
| Regime in practice, 2018 | Crawling peg | IMF, 2018 |
| Auction bid limit | 7% either side of a weekly base price | IMF, 2018 |
| First and last daily close | 13.17 (20 August 1997), 26.8745 (5 November 2026) | Our bars |
| Change in the lempira’s dollar value | -51.0% since 1997, -8.4% since 2 January 2024 | Our bars |
| Longest flat stretch | 18.80 to 18.91, 18 December 2006 to 3 August 2011 | Our bars |
| Days with no change | 48.0% | Our bars |
| Median daily move, ignoring sign | 0.00%, or 0.01% since 2024 | Our bars |
With close to half of all days unchanged, the median move rounds to zero.
Reading USD/HNL on a chart
The weekly chart below zooms in on the flat years.
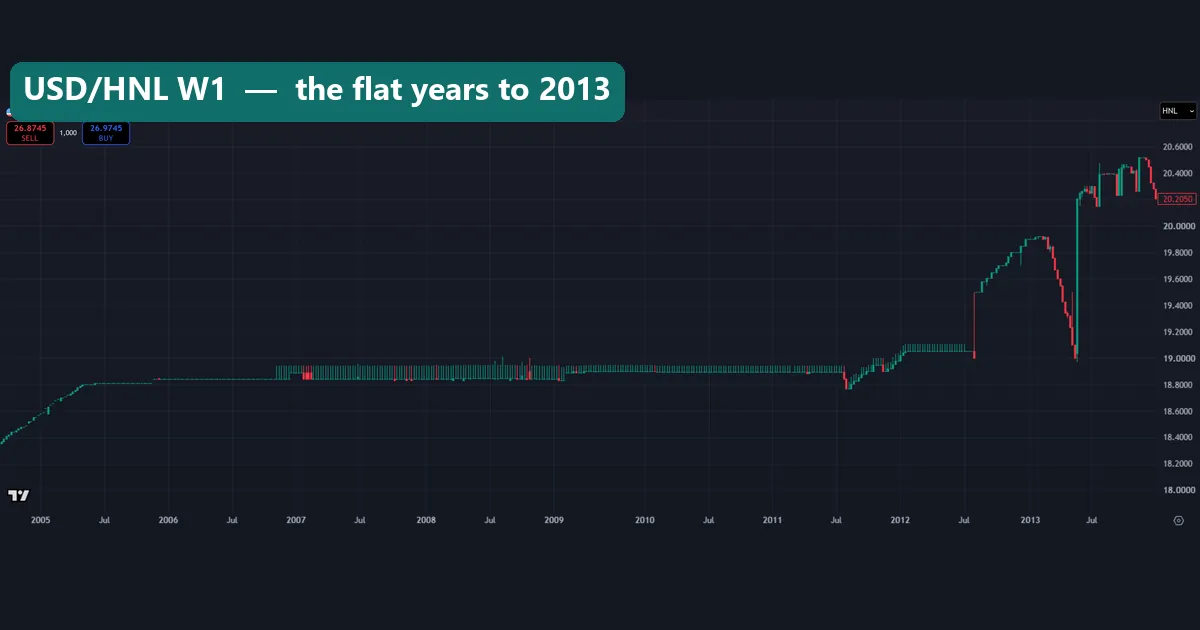
The rate ended 2005 at 18.84 and 2010 at 18.895. In between, the weekly bars barely move. Our strict rule runs the flat stretch from 18 December 2006 to 3 August 2011. It starts when the quote stepped up to about 18.89. That gives 1,063 trading days with every close between 18.80 and 18.91. The IMF’s date for the band’s return, July 2011, sits right at its end.
Then the crawl starts. The quote ended 2011 at 18.98 and 2012 at 19.90, a 4.6% fall for the lempira.
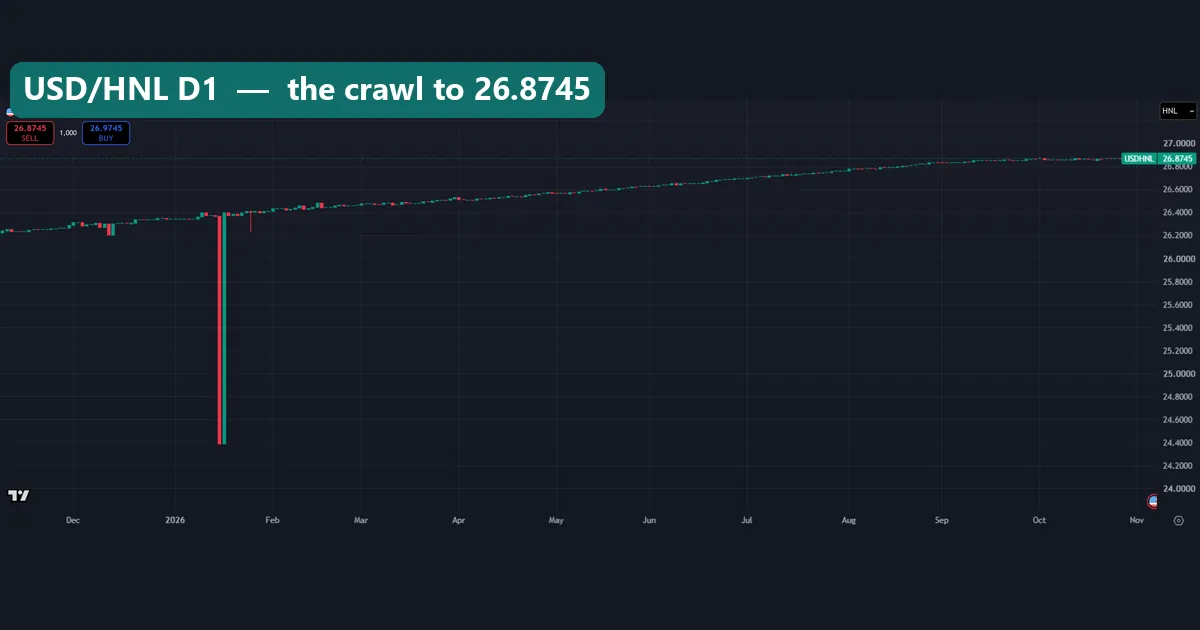
The daily chart shows the present. From early November 2025 to 5 November 2026 the bars climb in small, even steps to 26.8745. One long bar in mid-January 2026 breaks the pattern. It is the bad close of 15 January 2026, at 24.3873, which we dropped. The next bar opens there and closes back near 26.40. Together they draw a deep notch that never happened. Our guide to candlestick wicks explains what a normal wick means. This is not one.
The jumps of 2013 and 2014
The two biggest daily moves both look like a stale quote catching up. On 22 May 2013, USD/HNL rose 6.5%, from 18.97 to 20.20. On 13 May 2014, it rose 8.0%, from 19.10 to 20.63. Read alone, they look like sudden devaluations.
But before each jump, the quote drifted the wrong way. On the weekly chart above, early 2013 slides from near 19.9 back to about 19.0. It looks as if the lempira gained, and then comes the leap. In 2014 the drift was larger. The rate ended 2013 at 20.25, yet showed 19.10 on the day before the jump. That is a 6.0% gain for the lempira in just over four months. Yet the IMF says this system produced a slow slide.
So we do not count these as market moves. We think the feed stopped tracking the official rate, then caught up. We cannot prove that from these bars, and we found no BCH or IMF source on those two days. They also top our list of biggest monthly moves: May 2014 (+8.1%) and May 2013 (+5.1%).
Worked example: 10,000 lempiras in dollars
Convert 10,000 lempiras at four closes from our data. The sum is dollars = lempiras / USD/HNL.
| Date | USD/HNL close | 10,000 lempiras in US dollars |
|---|---|---|
| 20 August 1997 | 13.17 | $759.30 |
| Flat stretch, 2006 to 2011 | 18.895 (typical rate) | $529.24 |
| 2 January 2024 | 24.6225 | $406.13 |
| 5 November 2026 | 26.8745 | $372.10 |
Across the table, the same notes lost $387.20 of dollar value, or 51.0%. Over 29.2 years that works out to about 2.4% a year, compounded. The recent pace is faster. Since January 2024 the value fell from $406.13 to $372.10, or 8.4% in under three years. That is roughly 3% a year.
These are conversions at a reference quote. A bank would add its own margin, and our page on the spread in forex explains that cost. Our currency converter runs the same sum for other pairs.
Year by year: what our two data charts show
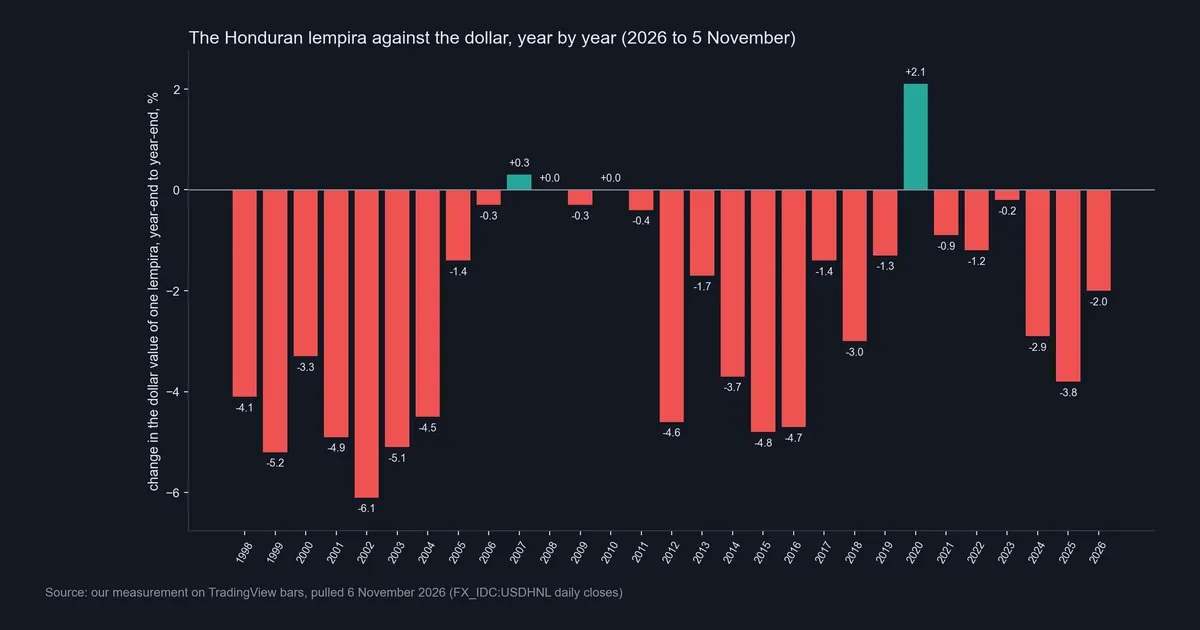
This chart shows the yearly change in one lempira’s dollar value. Of the 29 years shown, the lempira lost value in 25. It gained in just two, 2007 (+0.3%) and 2020 (+2.1%). Both 2008 and 2010 ended flat to one decimal, and 2026 only runs to 5 November.
Before the flat stretch, the worst years were 2002 (-6.1%), 1999 (-5.2%) and 2001 (-4.9%). After the band returned came 2015 (-4.8%), 2016 (-4.7%) and 2012 (-4.6%). Lately the pace picked up: -2.9% in 2024, -3.8% in 2025 and -2.0% so far in 2026.
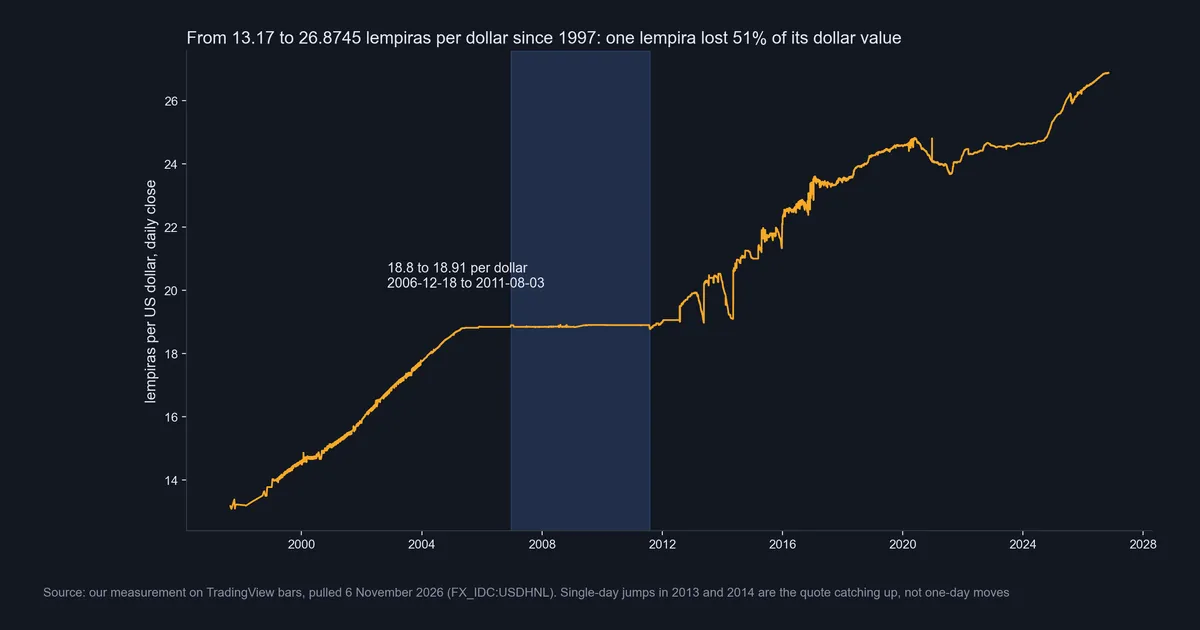
This line plots every daily close, with the flat stretch shaded. The slope is steeper from 1997 to 2005 than from 2012 on, which fits the yearly bars. The jagged bits in 2013 and 2014 are the two catch-up jumps. By contrast, the dip of 2020 and 2021 looks like a genuine move. The line slides from near 24.8 to below 24 over many months.
What the slow crawl means for a trader
For most traders, very little. The quote did not change on 48.0% of days. Even since 2024, the median daily move is only 0.01%. Volatility tools such as ATR shrink toward zero on bars like these, until one bad print blows them up.
The trend comes from policy, not from a crowd of buyers and sellers. Since the base price follows the inflation gap, inflation is the thing to watch. Our guide on how inflation affects forex covers the link. Holders also face the interest rate differential. We have no Honduran rate data, so we make no claim on it.
Download the complete indicator database
Put these concepts on your charts. One email unlocks the full library of 1,380+ indicators with compiled MT4 and MT5 files, plus my TradingView scripts. No paywall, no spam, unsubscribe any time.
Get free access to my indicator database
One email unlocks 1,380+ free MT4, MT5 and TradingView indicators — the complete library. No single-tool download; you get the whole database.
Where it fails
Our numbers describe one reference feed, and they break in several places.
- A reference quote is not a deal price. Nobody has to fill an order at the FX_IDC level, and a real exchange adds a margin.
- The feed lags and jumps. Besides 2013 and 2014, the quote rose 3.0% to 24.805 on 22 December 2020, yet the year still ended at 24.0631.
- Single prints wreck highs and lows. The wick to about 11 and the spike to about 28.59 would ruin any stop test or range tool.
- Year-end figures hide the path. The lempira lost 0.9% across 2021, yet the rate dipped below 24 in mid-year.
- The rules can change. Our system description dates from 2018. Policy can alter the band at any time.
- Past drift is not a forecast. Twenty-five losing years do not tell you what next year brings.
The last few years on weekly and monthly bars
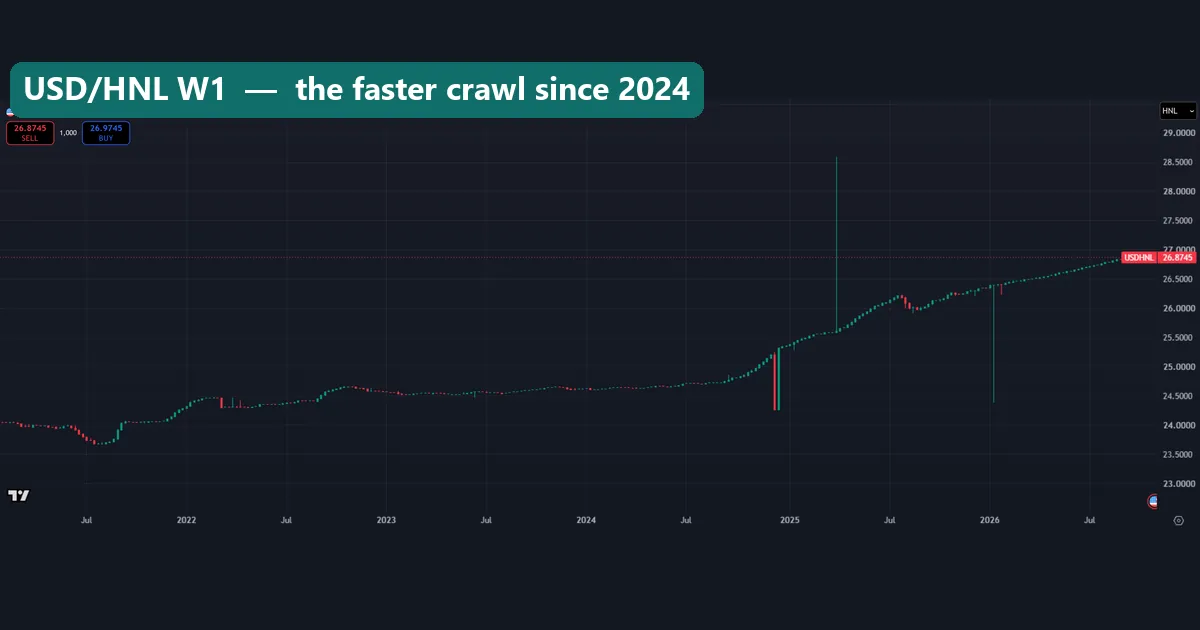
The weekly chart covers February 2021 to November 2026. It starts with the dip of mid-2021 to about 23.7. Next comes a slow climb to about 24.6 and a nearly flat run into mid-2024. From late 2024 the bars turn steeper and rise to 26.8745. Three long wicks cut across it. December 2024 dips to about 24.26, the bad close of 13 December. March 2025 spikes to about 28.59, and January 2026 drops to about 24.39. All three are data errors.
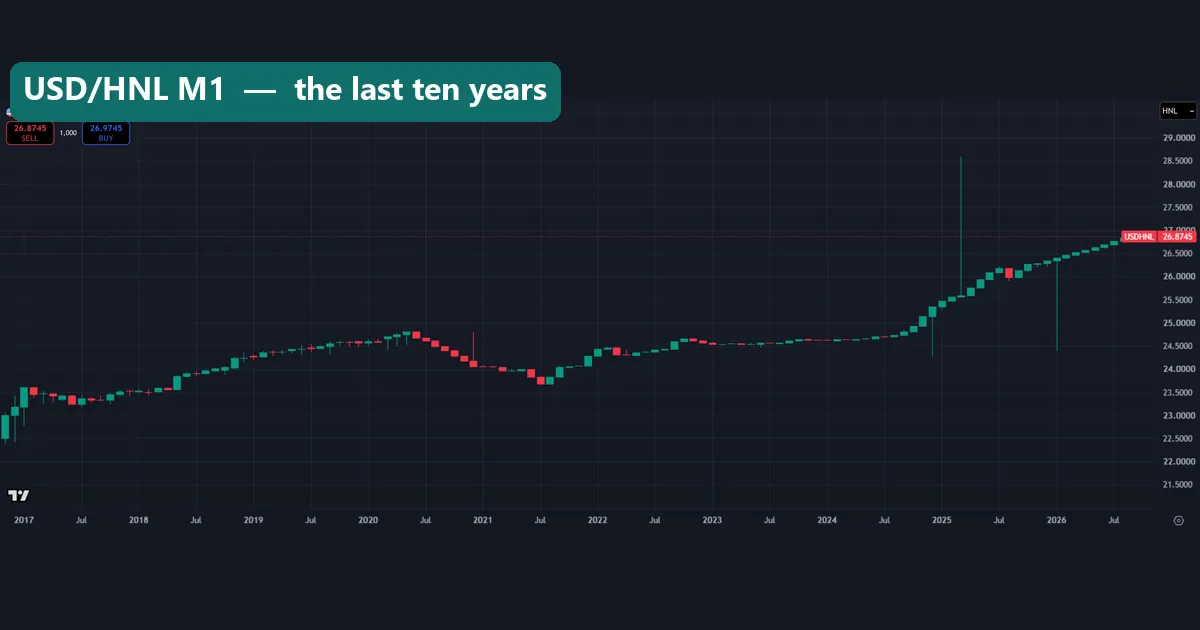
The monthly chart stretches the same story over ten years. The climb runs to about 24.8 in mid-2020. Then the lempira gains, to 24.0631 at the end of 2020 and about 23.7 by mid-2021. A flat stretch to mid-2024 follows, then the steeper rise. Read the candle bodies here, not the thin wicks.
Common mistakes with the Honduras lempira
- Mixing up the two directions. The dollar gained 104% since 1997, but the lempira lost 51%.
- Reading the 2013 and 2014 jumps as devaluations. Both came after months in which the quote drifted the wrong way.
- Quoting the chart boxes. The O/H/L/C row and the SELL and BUY boxes on our captures show the live quote on capture day, not the bars on screen.
- Taking levels off wicks. The lows near 11 and 24.3 and the high near 28.59 never showed up in the closes around them.
Where to go next
Start with the weakest currency in the world. That guide ranks 33 currencies, so you can see where a slow loser like the lempira sits. The Egyptian pound, the GHC currency and Sri Lanka rupees each lost over 90% against the dollar in our data.
For fixed links that held, compare the Macau patacas tie to the Hong Kong dollar, or our BGN currency guide. For the dollar side, see the dollar index in forex. To judge a feed, read our guide to real-time data on TradingView.
FAQ about the Honduras lempira
What is the currency code for the Honduras lempira?
The code is HNL and the numeric code is 340, with two decimal places in the ISO 4217 list.
How many lempiras are there to a US dollar?
The last close in our data was 26.8745 on 5 November 2026. Check the BCH reference rate before you change money, since a bank will quote its own price.
How much value has the lempira lost against the dollar?
One lempira lost 51.0% of its dollar value from 20 August 1997 to 5 November 2026. Since 2 January 2024, it lost 8.4%.
Does the lempira have a fixed peg to the dollar?
No. The IMF’s 2018 text calls it a crawling band since July 2011, and a crawling peg in practice.
Why was the lempira flat from 2006 to 2011?
Our closes sat between 18.80 and 18.91 from 18 December 2006 to 3 August 2011. The IMF says the band ran until mid-2005 and came back in July 2011. The flat years fall in that gap, and the IMF gives no reason, so we offer none.
Did the lempira really fall 8% in one day in 2014?
We do not think so. The quote had first drifted from 20.25 to 19.10. So the jump of 13 May 2014 looks like the feed catching up.
Can I trade USD/HNL?
We ran no trade test, and we make no claim about who offers the pair. Standard tools tell you little on a quote this quiet.
Will the lempira keep losing value?
We cannot say, and we make no forecast. It lost value in 25 of the 29 years we measured, but that rests on policy, and policy can change. Treat this as history: results are not guaranteed; past performance is not indicative of future results.
Last updated: 6 November 2026.

About the author
Written by Dominic Walsh, a Forex trader and MT4/MT5 indicator, Expert Advisor and script developer. Every tool on forexmt4systems.com is tested on live charts before release and ships with ready-to-use compiled MT4 (.ex4) and MT5 (.ex5) files. Learn more about the trader and developer behind this site.
How we build, test and correct every tool: Editorial & Testing Policy. Trading carries risk; see the disclaimer.