
GHC currency is a label that outlived its code. GHC was the ISO code for Ghana’s old cedi, and the money in use today carries the code GHS. One US dollar bought 0.8808 cedis in July 2007 and 11.63 on 3 November 2026, so one cedi lost 92.4% of its dollar value. This guide settles three things: what the code change meant, how far the cedi fell and bounced, and which parts of its chart you should not trust.
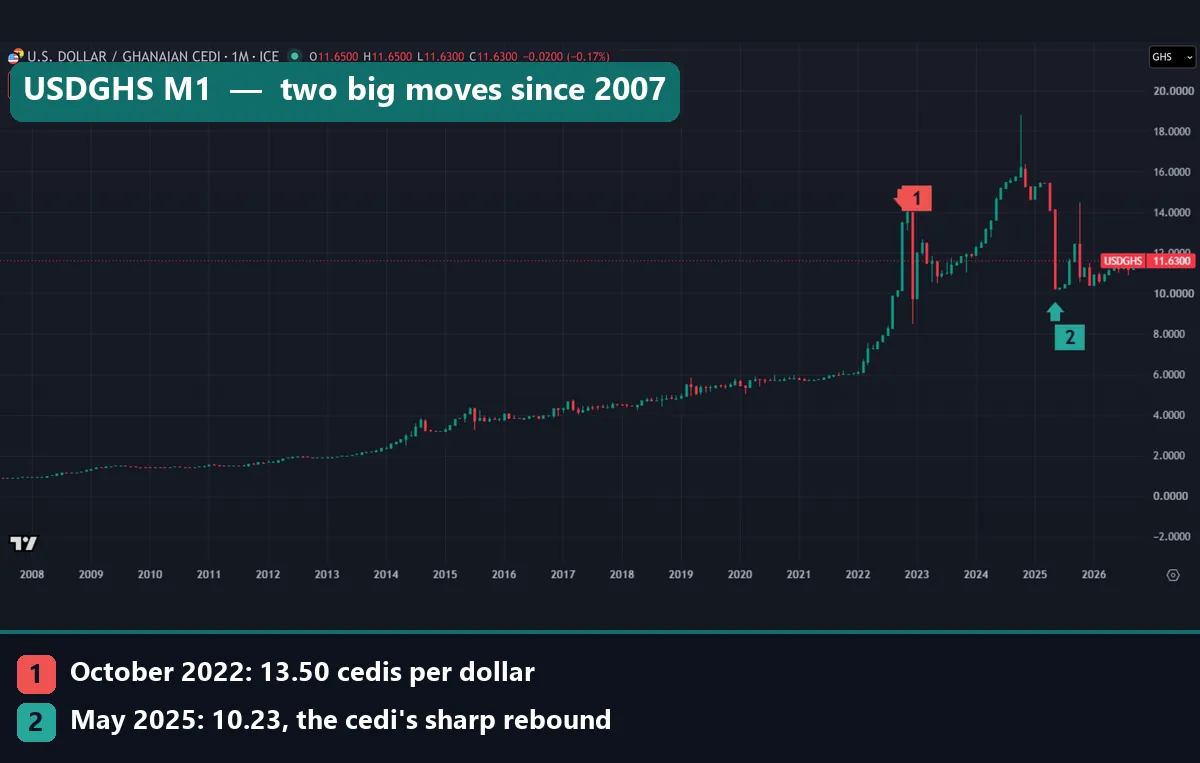
The quote drifts up for years, then turns wild after 2021. Marker 1 is October 2022, which closed at 13.50 cedis per dollar, and marker 2 is May 2025, which closed at 10.23. The tall thin wicks near 18.8 in late 2024 and 14.5 in late 2025 are data errors.
What the GHC currency is: the old code and the new one
The cedi is Ghana’s national money, and the Bank of Ghana issues it. As a fiat currency, its value rests on policy and trust, not a fixed claim to metal.
In July 2007 Ghana cut four zeros. The Bank of Ghana’s 2006 annual report sets out the plan: ¢10,000 = GH¢1 = 100 Gp, where Gp is the pesewa. The bank’s reason is plain: years of high inflation had left prices with too many digits, which made cash, bookkeeping and ATMs harder to run.
Value did not change. The report’s own example turns ¢9,200 per dollar into GH¢0.92, so the step only moved the decimal point. That is also why our chart starts below 1 cedi per dollar.
The codes followed. SIX’s ISO 4217 currency code lists, from the official maintenance agency, show GHS (numeric 936) as current and GHC (numeric 288) as withdrawn in January 2008. Search traffic still says GHC, and even the bank’s 2006 text says “the sub unit of GHC is the Ghana Pesewa”. In short, use GHS on a chart, and divide any GHC figure from before July 2007 by 10,000.
How the USDGHS quote works
Charts show the pair as USDGHS: the number of cedis that one US dollar buys. So a rising line means a weaker cedi. To get the cedi’s own value, flip the quote.
value of one cedi (USD)  = 1 / USDGHS
change in the quote (%)  = (new quote / old quote - 1) x 100
change in cedi value (%) = (old quote / new quote - 1) x 100
These two percentages never match, and bigger moves widen the gap. In October 2022 the quote rose 33.1%, from 10.144 to 13.50, yet one cedi lost 24.9% of its dollar value. In December 2022 the quote fell 30.4%, from 14.00 to 9.75, so the cedi gained 43.6%.
How we tested
We read FX_IDC:USDGHS, an ICE reference series, on the TradingView web chart and pulled the bars on 3 November 2026. Monthly bars start in July 2007, and daily bars run from 2 July 2007 to 3 November 2026. We also took weekly captures for two zooms.
Next we cleaned the data. Any daily print more than 12% from its 11-day median counted as an error, and monthly prints below 0.5 went out too. Two daily prints failed: 18.81 on 4 October 2024 and 14.50 on 1 October 2025. TradingView still draws both, so they appear in our captures, but our figures leave them out.
Our MetaTrader 4 history (Capital Point Trading, build 1471) holds 23 FX pairs, and none is a cedi pair, so MT4 played no part. We placed no trades either, so every figure is a price change before spread, swap, financing and commission. Our editorial testing policy explains how we collect and report numbers like these.
Measurement settings
| Setting | What we used |
|---|---|
| Data source | FX_IDC (ICE) on the TradingView web chart |
| Symbol | USDGHS: cedis per 1 US dollar |
| Monthly bars | July 2007 to November 2026 |
| Daily bars | 2 July 2007 to 3 November 2026 |
| Yearly change | Year-end close to year-end close; 2026 to date |
| Daily error rule | More than 12% from the 11-day median |
| Monthly error rule | Prints below 0.5 |
| Costs | None modelled; no trades placed |
The 12% line is our own choice. Only two prints failed it in 19 years. A tighter line could cut real moves, because this pair has moved more than 30% in one month.
Reading the weekly chart: 2023 to now
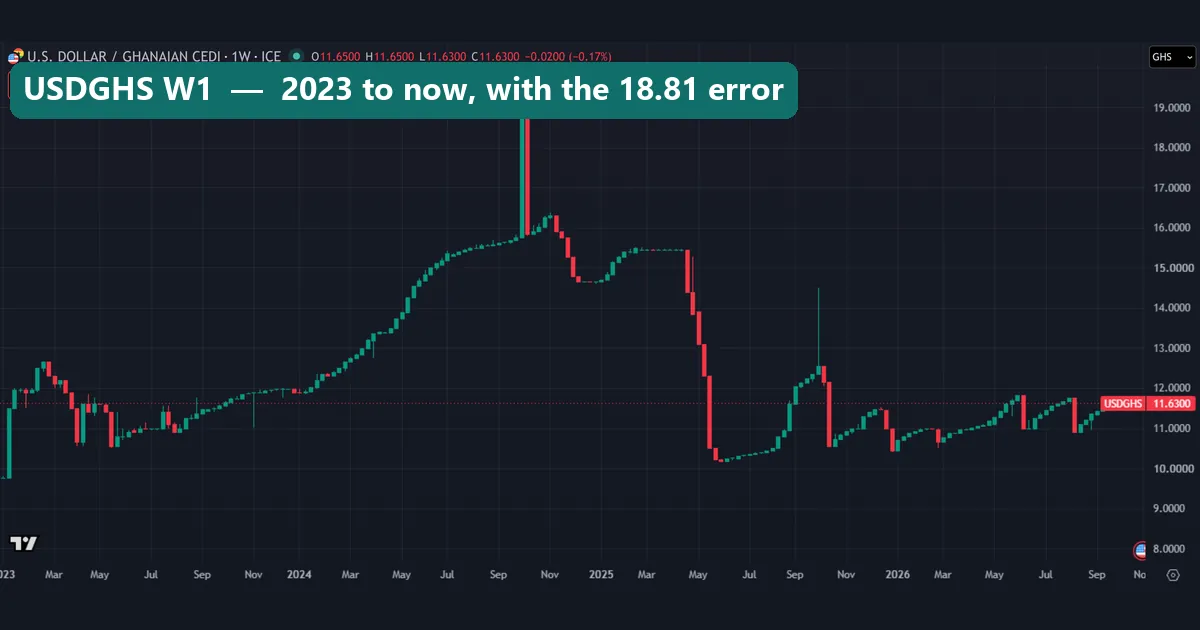
This capture runs from early 2023 to November 2026. A warning for every capture here: the top row, the SELL and BUY boxes and the dotted 11.63 line show the quote on capture day, not the bars in view.
Now find the two tall bars near 18.81 in October 2024. A green bar shoots up and a red bar drops straight back. That is the bad print, not a market move. It shows full bodies here because 4 October 2024 was a Friday, so the bad price became that week’s close. The 14.50 error stays a thin wick. Our guide to candlestick wicks covers what a normal wick tells you, and these two tell you nothing.
The quote climbs from about 12 at the start of 2024 to about 15.7 by September, and its weakest clean close, 16.35, came on 7 November 2024. It holds near 15.45 in early 2025. Since the slide of April and May, the candles have stayed between 10.17 and about 12.5.
Reading the 2022 swing
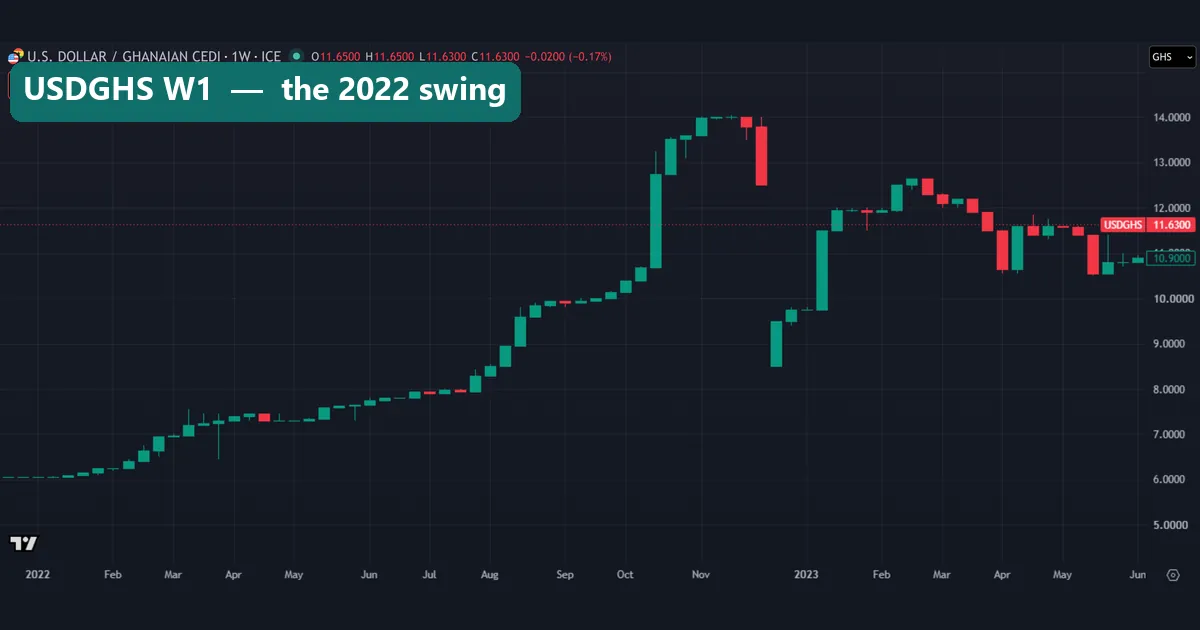
This weekly zoom covers January 2022 to June 2023, the wildest stretch in our data. The quote starts near 6 and climbs through the year. August adds 19.3% in one month, October adds 33.1%, and by the end of November it reads 14.00.
Then the chart breaks. A red week ends near 12.5, and the next bar starts near 8.5, with empty space between them. December closes at 9.75, but January 2023 adds 23.1% and takes the quote back to 12.00.
The IMF’s July 2025 debt sustainability analysis for Ghana gives the background. It says Ghana lost access to international capital markets in late 2021, struggled to roll over domestic debt, and fell into an acute crisis in 2022. Inflation reached 54% in December 2022, and reserves fell to US$1.4 billion by year-end. The government also launched its domestic debt exchange in early December 2022, the same month as that bar. Still, we found no source that pins the swing on one cause, so we do not either.
Worked example: 1,000 cedis in dollars
Take 1,000 Ghana cedis held as cash from July 2007. At 0.8808 they were worth 1,135.33 dollars. At 11.63 on 3 November 2026 they were worth 85.98 dollars, which is the 92.4% loss. Over the same span the quote rose 13.2 times, or about 1,220%. Both numbers are true, so check which one a headline reports.
Now run the rebound. At the end of 2021 the rate was 6.049, so 1,000 cedis bought 165.32 dollars. By the end of 2024 the rate was 14.65, and they bought 68.26, a 58.7% loss in three years. Then 2025 brought a 40.9% gain, and at 10.40 the same notes bought 96.15 dollars.
That still sits 41.8% below the end of 2021, because a gain works from a smaller base. Undoing a 58.7% loss takes a gain of about 142%. You can repeat these sums with our currency converter.
Year by year: ten down, one up
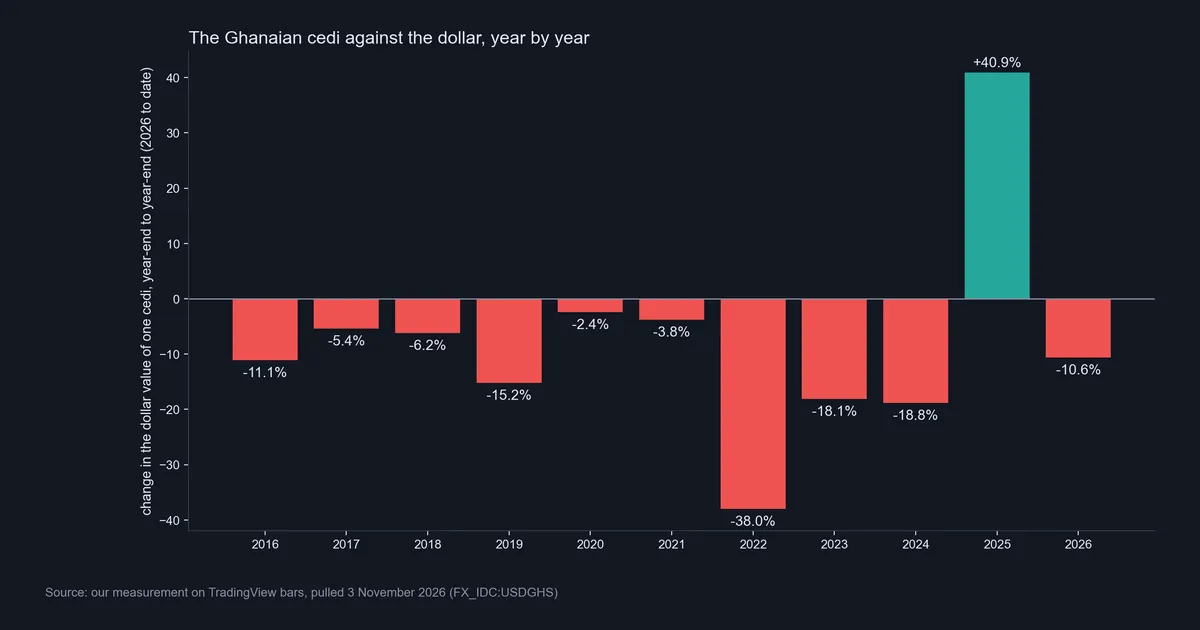
Our first data chart shows the change in one cedi’s dollar value for each calendar year since 2016. Ten of the eleven bars are red. The worst is 2022 at -38.0%, then 2024 at -18.8% and 2023 at -18.1%. Only 2025 is green, at +40.9%, and 2026 so far stands at -10.6%.
Treat the 2022 bar with care, though. December 2022 closed at 9.75, right at the bottom of a swing. One month earlier the reading was 14.00, a 56.8% loss on the year, and one month later it was 12.00. So -38.0% understates the worst of it.
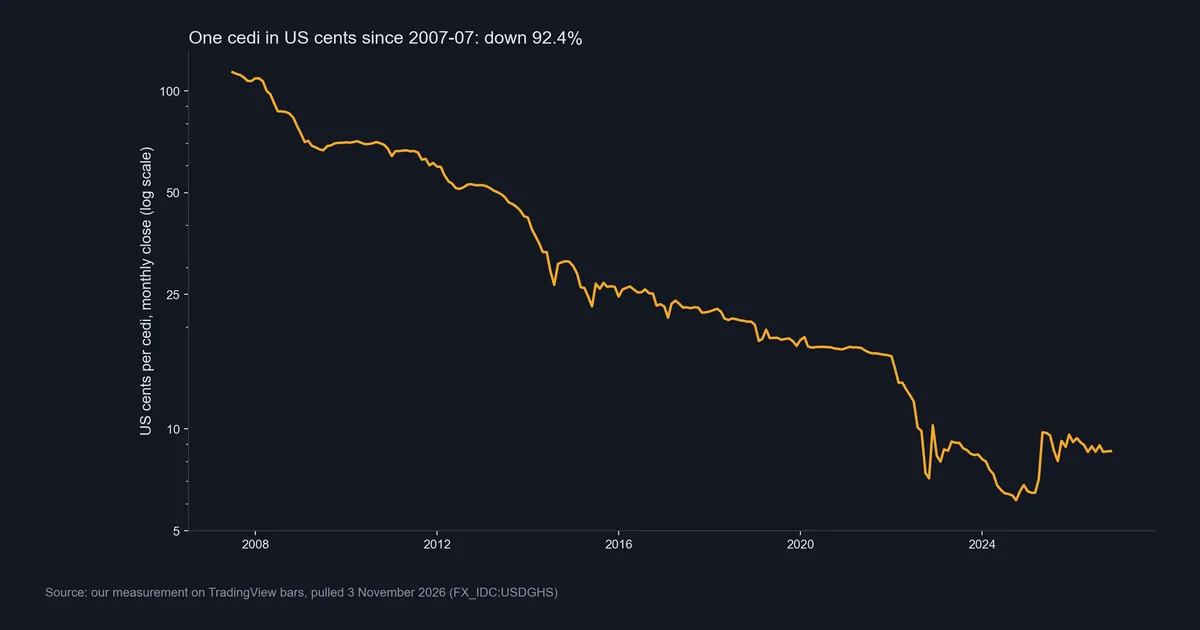
The second chart plots one cedi in US cents on a log scale, where equal distances mean equal percentage moves. It starts above 100 cents and ends near 8.6. On this scale the 2025 jump is a small step in a long slide. Our weakest currency in the world rankings judge money the same way, by the value it loses.
Download the complete indicator database
Put these concepts on your charts. One email unlocks the full library of 1,380+ indicators with compiled MT4 and MT5 files, plus my TradingView scripts. No paywall, no spam, unsubscribe any time.
Get free access to my indicator database
One email unlocks 1,380+ free MT4, MT5 and TradingView indicators — the complete library. No single-tool download; you get the whole database.
Where it fails
First, these are reference quotes, not prices you can deal at. A bank counter or a street dealer can quote a different rate, and we have no data on those rates.
Second, our cleaning rule can be wrong. We removed two prints by rule, without checking each against a second source, and smaller errors may remain.
Third, causes sit outside this data. Our charts show when the rate moved, not why. The IMF’s account is one institution’s view, and we report it rather than test it.
Fourth, the dollar is only one yardstick. A falling cedi is not the same as falling buying power at home, although the two are linked, as our guide on how inflation affects forex explains.
Finally, one rebound proves little, since 2025 is the only positive year in our table. Trading costs are missing too, and on an exotic pair they can be large, as our page on why spreads widen shows.
The May 2025 rebound up close
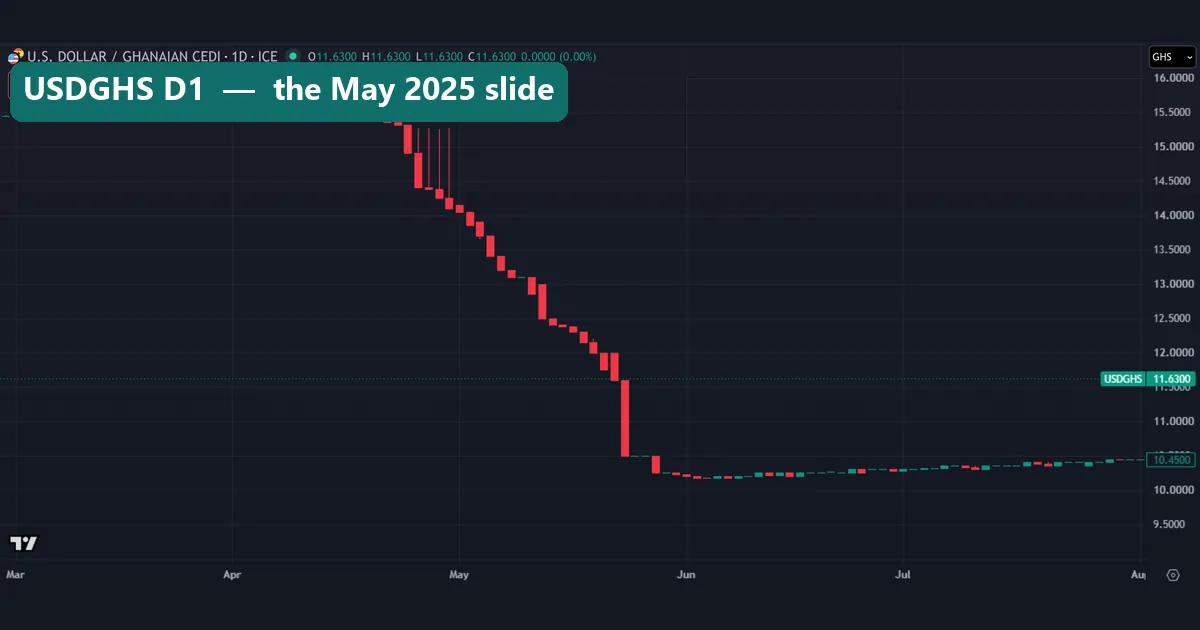
This daily zoom covers March to July 2025. For weeks the quote sits flat near 15.45. Then, from late April, it steps down almost every day, and four thin wicks reach back toward 15.25 that we cannot confirm as real trades. May alone runs from 14.10 to 10.23: the quote fell 27.4%, and the cedi’s value rose 37.8%. The largest bar comes in late May, from about 11.6 to about 10.5. The strongest close, 10.17, arrives on 4 June 2025.
Measured from the weakest close of 16.35, the cedi gained 60.8% in about seven months. The IMF report gives a close match: 60 percent against the dollar between November 2024 and May 2025. It credits a strong external sector and repeated foreign exchange interventions, including about US$2 billion in the fourth quarter of 2024. Our page on whether central banks trade forex explains why a bank steps into its own market.
The report also says the current account benefited from much stronger gold exports and higher remittances. So gold is part of the story, as with other commodity currencies. That describes one episode, not a rule for the next one.
The latest 260 days
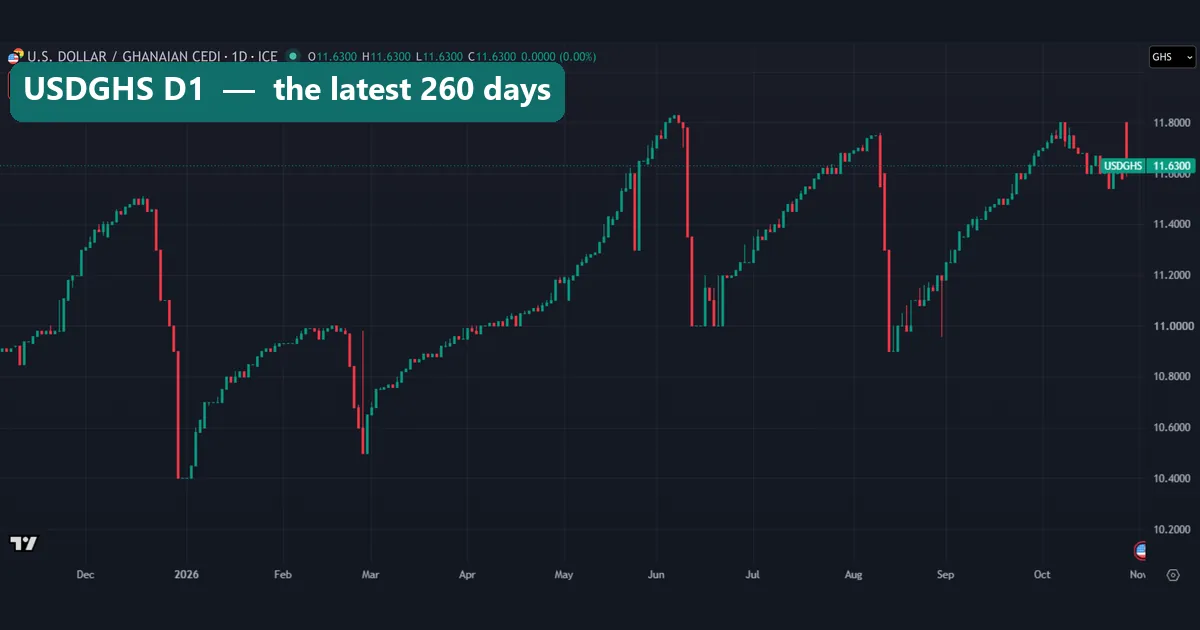
This capture holds the 260 daily bars to 3 November 2026, and its shape repeats. The quote climbs slowly for weeks, then drops within days. We count four clear drops: late December 2025 from about 11.5 to about 10.40, late February 2026 from about 11.0 to about 10.5, June from about 11.82 to about 11.0, and August from about 11.75 to about 10.9.
So each drop is a fast cedi gain, and each climb is a slow cedi slide. We have no source that explains each drop, so we only report the shape. Still, it matters for anyone who judges this pair by range alone, the way a list of volatile forex pairs does.
Common mistakes with GHC and cedi data
Mistake 1: treating GHC and GHS as one unit. A price in old cedis from before July 2007 is 10,000 times too large in current units.
Mistake 2: reading the quote upside down. USDGHS rose from 0.8808 to 11.63, and that is a decline in the cedi. A low value per unit is a separate point, as our guide to the most valuable currency in the world explains.
Mistake 3: quoting the top of the chart. The chart’s peak reads 18.81, and that price is an error. The weakest clean close is 16.35, so a fall measured from 18.81 comes out too large.
Mistake 4: letting one year stand for the whole story. A gain of 40.9% in 2025 sounds like a recovery. Yet at 11.63 the cedi sits 48.0% below its value at the end of 2021.
Where to go next
To check the live quote, open the FX_IDC USD/GHS symbol page on TradingView. It shows the same ICE data we used here. If you are new to the platform, our TradingView chart guide covers the basics.
For the wider picture, our African currencies guide sets the cedi beside its neighbours. Then compare it with the Egyptian pound, which lost a similar share of its value by a different route: long flat stretches, then sudden steps.
FAQ about the GHC currency
Is GHC still a valid currency code?
No. The ISO 4217 historic list shows GHC as withdrawn in January 2008. The current code is GHS, numeric 936.
What is the difference between GHC and GHS?
GHC is the old cedi and GHS is the new one. The Bank of Ghana’s plan set ¢10,000 equal to GH¢1 from July 2007. Only the unit changed, so divide an old amount by 10,000.
How much is one Ghana cedi worth in US dollars?
On 3 November 2026 one dollar bought 11.63 cedis on FX_IDC, so one cedi was worth about 8.6 US cents. That is a reference quote, and a bank or street rate can differ.
How much value has the cedi lost since 2007?
About 92.4% against the US dollar, from 0.8808 cedis per dollar in July 2007 to 11.63 on 3 November 2026.
Why did the cedi rise so much in 2025?
The IMF credits a strong external sector and repeated foreign exchange interventions. It puts the gain at 60 percent from November 2024 to May 2025, and our daily closes show 60.8% from 16.35 to 10.17.
Why does the USDGHS chart show a spike to 18.81?
It is a bad print from 4 October 2024: the price jumps to 18.81 and falls straight back. We removed it under our 12% rule, along with 14.50 on 1 October 2025.
Can I trade USDGHS on MT4 or MT5?
That depends on the broker. Our MT4 history of 23 pairs has no cedi pair, so we ran no MT4 tests. Where a broker lists it, check the spread and the overnight swap first.
Will the Ghana cedi recover?
Our data cannot say. It shows one strong year and ten weak ones across the eleven we measured. Nothing here is a forecast, and results are not guaranteed; past performance is not indicative of future results.
Last updated: 3 November 2026.

About the author
Written by Dominic Walsh, a Forex trader and MT4/MT5 indicator, Expert Advisor and script developer. Every tool on forexmt4systems.com is tested on live charts before release and ships with ready-to-use compiled MT4 (.ex4) and MT5 (.ex5) files. Learn more about the trader and developer behind this site.
How we build, test and correct every tool: Editorial & Testing Policy. Trading carries risk; see the disclaimer.