
A fiat currency is money that a government issues and declares legal tender, with no promise to swap it for gold or any other commodity. The dollar, euro, pound, yen and Swiss franc are all fiat currencies. This guide settles three things. First, what fiat money is and how it replaced gold. Next, how central banks keep it stable. Finally, how much buying power those five currencies lost when we measured them in gold.
What a fiat currency is
The word fiat is Latin for “let it be done”. A fiat currency has value because a state says so, and because people accept it in trade. It is not a claim on a vault of metal. The Bank of England’s explainer on what money is puts it plainly: fiat money is not convertible to gold or any other asset. Its value rests on public trust in the government and in how it runs the economy.
Commodity money works the other way, because a gold coin holds value through its metal. A fiat note costs little to print. Instead, its value sits in what it can buy. The same explainer lists the forms fiat money takes: banknotes, coins, cheques, bank deposits and electronic payments. In the UK, 96% of money exists as bank deposits and only 4% as cash.
From gold-backed money to fiat: 1931 and 1971
For most of the Bank of England’s history, a holder could swap its notes for gold on demand. That link, the gold standard, ended in 1931. Since then, British banknotes have been fiat money.
The world system held on longer. At the 1944 Bretton Woods meeting, 44 countries agreed to tie their currencies to the dollar, and the US tied the dollar to gold. From 1958, other countries could convert dollars to gold at $35 an ounce. Federal Reserve History’s essay on the end of gold convertibility tells what came next. Over time, foreigners held more dollars than the United States had gold.
So on 15 August 1971, President Nixon closed the gold window. Foreign governments could no longer swap dollars for gold, and in the essay’s words the system “turned into a fiat one”. From then on, no fixed gold price anchored the dollar. That makes a gold chart a running scorecard for fiat money.
How a fiat currency holds its value
With no metal behind it, a fiat currency needs a manager: the central bank. It sets short-term interest rates, and those rates steer how much people borrow and spend. In turn, spending feeds into prices. Our guide to central bank rate decisions shows how each meeting moves currencies.
Most big central banks aim for low, steady inflation, not zero. The Federal Reserve’s FAQ on its 2 percent goal says the FOMC sees 2% inflation, measured by the PCE price index, as most consistent with its mandate. The ECB’s monetary policy strategy page sets the same 2% goal over the medium term, uses the HICP, and calls it symmetric.
So the design itself lets a fiat currency lose buying power slowly, by choice. The upside, says the Bank of England, is that the money supply can respond to the economy, while mined gold set the limit under the gold standard.
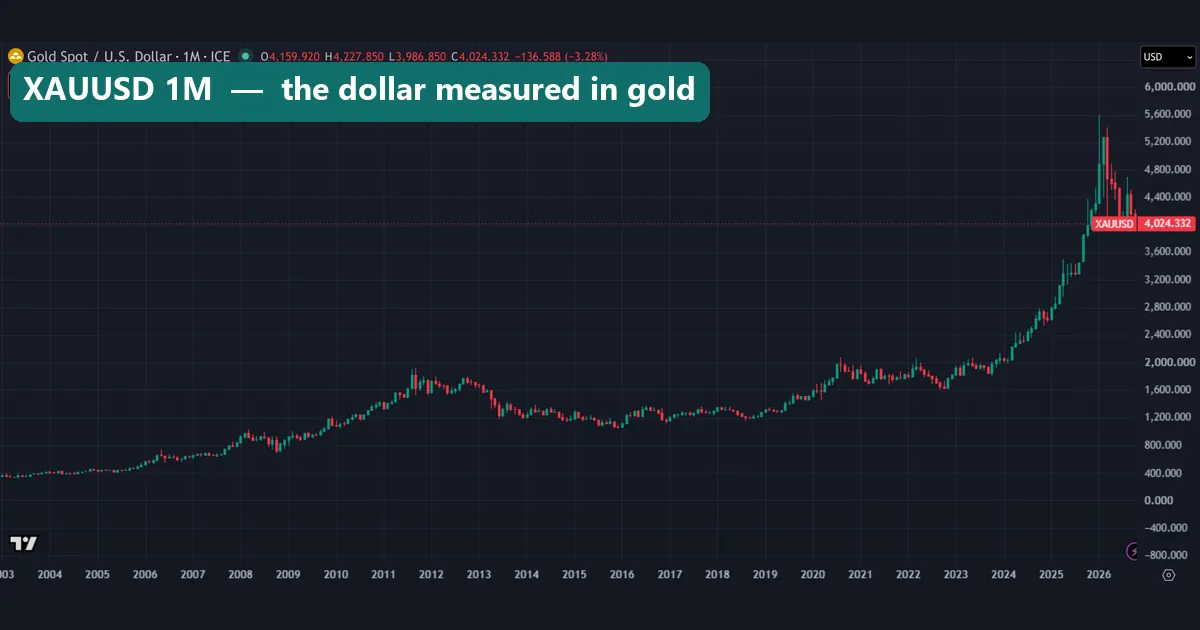
Here is the formula we use. One unit of currency buys 1 / P ounces of gold, where P is the gold price in that currency. The share of gold buying power lost between two months is 1 - (P start / P end). For example, gold in dollars rose 4.54 times from May 2008 to October 2026, so the dollar lost 78.0%. Our page on how inflation affects forex covers the price-index side.
What fiat money means for forex traders
Every major forex pair prices one fiat currency in another. EUR/USD tells you how many dollars one euro buys, not what either buys in goods or gold. Both can lose buying power while the pair barely moves. From May 2008 to October 2026 the dollar lost 78.0% in gold terms and the euro 84.1%. Our guide on whether the euro is stronger than the dollar covers that pair.
That is also why rate gaps matter, as our page on how interest rates affect forex explains. The G10 currencies all run on this model. Likewise, the dollar index measures the dollar against other fiat currencies, so it shows relative value only.
How we tested five fiat currencies against gold
We pulled monthly gold prices from the FX_IDC (ICE) feed on the TradingView web chart on 23 October 2026. We used five symbols: FX_IDC:XAUUSD, XAUEUR, XAUGBP, XAUJPY and XAUCHF. Each prices gold in that currency.
The feed starts at different months. Dollar, yen and franc data begin in November 2001, the euro in September 2005 and the pound in May 2008. So we report two windows: each currency’s own start, and the common window from May 2008 to October 2026. Only the second compares all five fairly.
The October 2026 bar had not closed on 23 October, so its last price stands in for the close. FX_IDC quotes XAUCHF per kilogram, so we divided it by 32.1507 ounces per kilogram. Our two data charts come from these closes. They are price readings, not trades, so no spread, swap or commission enters them. Our editorial testing policy sets out how we collect and check data.
Measurement settings we used
Change any of these choices and the percentages change too.
| Setting | Our choice | Why it matters |
|---|---|---|
| Data feed | FX_IDC (ICE) on TradingView | Another feed gives slightly different closes |
| Bar size | Monthly closes | Hides the swings inside each month |
| Yardstick | One troy ounce of gold | Gold has large swings of its own |
| Common window | May 2008 to October 2026 | The only span all five feeds share |
| Long window | From November 2001 (USD, JPY, CHF) and September 2005 (EUR) | Longer spans show bigger losses |
| Swiss franc unit | Per kilogram, divided by 32.1507 | The chart axis stays in kilograms |
| End point | Price on 23 October 2026 | The October bar had not closed |
| Interest | Not counted | Cash on deposit can earn interest |
The last row matters most. Our numbers show what an idle note in a drawer lost against gold. Money on deposit earned interest in many of these years, and our figures leave that out.
Reading gold charts as a fiat currency scorecard
On a gold chart, the line rises when the currency buys less gold. So read it upside down: a climb means the currency lost ground.
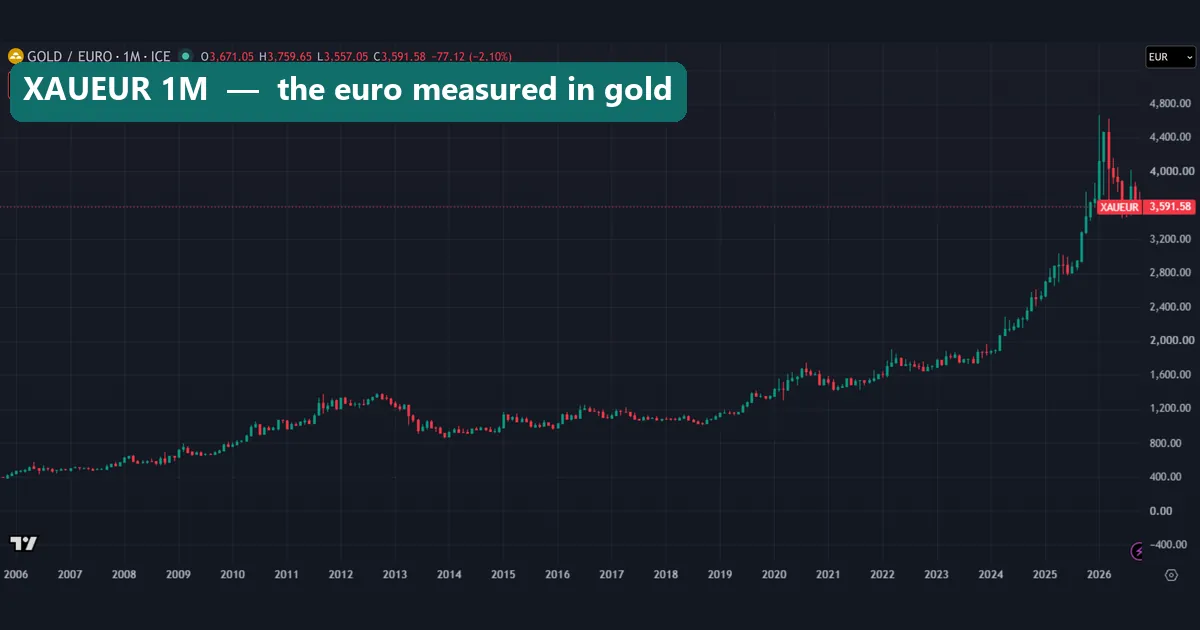
The euro chart starts near 400 euros an ounce in 2006. Gold then climbed to about 1,350 euros in 2012 and fell back near 900 by early 2014. After a flat stretch, the climb resumed in 2019. In early 2026 a wick reached above 4,600 euros, and the capture shows 3,591.58. Since September 2005, gold in euros rose 9.22 times, so one euro lost 89.2% of its gold buying power.
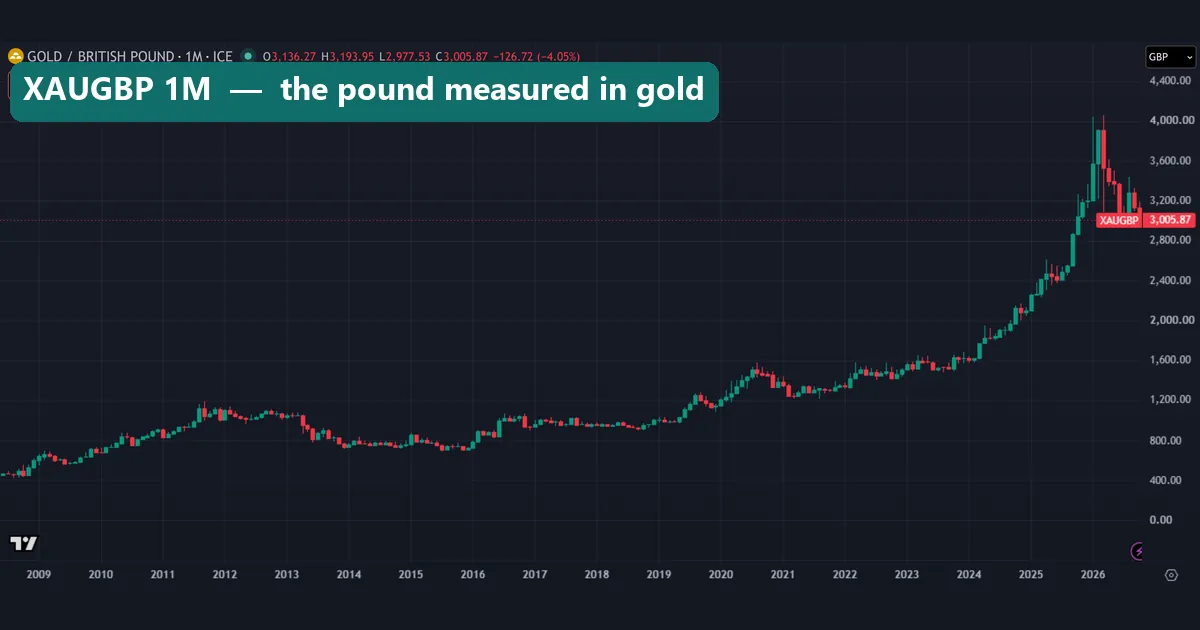
The pound chart starts in May 2008, near 448 pounds. In 2016 it jumped from the 700s to around 1,000. That year our GBP/USD data shows two of the pound’s six worst months since 2001: June at -8.3% and October at -5.7%. The link is simple, because XAUGBP equals XAUUSD divided by GBP/USD. At capture XAUGBP stood at 3,005.87, or 6.71 times its May 2008 level. Our guide to gold pip value shows what a gold move is worth on an account.
Worked example: 1,000 dollars measured in gold
Step 1, the start. In November 2001 our data puts gold at 274.15 dollars an ounce. So 1,000 dollars bought 1,000 / 274.15 = 3.65 ounces.
Step 2, the end. Our October 2026 reading was 4,022.70 dollars (the chart showed 4,024.33 at capture). So the same 1,000 dollars bought 0.249 ounces.
Step 3, the loss. Divide the end by the start: 0.249 / 3.65 = 0.068. The dollar kept 6.8% of its gold buying power and lost 93.2%. The price multiple agrees: 4,022.70 / 274.15 = 14.67, and 1 – 1 / 14.67 = 0.932.
Step 4, the pound. In May 2008 gold cost 447.78 pounds, so 1,000 pounds bought 2.23 ounces. In October 2026 it cost 3,006.39 pounds, and the same sum bought 0.333 ounces. That works out to a loss of 85.1%.
Step 5, the franc. The XAUCHF chart showed 106,083.35 francs per kilogram. Divide by 32.1507 and you get about 3,300 francs per ounce, close to the 3,298.48 in our monthly data. Against 449.48 francs in November 2001, that is 7.34 times more, so one franc lost 86.4%.
For scale, the official Bretton Woods price was $35 an ounce.
Five fiat currencies measured in gold since 2008
In the common window, gold rose 4.54 times in dollars, 6.29 times in euros, 6.71 times in pounds, 6.61 times in yen and 3.54 times in Swiss francs.
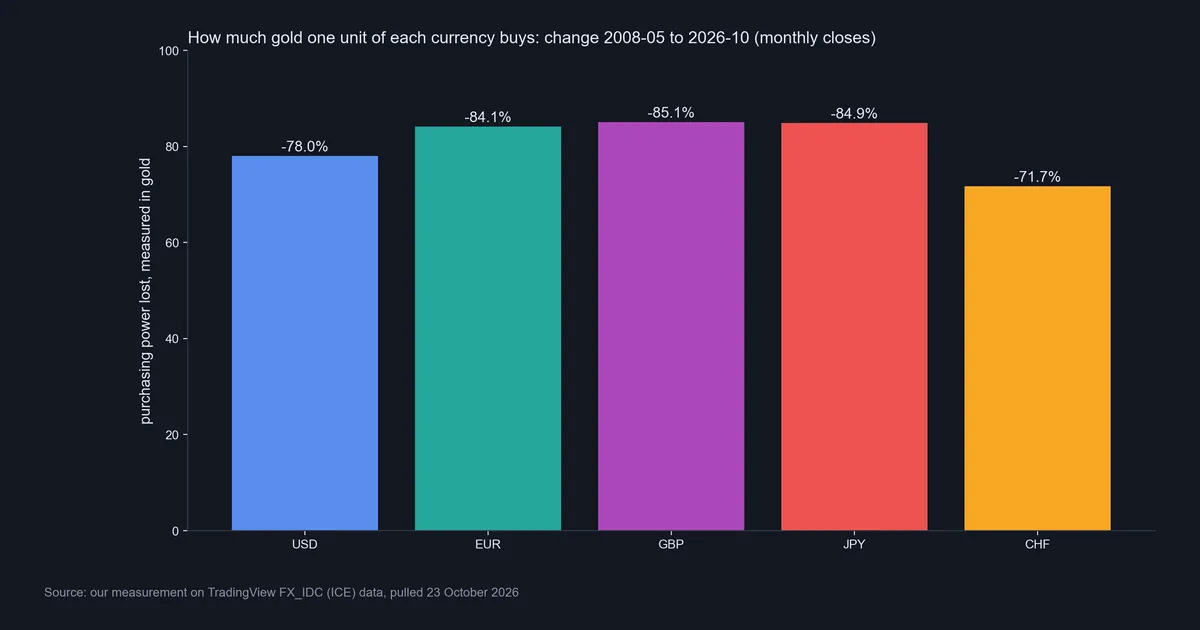
As losses, that reads: dollar 78.0%, euro 84.1%, pound 85.1%, yen 84.9% and franc 71.7%. The franc, often listed among safe-haven currencies, held up best. Still, it lost more than two thirds.
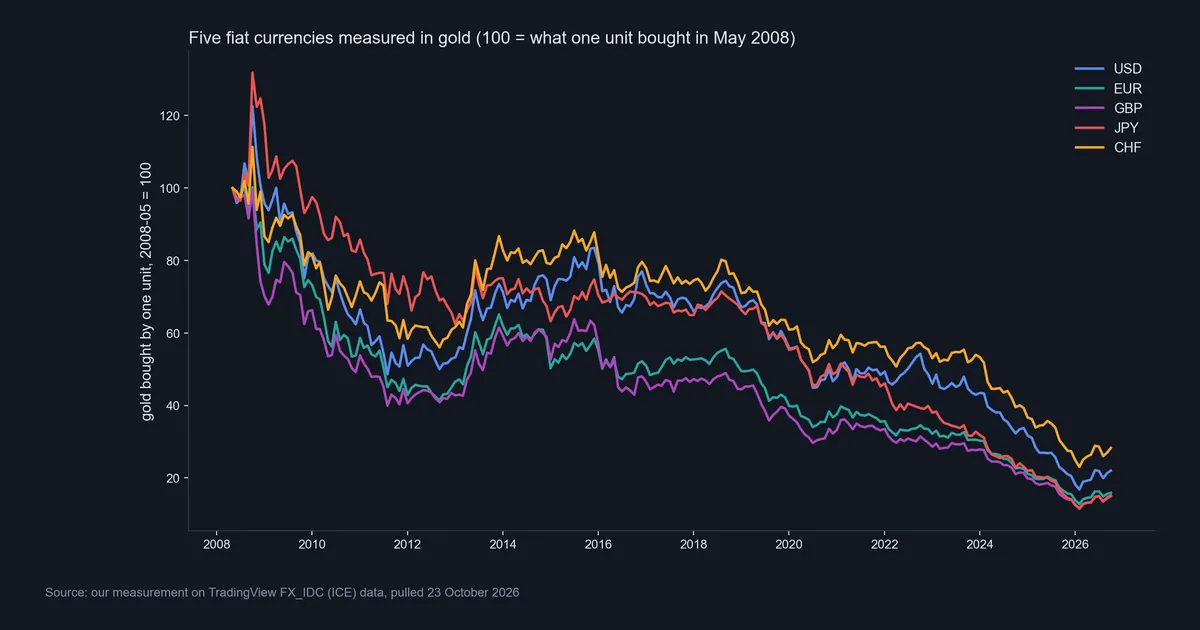
The second chart shows the path. Each line starts at 100 in May 2008. In late 2008 the yen line jumped to about 130 and the dollar line to about 120, because gold fell in those currencies for a few months. Then all five slid into 2011 and 2012. From 2019 the decline resumed, with lows in early 2026. The lines ended near 28 for the franc, 22 for the dollar, 16 for the euro and 15 for the yen and pound.
Download the complete indicator database
Put these concepts on your charts. One email unlocks the full library of 1,380+ indicators with compiled MT4 and MT5 files, plus my TradingView scripts. No paywall, no spam, unsubscribe any time.
Get free access to my indicator database
One email unlocks 1,380+ free MT4, MT5 and TradingView indicators — the complete library. No single-tool download; you get the whole database.
Where it fails: gold is a rough yardstick
Gold is not a price index. It is one volatile asset, so this test gives one view of fiat money, not a full measure of inflation. Consumer price indexes track the goods people buy, and the Fed and the ECB target those, not gold. Our guide to CPI in forex explains the measure traders watch most.
Second, the end date moves the answer. In early 2026 gold spiked, and the dollar line on our index chart dipped near 17. By October it was back at 22. The start date matters even more: since 2001 the dollar lost 93.2%, but since May 2008 it lost 78.0%.
Third, the ranking is not fixed. Of the three currencies with data back to 2001, the yen lost the most, at 94.6%. In the common window, however, the pound lost the most.
Fourth, gold can fall for years. On our index chart, the dollar and the franc gained gold buying power from 2013 to 2015. On the dollar chart, gold topped near 1,900 in 2011 and did not pass that level again until 2020.
Gold in yen and Swiss francs: watch the units
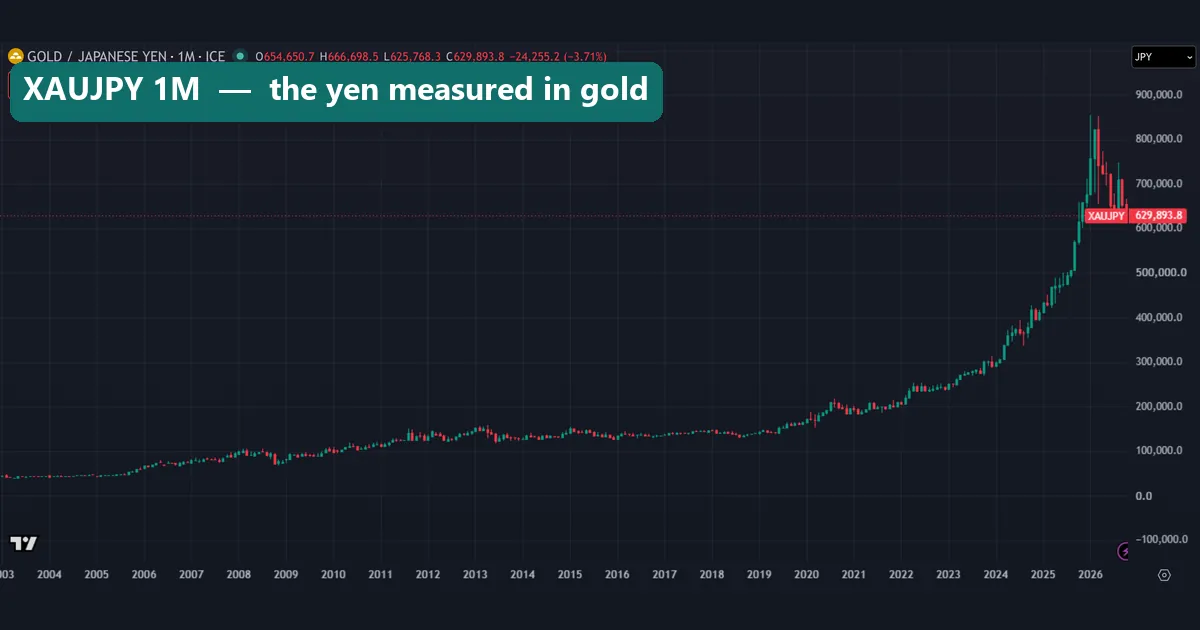
The yen chart tells the longest story of loss. In November 2001 an ounce cost 34,071.95 yen, and in October 2026 it cost 629,917.6 yen. That is 18.49 times more, or a 94.6% loss of gold buying power. Gold in yen rose slowly until 2019, then steeply, with a wick near 850,000 yen at the early 2026 top.
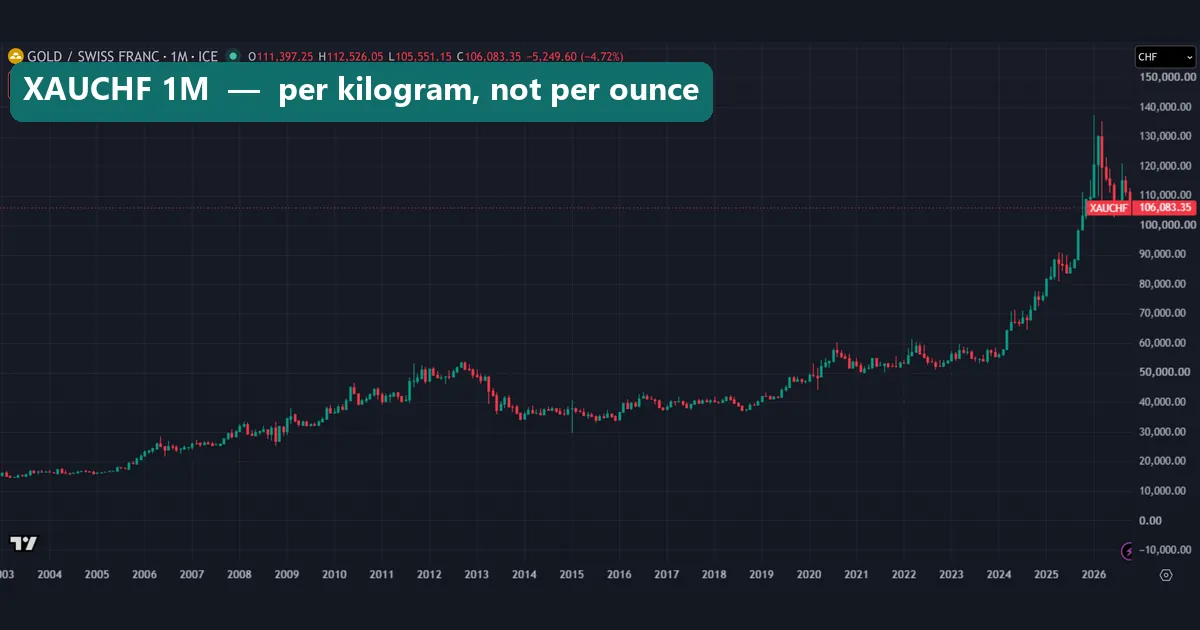
The franc chart needs care. FX_IDC quotes it per kilogram, so the axis reads 106,083.35 at capture, not about 3,300. Divide by 32.1507 before you compare it with any price per ounce. Otherwise the shape matches the others, plus a long lower wick in early 2015. For a wider view, our guide to the weakest currency in the world ranks 33 currencies by how much value they lost against the dollar.
Common mistakes when judging a fiat currency
1. Reading a gold loss as an inflation rate. The dollar lost 78.0% in gold since May 2008. That does not mean shop prices rose 4.54 times. Gold and shop prices move on different drivers.
2. Mixing start dates. The dollar’s 93.2% loss runs from 2001, and the pound’s 85.1% from 2008. Side by side, the pound looks better. In the shared window it did worse: 85.1% against 78.0%.
3. Reading the franc chart in ounces. XAUCHF on FX_IDC shows francs per kilogram. Read it as ounces, and gold looks about 32 times dearer than it is.
4. Confusing unit value with strength. One pound buys more than one dollar, and one yen buys less than one cent. Neither fact shows which kept its value better. Our guide to the most valuable currency in the world explains why “most valuable” and “strongest” differ.
Where to go next
To see how silver trades against gold, read our XAGUSD guide. To convert between the five currencies here, use our currency converter. Our explainer on whether central banks trade forex covers reserves and intervention. For primary sources, start with the Bank of England and Federal Reserve History pages linked above.
FAQ about fiat currency
What is a fiat currency in simple terms?
It is money that a government issues and declares legal tender, with no right to swap it for gold. Its value comes from trust and from what it can buy.
Is the US dollar a fiat currency?
Yes. Foreign governments lost the right to swap dollars for gold when the gold window closed in August 1971. In our data, one dollar lost 93.2% of its gold buying power from November 2001 to October 2026.
Why do fiat currencies lose value over time?
Central banks aim for low, positive inflation, 2% for the Fed and the ECB. When prices rise a little each year, each unit buys a little less. Larger losses come when inflation runs above target.
Is Bitcoin a fiat currency?
No. A state issues a fiat currency and declares it legal tender, and no government issues Bitcoin. Our guide to forex vs crypto trading compares the two markets.
Which fiat currency kept the most value against gold?
From May 2008 to October 2026, the Swiss franc did. It lost 71.7%, against 78.0% for the dollar and 85.1% for the pound. A different window can change the order.
Does gold measure inflation?
Not well. Gold is one volatile asset, and in our data it took until 2020 to pass its 2011 dollar top. Price indexes such as the CPI, PCE and HICP track the cost of living.
Why does the XAUCHF chart show such a large number?
FX_IDC quotes gold in Swiss francs per kilogram. Divide by 32.1507 to get francs per troy ounce. At capture, 106,083.35 per kilogram came to about 3,300 per ounce.
Should I hold gold instead of a fiat currency?
We do not give investment advice. Our data shows gold rising against all five currencies over the long run, but also falling for years at a time. Gold pays no interest, while cash on deposit can. Treat these figures as history, and remember that results are not guaranteed; past performance is not indicative of future results.
Last updated: 23 October 2026.

About the author
Written by Dominic Walsh, a Forex trader and MT4/MT5 indicator, Expert Advisor and script developer. Every tool on forexmt4systems.com is tested on live charts before release and ships with ready-to-use compiled MT4 (.ex4) and MT5 (.ex5) files. Learn more about the trader and developer behind this site.
How we build, test and correct every tool: Editorial & Testing Policy. Trading carries risk; see the disclaimer.