
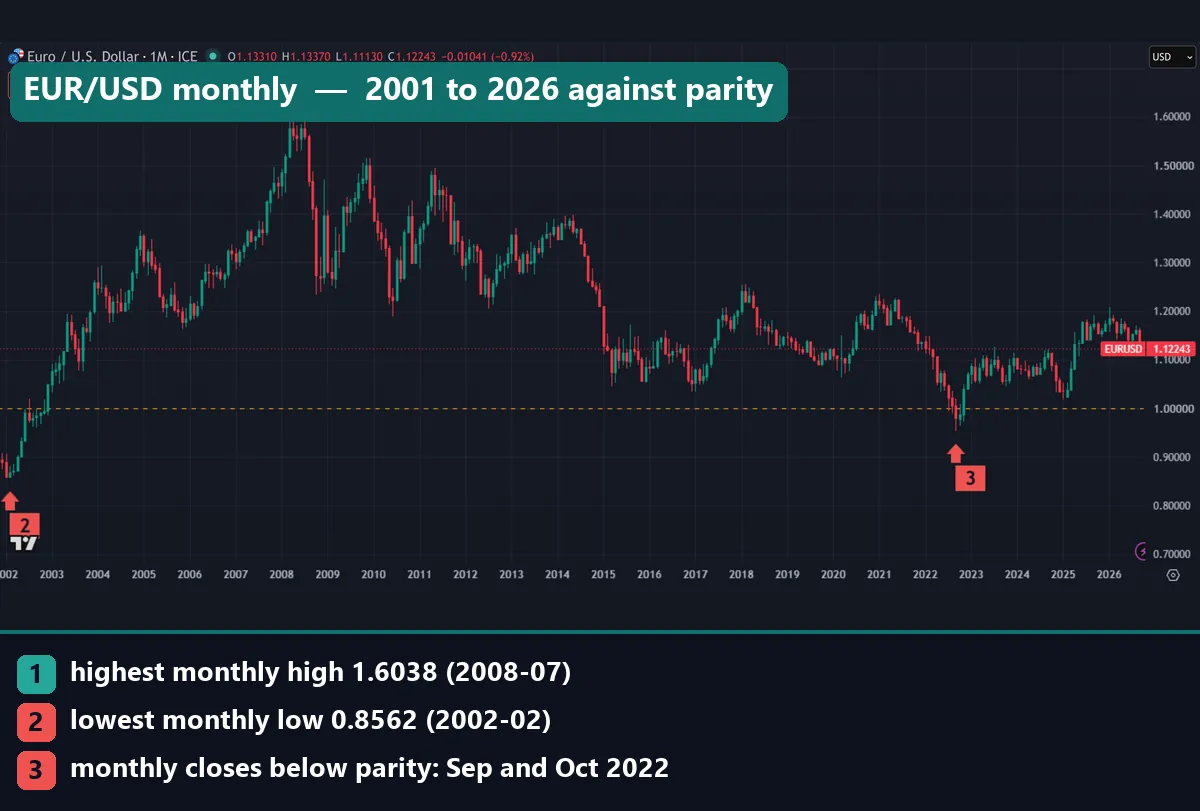
Is the euro stronger than the dollar? Per unit, yes. On 19 October 2026 one euro bought about 1.122 US dollars. The euro also closed above one dollar in 285 of the 300 monthly closes we pulled, from November 2001 to October 2026. That answer is narrower than it sounds, though. A rate of 1.12 only says that one unit of one money buys more than one unit of the other. It does not say which economy is bigger or which currency is rising. This guide settles both sides of the question with our own charts and counts.
What a stronger currency really means
An exchange rate is a price. EUR/USD at 1.1225 means one euro costs 1.1225 US dollars. The euro is the base currency, the thing you buy or sell. The dollar is the quote currency, the unit that measures the price. So the usual question is simple: does one euro buy more than one dollar? Since the end of 2002 the answer has almost always been yes.
That per-unit view has a quiet flaw. Someone picks the size of a currency unit once, at launch. The euro started life on 1 January 1999, and the first rate in the ECB’s euro reference rate history for the US dollar is 1.1789, on 4 January 1999. Had the euro launched as a unit worth half as much, the rate today would sit near half its level. Yet no wage, price or factory in Europe would differ.
The yen makes the same point from the other side. One yen buys less than one US cent, but Japan runs one of the largest economies in the world. Our guide to the most valuable currency in the world ranks money by this per-unit measure.
How the EUR/USD rate works as a ratio
Every currency pair is a fraction. The base currency sits on top and the quote currency sits underneath:
EUR/USD = US dollars needed to buy 1 euro
Flip the fraction and you see the same market from the dollar’s side:
USD/EUR = 1 ÷ (EUR/USD)
At the October 2026 monthly close of 1.1225, one dollar buys about 0.891 euros. Market convention simply puts the euro first. The Federal Reserve’s H.10 foreign exchange release follows the same habit. It quotes the euro, the pound, the Australian dollar and the New Zealand dollar in US dollars per unit, and most other currencies in units per dollar.
The percentage move is (new rate ÷ old rate - 1) × 100. When EUR/USD rises, the euro gains on the dollar and the dollar loses on the euro. Still, the two percentages never match exactly, because each fraction has a different base. Like the other major currency pairs, EUR/USD shows four or five decimals, and one pip in forex on this pair is 0.0001.
What pushes the euro up or down against the dollar
The rate moves when demand for one currency shifts against demand for the other. Three forces do most of the work.
Interest rates. Money tends to flow toward the currency that pays more, so the gap between European Central Bank and Federal Reserve rates matters. Our page on the interest rate differential explains the mechanism.
Inflation. Faster price growth erodes what a currency buys, and traders watch how each central bank reacts. Our guide to how inflation affects forex traces that chain.
The broad dollar. The euro carries the largest weight in the US Dollar Index, so a dollar move against everything shows up strongly in EUR/USD. Our page on the dollar index in forex covers the basket. In stress, many traders also run to safe-haven currencies, and the dollar is one of them.
We list these drivers to explain moves, not to predict them.
How we tested
We pulled every bar on 19 October 2026 on a TradingView web chart. The main series is FX_IDC:EURUSD on the monthly timeframe, from November 2001 to October 2026: 300 bars. FX_IDC is TradingView’s feed of quoted exchange rates from ICE, and its EUR/USD history starts in late 2001. For closer views we used OANDA:EURUSD on the weekly and daily timeframes, plus FX_IDC:GBPUSD weekly for the pound question.
A month counts as above parity when its close sits above 1.0000, and below parity when it sits under. The record high and low come from monthly highs and lows, not closes. The October 2026 bar had not closed on capture day, so its close is the price at the time of the pull.
We did not use MetaTrader 4 here. Our MetaTrader 4 history (build 1471, Capital Point Trading) starts in June 2018, which is far too short for a 25-year question. We also drew our own data chart from the monthly closes. The editorial testing policy explains how we choose data and report limits.
The settings and numbers behind this guide
There are no indicator inputs in this test. Three choices matter: the data source, the timeframe and the counting rule. The table lists them with the headline results.
| Setting or measure | Value |
|---|---|
| Main symbol and timeframe | FX_IDC:EURUSD, monthly |
| Window | November 2001 to October 2026 (300 monthly bars) |
| Monthly closes above 1.0000 | 285 of 300 (95.0%) |
| Monthly closes below 1.0000 | 15: November 2001 to November 2002, then September and October 2022 |
| Highest monthly high | 1.6038 (July 2008) |
| Lowest monthly low | 0.8562 (February 2002) |
| Latest monthly close | 1.1225 (October 2026, bar still open) |
| Latest daily close | 1.12224 (19 October 2026) |
Read the 95.0% figure as a count of closes, not of days. A month can dip under parity and still close above it, as July and August 2022 did.
Reading the euro against the dollar on a chart
Start with the scale. On a EUR/USD chart a higher line means more dollars per euro. The yellow dashed line in our captures marks 1.0000, or parity, where one euro equals one dollar.
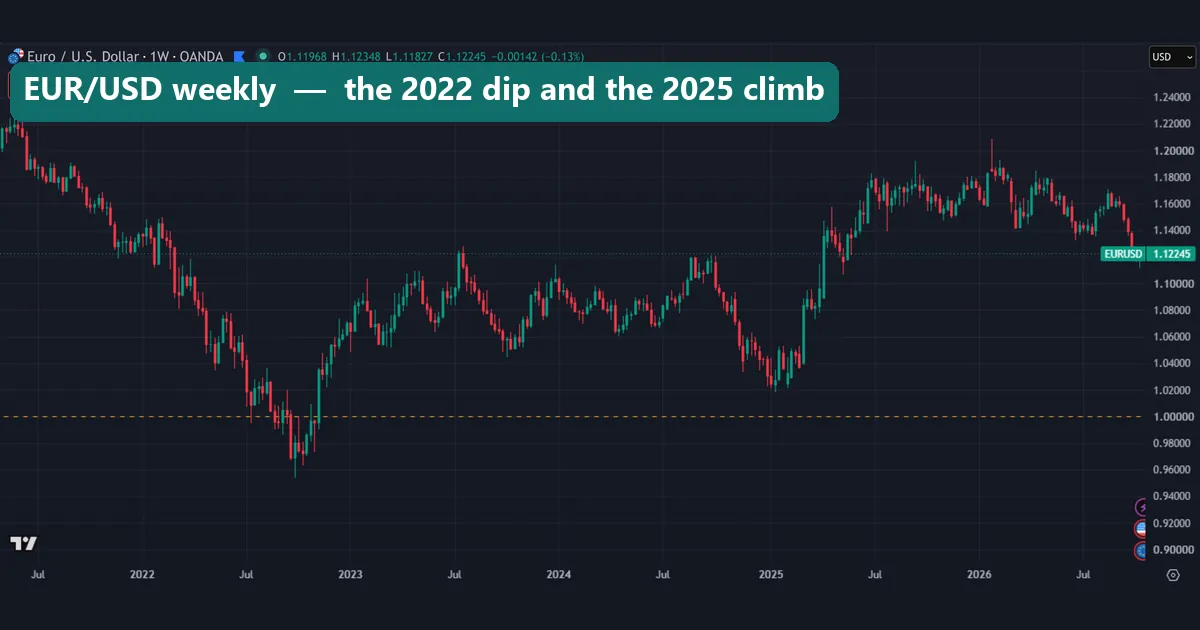
Our OANDA weekly chart runs from mid-2021 to October 2026. The bars slide from above 1.20 in 2021 to under the parity line in the second half of 2022. Then comes a long sideways stretch through 2023 and 2024. A dip around the turn of 2025 held above parity, and a climb took the rate above 1.16 by mid-2025.
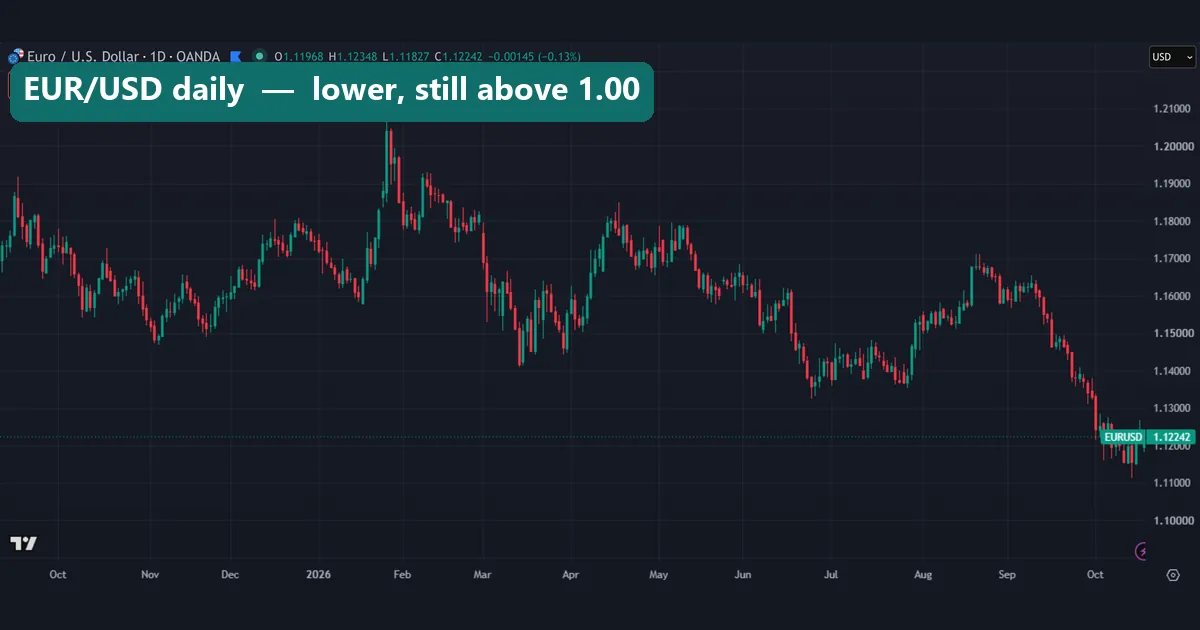
The daily chart covers about 13 months. A spike in late January 2026 touched the 1.20 to 1.21 area and faded within weeks. From near 1.17 in late August 2026, the rate fell to about 1.12 by mid-October. Even the lowest October bar on this chart sits more than ten cents above parity. So both statements hold at once: the euro weakened in autumn 2026, and per unit it still buys more than a dollar. For trend tools on this pair, see our EUR/USD technical analysis guide.
Worked example: what 1,000 dollars bought in euros
Every figure below uses our monthly extremes or the latest close, before any bank or broker spread.
At the latest close, 1.1225. 1,000 euros convert to 1,122.50 dollars. Going the other way, 1,000 dollars buy 1,000 ÷ 1.1225, or about 890.87 euros.
At the February 2002 low, 0.8562. 1,000 dollars bought about 1,167.95 euros. Here the dollar was the stronger unit.
At the July 2008 high, 1.6038. The same 1,000 dollars bought only about 623.52 euros, close to half as many. Measured from the low, EUR/USD rose about 87.3%. That is a move of 7,476 pips.
From the 2008 high to now. The rate fell from 1.6038 to 1.1225, a drop of about 30.0%. Yet the euro still buys more than a dollar.
The current month shows the same split. On our monthly chart, the October 2026 bar opened at 1.13310 and stood at 1.12243 at capture, down 0.92%.
Twenty-five years of closes in two charts
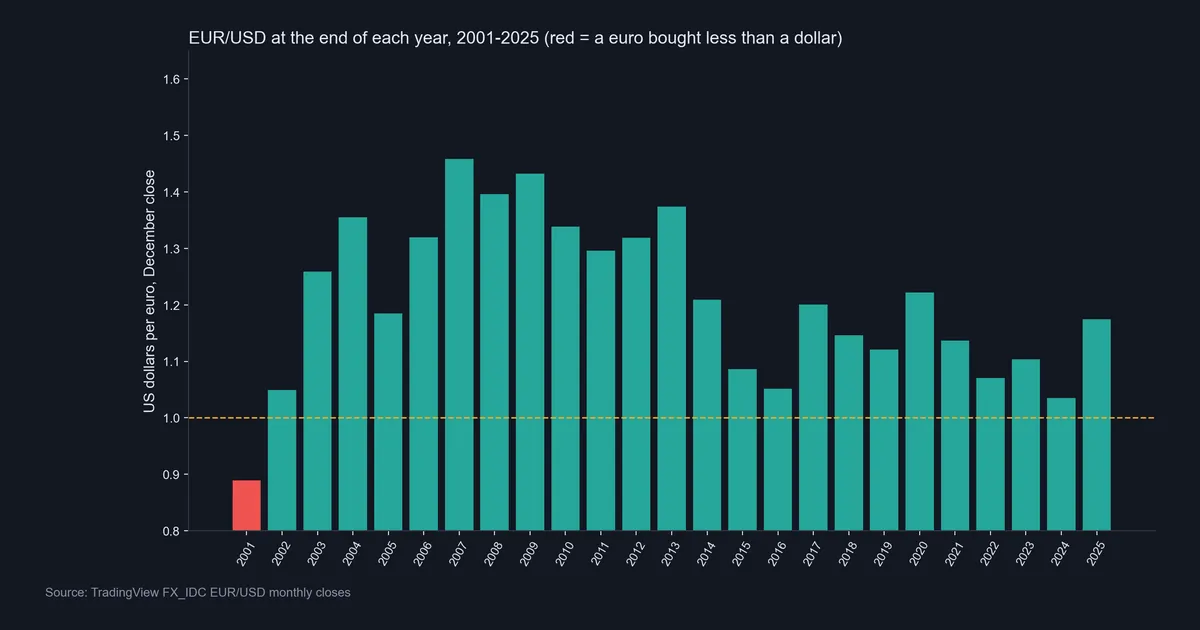
Our first data chart plots all 300 monthly closes. Red fill marks closes under 1.00. The red patch sits almost entirely at the far left, in 2001 and 2002, with a thin sliver in late 2022.
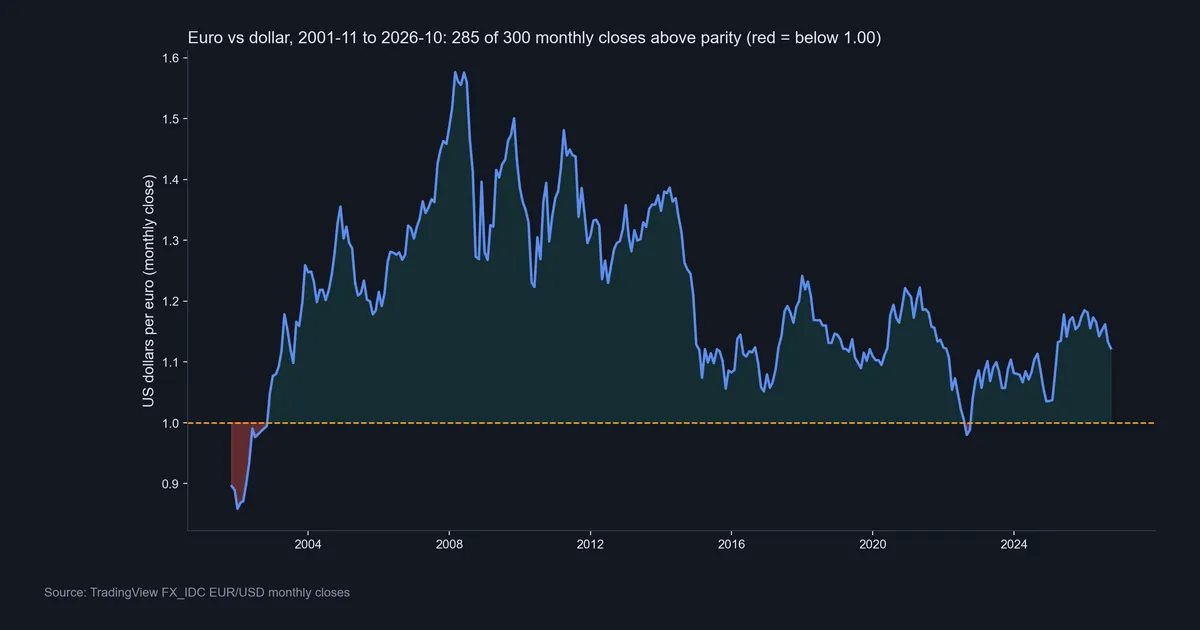
Our second chart keeps only the December close of each year, from 2001 to 2025. Just one bar sits under the dashed parity line, and that red bar is 2001. Even 2022 ends the year above parity, because its two closes below 1.00 came in September and October. So 24 of the 25 year-end closes sat above parity.
Download the complete indicator database
Put these concepts on your charts. One email unlocks the full library of 1,380+ indicators with compiled MT4 and MT5 files, plus my TradingView scripts. No paywall, no spam, unsubscribe any time.
Get free access to my indicator database
One email unlocks 1,380+ free MT4, MT5 and TradingView indicators — the complete library. No single-tool download; you get the whole database.
Where it fails: what the per-unit answer hides
It ignores what money buys at home. A euro and a dollar buy different baskets in their home markets. Economists use purchasing power parity, explained on Wikipedia, to compare that, and it can tell a different story from the market rate.
It ignores direction. The euro stayed ahead per unit through a fall of about 30% from the 2008 peak. A level answers a different question from a trend.
It covers one pair only. EUR/USD cannot tell you whether the dollar is strong against everything or the euro is weak against everything. A currency strength meter or the dollar index spreads that question across many pairs.
Sources disagree in the decimals. The ECB publishes one reference rate per working day. Its record is 1.599 on 15 July 2008, below the FX_IDC monthly high of 1.6038, which records the top quote of the month. The ECB low of 0.8252 on 26 October 2000 falls before our data starts. So our count of 15 months below parity understates the full history since 1999. Even on capture day, our FX_IDC monthly chart showed 1.12243 and the OANDA weekly chart 1.12245.
Is the pound stronger than the dollar too?
Per unit, yes, and by more than the euro. Our FX_IDC GBP/USD weekly chart showed 1.3336 on capture day, so one pound bought about 1.33 dollars against the euro’s 1.12.
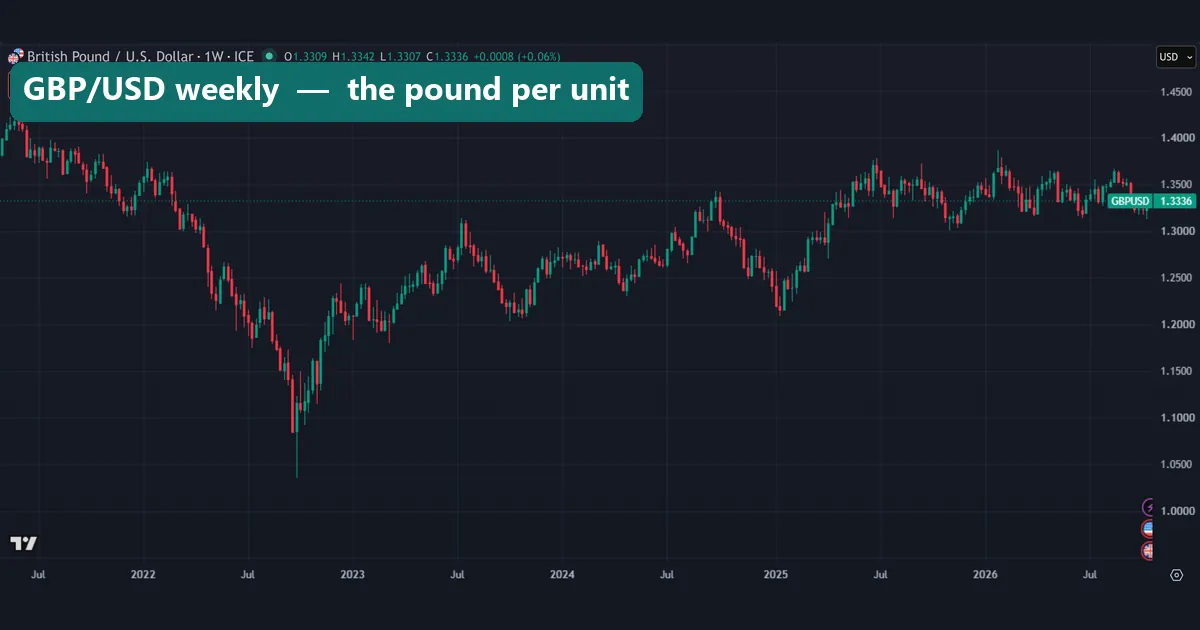
The chart also shows how 2022 treated both currencies. Sterling slid from above 1.40 in 2021 to a deep wick in late 2022, the same year the euro broke parity. Even that wick stayed above 1.00 on the scale. The same caution applies, though: the bigger number reflects unit size and history, not a stronger economy.
Was the euro stronger than the dollar in 2022?
Mostly, but not at every month-end. Ten of its twelve monthly closes sat above parity. Our monthly zoom runs from 2020 to early 2025, with the parity line drawn beneath the 2022 dip.
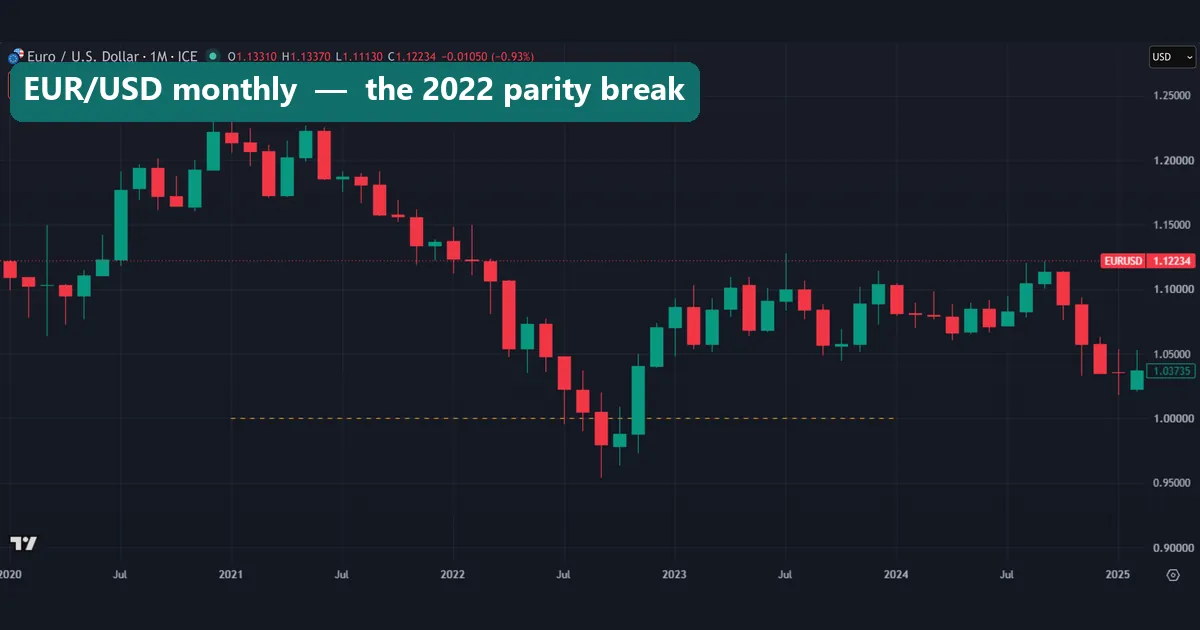
July and August 2022 both pushed their lower wicks under 1.0000 but closed above it. September 2022 closed below. October 2022 opened and closed below as well, although its upper wick reached back over the line. November 2022 then printed a long green candle that opened under parity and closed well above it. Since the end of 2002, September and October 2022 are the only closes below parity.
The earlier spell lasted far longer: 13 straight monthly closes, from November 2001 to November 2002. Parity is a round number, not a floor, and the rate crossed it in both directions.
Common mistakes when comparing the euro and the dollar
1. Treating the rate as a scoreboard of economies. A rate above 1.00 says nothing about growth, jobs or living standards. It reflects unit size plus decades of money flows.
2. Flipping the quote by accident. A rate of 1.1225 dollars per euro and 0.891 euros per dollar describe the same market. Mix them up and a gain turns into a loss on paper. Run the numbers both ways in our currency converter before you act.
3. Treating parity as a floor. Round numbers draw attention, but in 2022 the rate closed under 1.00 twice and then left it behind. A level that held for nearly 20 years still gave way.
4. Judging from one wick or one feed. A wick under parity is not a close under parity, and two data sources can differ in the last decimals. Check the close, the timeframe and the source before you quote a record.
Where to go next
For the other end of the per-unit scale, see our guide to the weakest currency in the world. Our interest rate tracker follows central bank policy rates. Also, our page on currency correlation in forex explains how pairs that share the dollar tend to move together.
For the size of the market, see the BIS Triennial Survey 2022 at the Bank for International Settlements. It shows the dollar on one side of most trades and the euro as the second most traded currency. The ECB and Federal Reserve pages above let you check our numbers against official rates.
FAQ: the euro and the dollar
Is one euro worth more than one dollar right now?
Yes. On 19 October 2026 the daily close was 1.12224, so one euro bought about 1.12 dollars.
Has the euro ever been worth less than the dollar?
Yes, twice in our data. It closed under 1.00 every month from November 2001 to November 2002, and again in September and October 2022. ECB data also show it under parity in 2000.
What is the highest the euro has reached against the dollar?
The FX_IDC monthly high is 1.6038, in July 2008. The ECB’s daily reference rate peaked at 1.599 on 15 July 2008. That gap comes from how each source samples prices.
Why is the euro worth more per unit if the US economy is larger?
Because unit size is arbitrary. The euro’s starting value came from the currencies it replaced, not from the size of the economy behind it.
Is the pound stronger than the euro?
Per unit, yes. On capture day one pound bought about 1.33 dollars and one euro about 1.12, so a pound buys more than a euro.
What does parity mean for EUR/USD?
Parity is a rate of 1.0000, where one euro buys exactly one dollar. It draws attention, but the market does not have to respect it.
Does a higher EUR/USD mean the euro area economy is doing better?
Not by itself. The rate rises when demand for euros grows against demand for dollars. A weak dollar can lift the pair as much as a strong euro.
Can this history tell me where the euro goes next?
No. We measured levels and counts, not direction, and we make no forecast. Use it to frame questions, not to time trades; results are not guaranteed; past performance is not indicative of future results.
Last updated: 19 October 2026.

About the author
Written by Dominic Walsh, a Forex trader and MT4/MT5 indicator, Expert Advisor and script developer. Every tool on forexmt4systems.com is tested on live charts before release and ships with ready-to-use compiled MT4 (.ex4) and MT5 (.ex5) files. Learn more about the trader and developer behind this site.
How we build, test and correct every tool: Editorial & Testing Policy. Trading carries risk; see the disclaimer.