
EURUSD technical analysis is a structured read of the euro-dollar chart: where price sits against its averages, its recent highs and lows, and its normal daily range. This guide settles two things. First, it shows exactly where EURUSD stood on 7 October 2026, with every level printed. Second, it gives the long-run profile from our MT4 history, so you can judge whether a day is quiet or wild. It is a dated snapshot, and it ages fast. We do not predict direction, and nothing here is a trade call.
What EURUSD technical analysis actually is
Technical analysis studies price itself. It does not ask why the euro moved. Instead, it asks where price is now, how far it usually travels, and which levels other traders can see. On EURUSD that means a short list of shared reference points.
The first group is the moving averages. Most traders watch the 50-day and 200-day simple averages, so those lines carry weight by habit alone. The second group is the prior period extremes: last month’s high and low, last week’s high and low, and yesterday’s high and low. The third group is volatility, usually read through the Average True Range (ATR).
None of this tells you what the European Central Bank will say next. For that side of the pair, see our piece on fundamental vs technical analysis. The two views answer different questions. So a chart read is a map of the ground, not a weather forecast.
EURUSD is also the deepest pair in the market. The BIS Triennial FX Survey at the Bank for International Settlements tracks turnover by currency pair, and the euro-dollar sits at the top. That depth is why so many traders share the same levels. It also explains why the pair heads our list of major currency pairs.
How the read works: averages, ranges and levels
Each tool has a plain formula. The simple moving average adds the last N closes and divides by N. So the 50-day SMA is the mean close of the last 50 daily bars. When the close sits below both averages, and the 50 sits below the 200, the chart is in a down phase by the usual definition.
True range is the largest of three gaps: today’s high minus today’s low, today’s high minus yesterday’s close, and yesterday’s close minus today’s low. ATR then smooths that value over 14 bars. TradingView’s default ATR uses RMA smoothing, which is Wilder’s method. The ATR page at StockCharts ChartSchool walks through the same maths step by step.
Prior period levels need no formula at all. Last month’s high is simply the highest price printed in that calendar month. Still, these levels matter because every trader can draw them the same way. A level that everyone sees tends to attract orders. Our guide on support and resistance covers why that happens and why it often fails.
Put together, the method is simple. First, find the trend phase from the averages. Next, mark the nearest prior extremes. Then, size the distances in ATR units, so a 100-pip gap means the same thing in a quiet week and a busy one.
How we tested
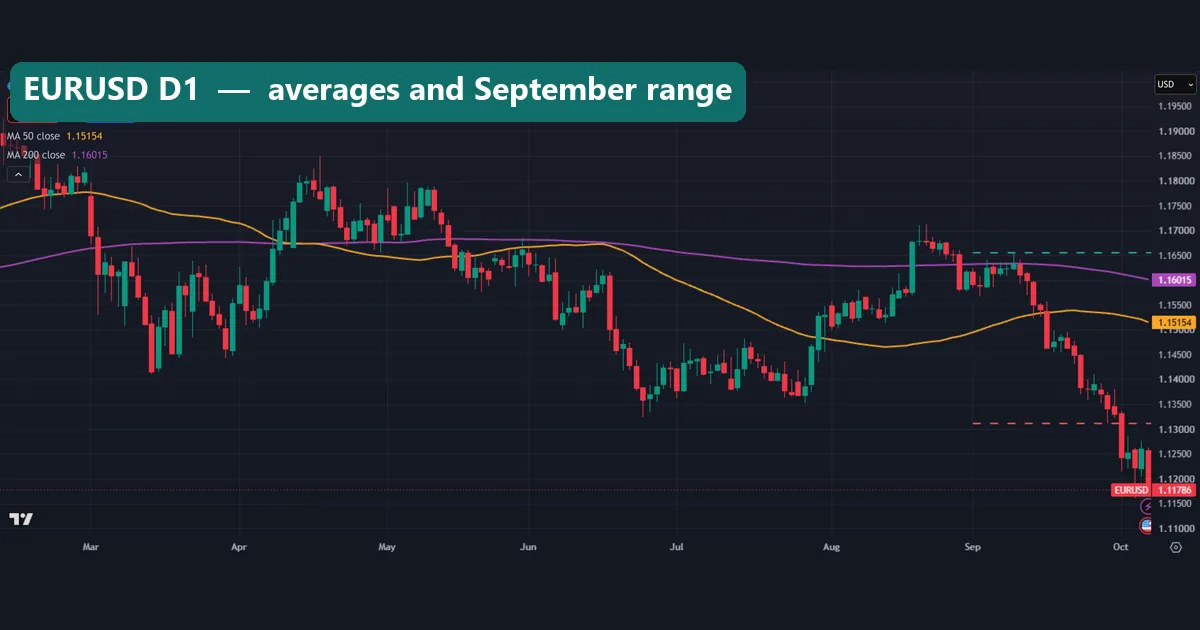
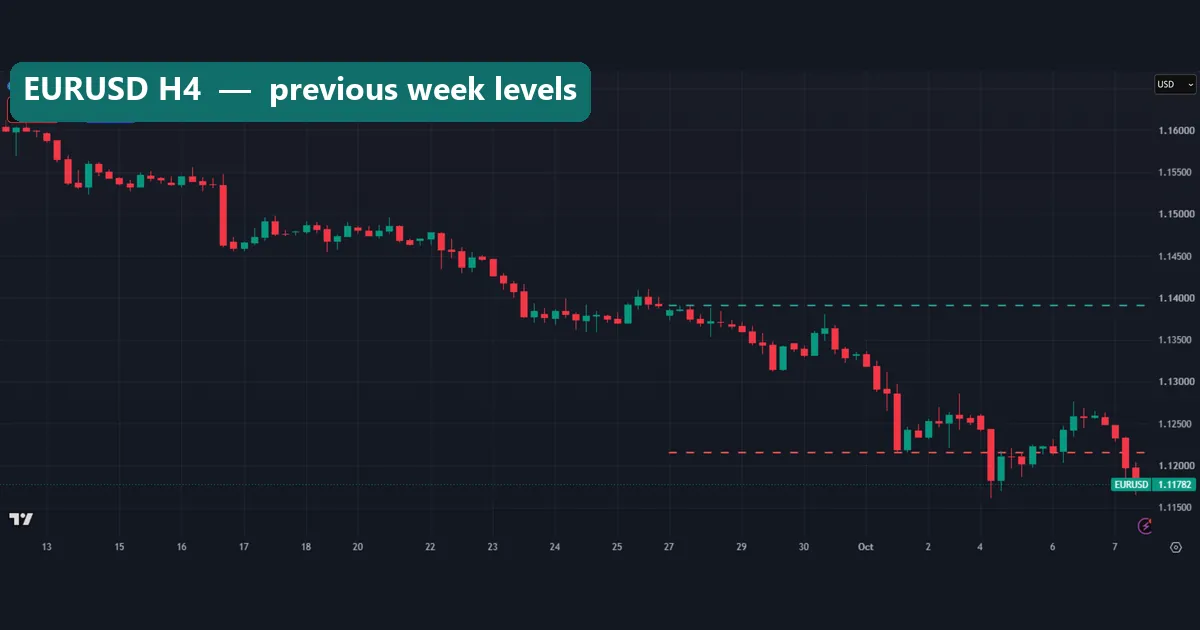
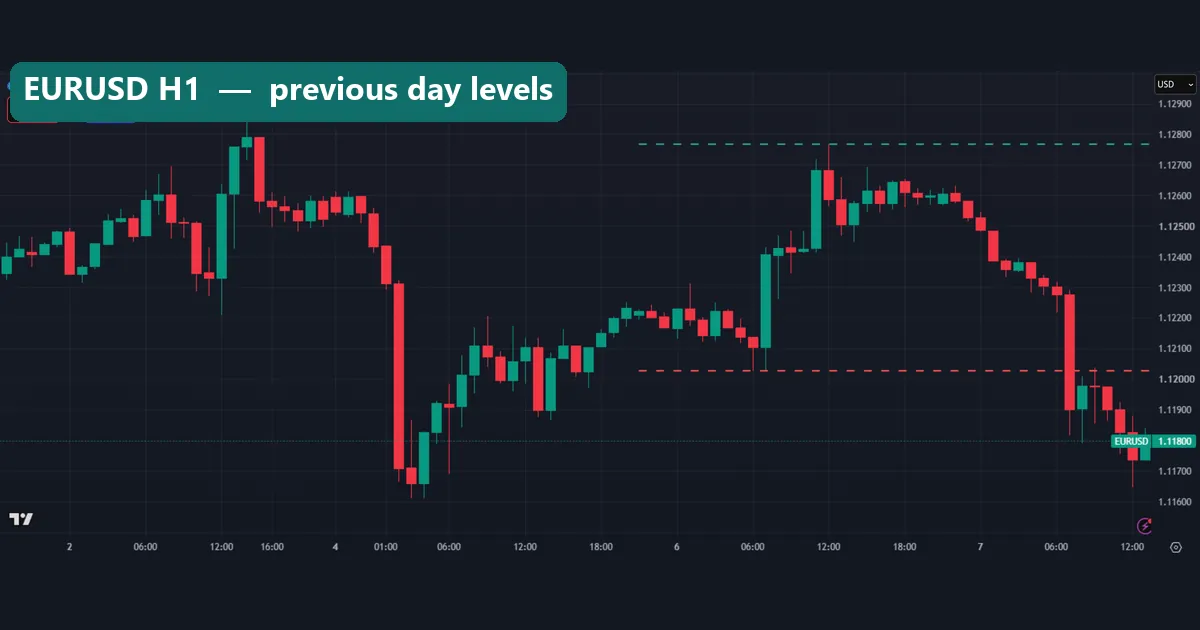
We used two data sources and kept them apart. The dated snapshot comes from OANDA:EURUSD bars on the TradingView web chart, pulled on 7 October 2026. Our screenshots were taken on 7 and 8 October 2026. The daily chart shows the 50 and 200 SMA and September’s high and low. The H4 chart shows last week’s levels, and the H1 chart shows the previous day’s levels.
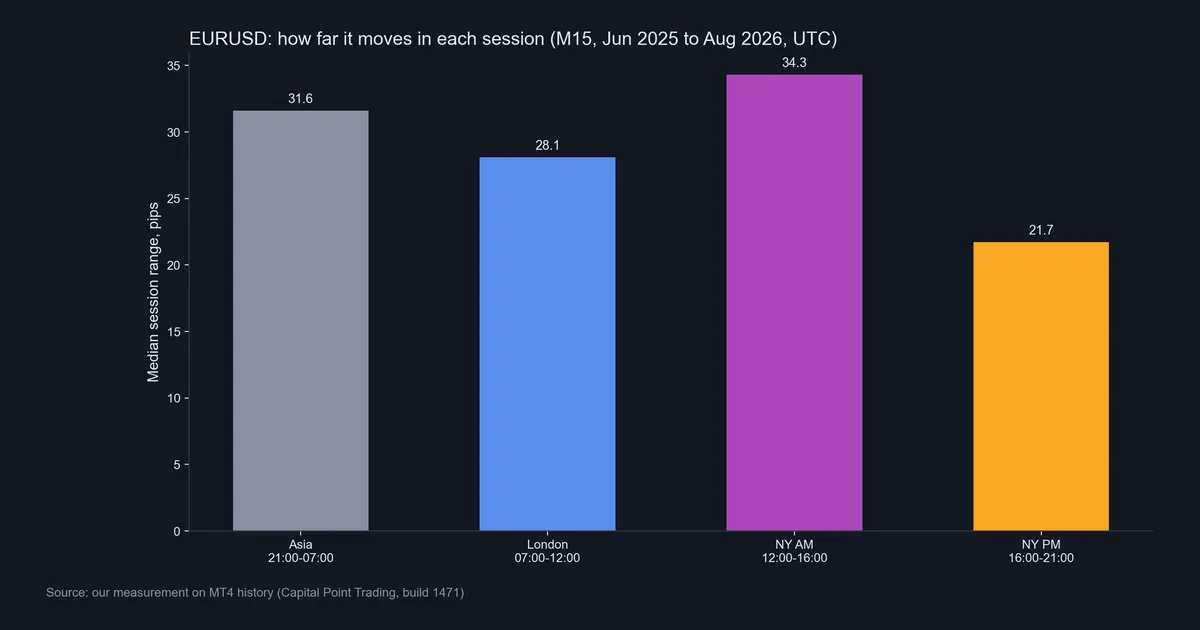
The long-run profile comes from MetaTrader 4, build 1471, on Capital Point Trading terminal history. We read the raw .hst files. Daily bars run from 12 June 2018 to 24 August 2026. Session ranges come from M15 bars between 2 June 2025 and 26 August 2026. Sessions are in UTC: Asia 21:00 to 06:59, London 07:00 to 11:59, New York morning 12:00 to 15:59 and New York afternoon 16:00 to 20:59.
All figures are our measurement. They describe price movement only and ignore spread, swap and commission. Our full method rules live on the editorial testing policy page.
The settings we used
Each input below is a default or a near default. We kept them plain on purpose, because shared settings are the point of shared levels.
| Tool | Setting | Chart | Value on 7 Oct 2026 |
|---|---|---|---|
| Simple moving average | Length 50, source close | D1 | 1.15154 |
| Simple moving average | Length 200, source close | D1 | 1.16015 |
| Average True Range | Length 14, RMA smoothing | D1 | 64.3 pips |
| Previous month high / low | September 2026 | D1 | 1.16544 / 1.13118 |
| Previous week high / low | Week 40 of 2026 | H4 | 1.13914 / 1.12152 |
| Previous day high / low | 6 October 2026 | H1 | 1.12768 / 1.12028 |
| 60-day range | Highest high and lowest low | D1 | 1.17116 / 1.11612 |
You can plot the averages with our free moving average indicator for MT4 and MT5. Also, the moving averages explained guide covers the choice between lengths.
Reading the EURUSD chart on three timeframes
Start on the daily chart. In the first image, price closed on 7 October below the yellow 50-day line and the purple 200-day line. The 50 also sits under the 200. Price has also left September’s range: the red dashed line marks the September low at 1.13118, and the last candles trade well below it.
Next, step down to H4. The second image shows last week’s high at 1.13914 in green and the low at 1.12152 in red. Price slid from the high through the week. Early in the new week it broke the low. After that it bounced back above the red line. Finally, it dropped under it again on 7 October.
Then drop to H1. The third image shows 6 October’s high at 1.12768 and low at 1.12028. Price spent most of 6 October inside that band. On the morning of 7 October, one long red candle cut through the low, and the following bars held below it.
This top-down order matters. The daily chart sets the phase, while the lower charts show where the nearest levels sit. Our multi-timeframe analysis guide explains the habit in more detail.
Worked example: the 7 October 2026 snapshot
Here is the arithmetic, using only the levels in our facts file. The close was 1.11782.
- Against the 50-day SMA: 1.15154 minus 1.11782 is 337.2 pips below. At an ATR of 64.3 pips, that is about 5.2 ATRs.
- The averages: the 50 sat 86.1 pips under the 200 (1.16015 minus 1.15154).
- Against September: the close was 133.6 pips under the September low. September’s full range was 342.6 pips.
- Against last week: 37.0 pips under the week 40 low, in a week that spanned 176.2 pips.
- Against yesterday: 24.6 pips under the 6 October low. That day’s range was 74.0 pips.
- Against 60 days: the range ran from 1.11612 to 1.17116, or 550.4 pips. The close sat just 17.0 pips above the bottom.
Now the volatility check. The last five daily ranges were 58.0, 121.6, 64.6, 100.2 and 74.0 pips. Their mean is 83.7 pips, above the long-run median of 62.8. One of the five, at 121.6, beat our 90th percentile of 112.7. In short, the pair was busier than usual, and it was pressing the low end of its recent range.
So what does that add up to? A down phase on every timeframe we checked, with wider days than normal. The next bar can undo all of it.
How far EURUSD moves by weekday and session
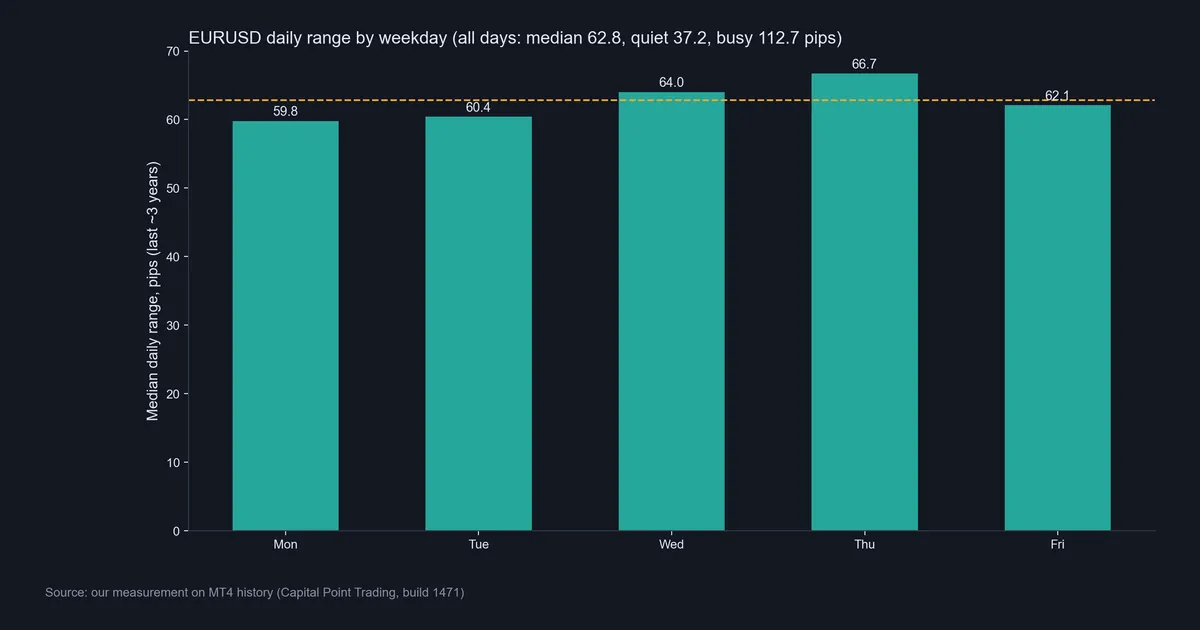
The long-run profile is slower to age than the snapshot. Across our daily history, the median EURUSD day spans 62.8 pips. A quiet day, at the 10th percentile, spans 37.2 pips. A busy day, at the 90th percentile, spans 112.7 pips.
Weekdays differ, but only a little. The fourth image shows the medians: Monday 59.8, Tuesday 60.4, Wednesday 64.0, Thursday 66.7 and Friday 62.1 pips. Thursday tends to run widest, and Monday tends to run narrowest. Still, the gap between them is only 6.9 pips.
Sessions differ more. In the fifth image, the New York morning leads with a median of 34.3 pips. Asia follows at 31.6, though it is the longest window at ten hours. London covers 28.1 pips in five hours. The New York afternoon is the quietest at 21.7. Our forex trading sessions guide lists the hours in more detail.
For a moving baseline on your own chart, our average daily range indicator prints the same kind of figure live. Also, the volatile forex pairs guide ranks EURUSD against the other majors.
Trend runs around the 50-day average
How long does EURUSD stay on one side of its 50-day line? We counted runs of consecutive daily closes above or below it. Over the sample there were 96 such runs. The median run lasted just 5 days. The 90th percentile lasted 52 days.
That split tells you something useful. Most crossings are noise, because price slips back over the line within a week. However, a few runs last two months or more, and those long runs hold most of the trend. So a fresh cross means little on its own. A run that has already lasted weeks is a different case.
The bias between up and down days is also small. In our daily data, 52.4% of days were up days. That is close to a coin flip.
Download the complete indicator database
Put these concepts on your charts. One email unlocks the full library of 1,380+ indicators with compiled MT4 and MT5 files, plus my TradingView scripts. No paywall, no spam, unsubscribe any time.
Get free access to my indicator database
One email unlocks 1,380+ free MT4, MT5 and TradingView indicators — the complete library. No single-tool download; you get the whole database.
Where this fails
First, the snapshot ages. Every level in the worked example belongs to 7 October 2026. By the time you read this, price may sit far from those lines.
Second, levels do not hold just because they are visible. Price broke last week’s low, came back above it, then broke it again, all within a few sessions on H4. A level is a place to pay attention. It is not a wall.
Third, averages lag. The 50-day SMA needs 50 closes to turn, so it confirms a move long after it starts. By the time the 50 crosses the 200, much of the move may be done. Our runs data shows the other side of that: most crosses reverse inside a week.
Fourth, the chart ignores the calendar. Rate decisions from the ECB’s monetary policy decisions page and the Federal Reserve’s FOMC meeting calendar can move the pair more in an hour than in a normal day. No moving average sees that coming.
Fifth, our figures are before costs and come from one broker feed. Your spread and your fills change the picture, so treat our medians as a rough guide.
Volatility in context: ATR and the biggest days
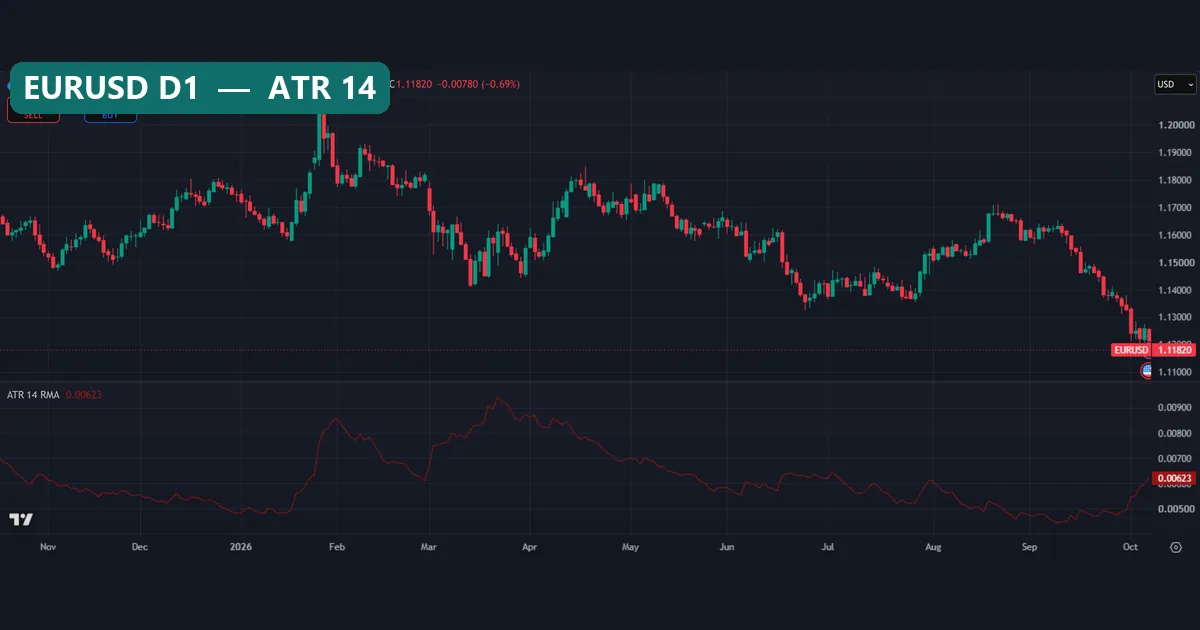
The sixth image shows a year of daily ATR. The pane read 0.00623 when we took the shot, about 62 pips. Our pulled value at the 7 October close was 64.3 pips. Notice how the line climbed in late September and early October after a calm summer. ATR rises after wide days, so it describes volatility that has already happened.
Then look at the tail. The seventh image lists the five biggest close-to-close moves in our data since 2018: +254.3 pips on 10 April 2025, +208.2 on 4 November 2022, -200.7 on 6 November 2024, +196.2 on 10 November 2022 and +190.8 on 3 April 2025. Each one is more than three times the median daily range.
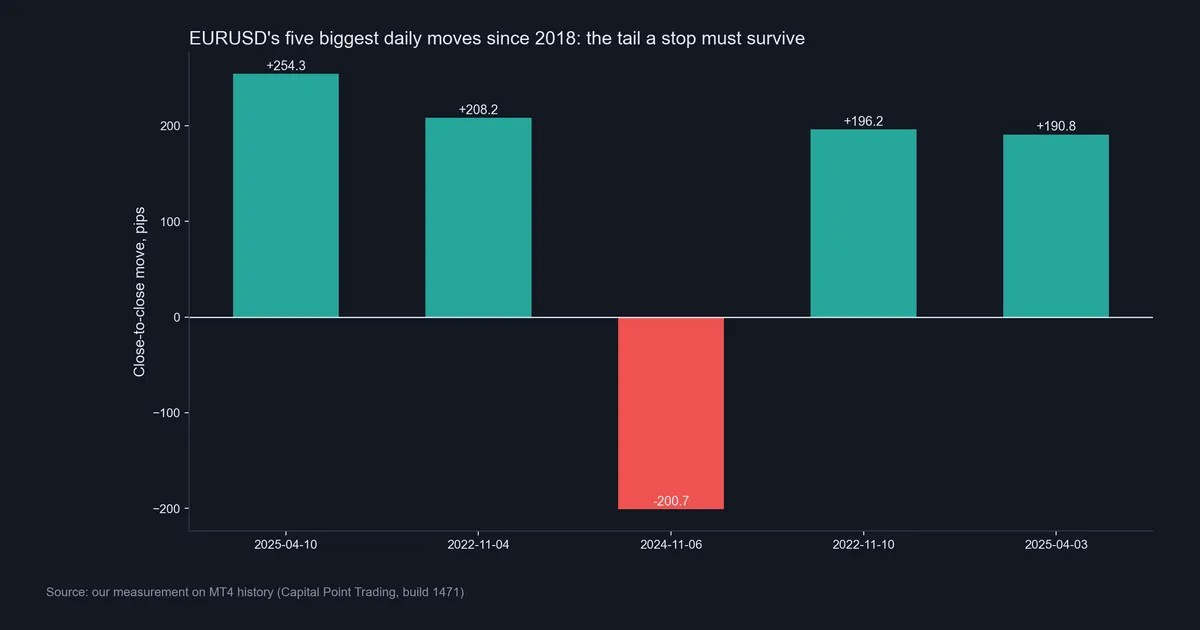
These days are why stops need room and why size matters more than entries. Our guide on how to use ATR as a stop loss shows one way to scale distance. Then position sizing covers how to keep a 200-pip day survivable.
Common mistakes
- Treating a snapshot as a forecast. A down phase on 7 October describes that day. It does not tell you the next week, and it can flip in one session.
- Reading pips without ATR. A 100-pip gap is large on a 37-pip day and ordinary on a 112-pip day. So size every distance in ATR units first.
- Trusting every average cross. Our median run was 5 days. Most crosses fade fast, so wait for context before you act on one.
- Ignoring the session clock. The New York afternoon moved 21.7 pips at the median, against 34.3 in the morning. A level tested at 18:00 UTC is a weaker test than one at 13:00 UTC.
Where to go next
For a wave-count view of the same pair, read our Elliott Wave EURUSD analysis. If cost is your concern, the low spread forex pairs guide compares the majors. Then, for holding periods of days or weeks, see the best forex pair for swing trading.
On volatility, the what is ATR in trading guide covers the indicator from scratch.
FAQ: EURUSD technical analysis questions
Is this EURUSD technical analysis a forecast?
No. It records where EURUSD stood on 7 October 2026 and shows how to read those levels. We do not predict direction, and we make no buy or sell calls.
Where did EURUSD close on 7 October 2026?
On OANDA data the close was 1.11782. That was below the 50-day SMA at 1.15154 and the 200-day SMA at 1.16015.
How many pips does EURUSD move in a day?
Our median daily range was 62.8 pips from 2018 to 2026. Quiet days ran about 37.2 pips and busy days about 112.7 pips.
Which session moves EURUSD the most?
The New York morning, 12:00 to 15:59 UTC, had the widest median range at 34.3 pips. The New York afternoon was the quietest at 21.7 pips.
Which ATR setting did we use?
We used the default length of 14 with RMA smoothing on the daily chart. It read 64.3 pips at the 7 October close.
Do the 50 and 200 SMA still matter on EURUSD?
They matter because many traders watch them. Still, they lag, and our median run on one side of the 50-day line lasted only 5 days.
How often should I redo this read?
Redo the daily levels each day and the weekly ones each week. The long-run profile changes slowly, so a yearly check is enough.
Can these levels tell me where to place a stop?
They can show where price has reacted before, and ATR can size the distance. Even so, the biggest day in our data moved 254.3 pips, so results are not guaranteed; past performance is not indicative of future results.
Last updated: 8 October 2026.

About the author
Written by Dominic Walsh, a Forex trader and MT4/MT5 indicator, Expert Advisor and script developer. Every tool on forexmt4systems.com is tested on live charts before release and ships with ready-to-use compiled MT4 (.ex4) and MT5 (.ex5) files. Learn more about the trader and developer behind this site.
How we build, test and correct every tool: Editorial & Testing Policy. Trading carries risk; see the disclaimer.