
The best forex pair for swing trading is not one fixed symbol, and anyone who names a single winner is skipping the trade-offs. So we measured instead. We took eight years of daily candles on 23 currency pairs and scored each one on three things a swing trader feels: how cleanly it trends over 20 days, how far it moves in a normal day, and how often it gaps over the weekend. This guide settles which pairs score well on each test, where the scores disagree, and why the top of the table is closer than most lists suggest.
What “best pair” means for a swing trader
A swing trade lasts from a couple of days to a few weeks. You hold through several sessions, often through a weekend, and you aim to catch one leg of a larger move. If you are still deciding whether the style suits you, our page on swing trading in forex covers the basics first.
For that kind of holding period, a good pair needs three traits. First, it should travel in one direction for long enough to pay for the wait. Second, its daily range should be large enough to clear costs, but not so large that a normal stop gets hit by noise. Third, it should not open on Monday far from where it closed on Friday, because a gap can jump straight past your stop.
No pair has all three traits all of the time. So we rank each trait separately, instead of blending them into one score that hides the trade-offs.
How trend efficiency, range and gap risk work
Our main yardstick is trend efficiency. It is the same idea as Perry Kaufman’s efficiency ratio, which StockCharts explains on its KAMA page at StockCharts ChartSchool. The formula is simple:
efficiency = |close today - close 20 days ago| / sum of the 20 daily |close-to-close| moves
A value of 1 means price moved in a straight line. A value near 0 means it went up and down and ended where it started.
The second yardstick is the median daily range: high minus low, measured over the last three years. We show it in pips and as a percent of price, because 100 pips means something very different on a yen cross than on EURGBP. If you want a refresher on range tools, read what ATR is in trading, or see TradingView’s own Average True Range help page at TradingView.
The third yardstick is weekend gap risk. We count the share of weekends where Monday opened more than a quarter of the 14-day ATR away from Friday’s close.
How we tested
All three measurements come from MetaTrader 4, build 1471, using the Capital Point Trading terminal history. The daily set covers 23 FX pairs from 12 June 2018 to 24 August 2026, a total of 37,748 daily candles. We read the history files directly and computed every figure ourselves.
Efficiency was sampled every 5 days across that full window, and we report the median for each pair. The daily range uses the last 750 bars, roughly three years. The weekend gap share comes from our earlier weekend-gap measurement on the same terminal, where a gap is Monday’s open minus the prior trading day’s close.
Next, we looked at the extremes on live charts. The candle charts in this guide are TradingView web chart captures of OANDA daily data, taken on 7 October 2026. They show roughly the last 250 trading days, so they run past the end of our MT4 data. Treat them as pictures of character, not as part of the measured sample.
These are descriptive statistics, not a trading test. Any trade built on them pays spread, swap and commission, and our MT4 history has no usable spread record. Our full method rules are on the editorial testing policy page.
Measurement settings at a glance
Here are the exact parameters behind every number on this page. Other settings will shuffle the middle of the table.
| Parameter | Value we used | Why it matters |
|---|---|---|
| Timeframe | D1 (daily candles) | Matches a multi-day holding period |
| Pairs | 23 FX pairs, majors and crosses | No gold, no indices, no exotics |
| Efficiency window | 20 trading days | About one month of swing holding |
| Efficiency sampling | Every 5 days since 2018 | Median of many overlapping windows |
| Range window | Last 750 daily bars (about 3 years) | Recent volatility, not 2018 volatility |
| Gap threshold | More than 0.25 x 14-day ATR | Scales the gap to each pair’s normal move |
| Costs | None included | Our history has no usable spread data |
Reading the best forex pair for swing trading on a chart
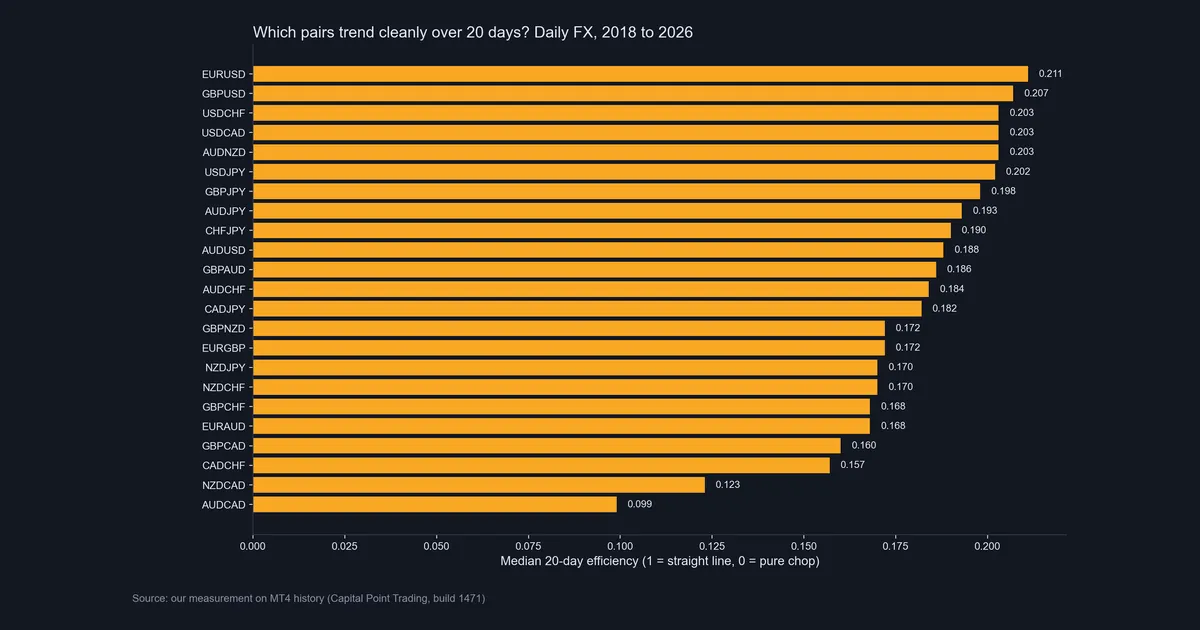
The first ranking puts EURUSD on top at 0.211, then GBPUSD at 0.207. After that, USDCHF, USDCAD and AUDNZD all sit at 0.203, with USDJPY at 0.202. At the bottom, NZDCAD scores 0.123 and AUDCAD only 0.099.
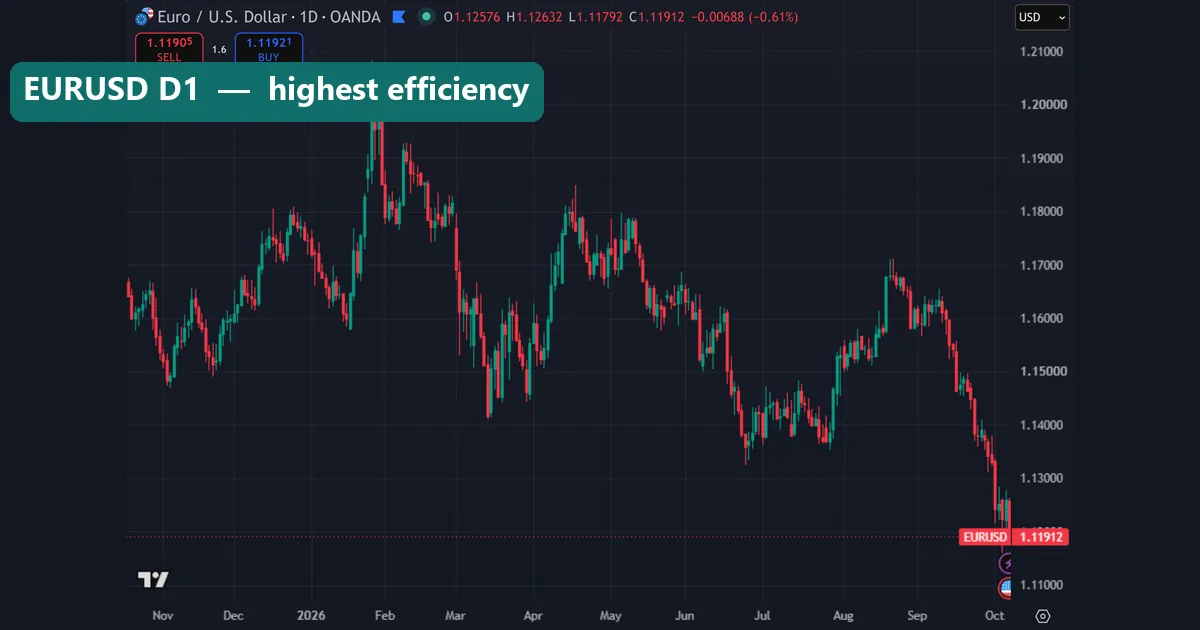
Look at the EURUSD daily chart first. It shows clear legs: a run up into late January near 1.21, a drift lower from May into July, a rally in August, and then a steep slide in September that ends near 1.119 at the last close shown. Each leg lasts weeks, which is the shape a swing trader wants.
Now compare AUDCAD. Here is the twist: in this particular window, AUDCAD also trended. It climbed from about 0.91 in November to around 0.99 by May. However, from May onward it went flat, and the candles overlap heavily between roughly 0.975 and 1.00.
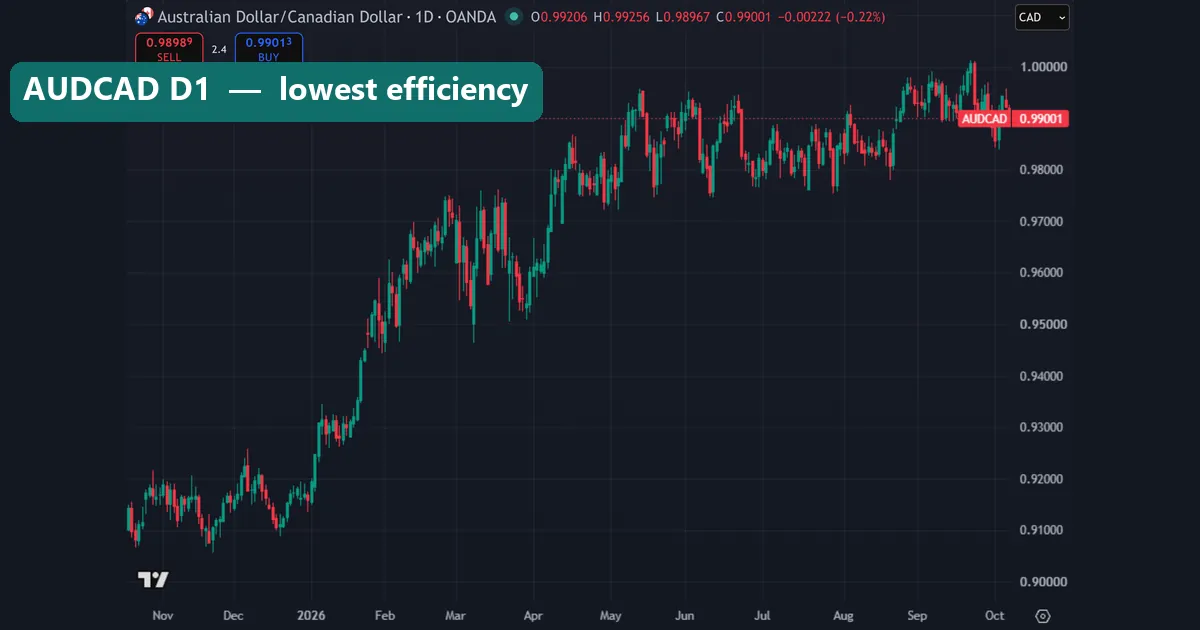
That contrast matters. Our median says AUDCAD is the choppiest pair across eight years, yet one 250-day window can still look tidy. In short, a ranking describes the typical month, not the next one.
Worked example: EURUSD against AUDCAD
Let’s put real numbers side by side. EURUSD has a median 20-day efficiency of 0.211. AUDCAD has 0.099. So in a typical 20-day stretch, about a fifth of EURUSD’s travel turns into net progress. For AUDCAD, it is about a tenth.
Next, look at the daily ranges. EURUSD’s median day spans 62.8 pips, or 0.564% of price. AUDCAD’s spans 53.8 pips, or 0.57%. In percent terms, the two pairs move almost the same distance each day. The difference is what happens across days. EURUSD’s daily moves add up in one direction more often. AUDCAD’s moves cancel each other out more often.
Then add weekend risk. On EURUSD, 13.2% of weekends opened beyond a quarter of the ATR. On AUDCAD, the figure was 51.6%. However, AUDCAD only had 62 weekends in that gap sample, against 317 for EURUSD, so its figure is far less firm.
Finally, EURUSD’s largest close-to-close day was 254.3 pips on 10 April 2025, while AUDCAD’s was 128.4 pips on 10 October 2025.
So which is better? For holding a trend for weeks, EURUSD scores better on every line. For a range trader who sells the top and buys the bottom of a box, AUDCAD’s chop is the feature, not the flaw. The same numbers support two different styles.
Daily range: how far each pair moves
The second chart ranks the median daily range as a percent of price. AUDJPY leads at 0.88%, about 88 pips. NZDJPY follows at 0.87%. At the quiet end, USDCAD sits at 0.45% and EURGBP at 0.40%, about 34 pips.
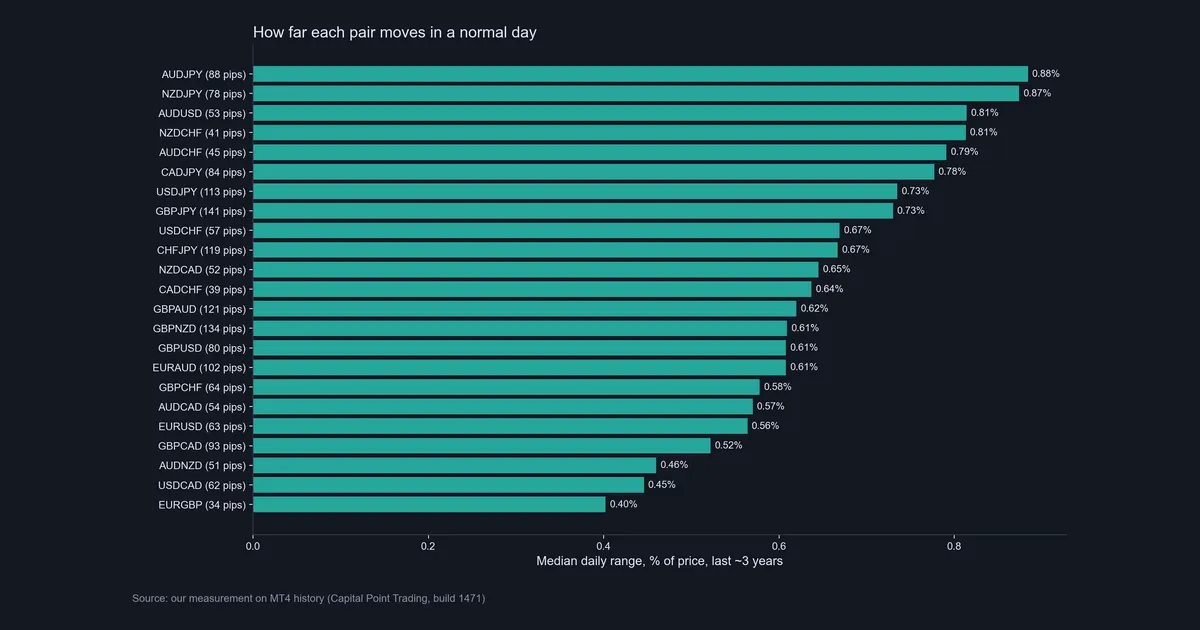
Pip counts can mislead you here. GBPJPY has the biggest pip range in the set, 141.2 pips. Yet as a percent of price it is only 0.73%, below AUDJPY. That is because GBPJPY trades above 200 yen, so each pip is a smaller share of price.
The GBPJPY daily chart shows what a wide range feels like in practice. Its price axis spans roughly 198 to 220 over the window. Look at the two sharp drops near the start of August and early September, each erasing weeks of gains in a few candles. A swing stop on this pair must be wide, and your position size based on ATR must shrink to match.
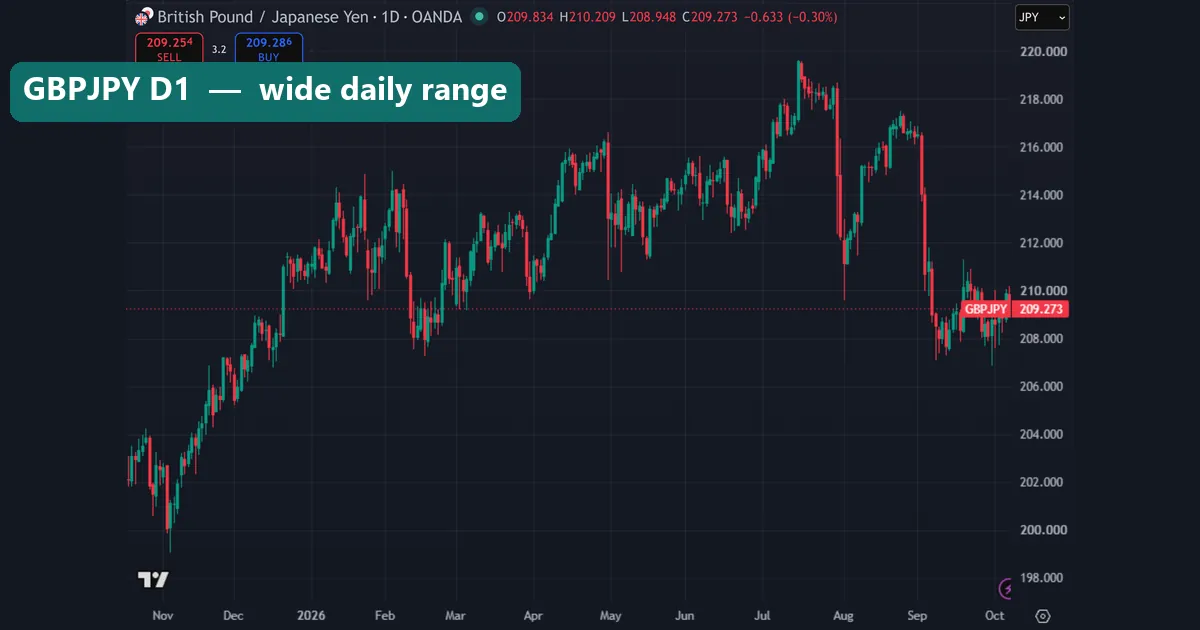
GBPJPY’s largest close-to-close day reached 578.3 pips on 20 December 2022. The fast movers are covered in our guide to volatile forex pairs.
Trade-offs: matching a pair to your swing style
Because no pair wins every test, the useful question is which trade-off you can live with.
- Trend-pullback swing trading. Look at the top of the efficiency table: EURUSD, GBPUSD, USDCHF, USDCAD and USDJPY. They also have some of the lowest weekend gap shares, from 11.4% on USDCAD to 25.6% on USDCHF.
- Small account, tight stops. Lower percent ranges, such as USDCAD at 0.45% or EURGBP at 0.40%, let you size up without a huge stop. But EURGBP’s efficiency is only 0.172, so expect more back-and-forth.
- Range swing trading. The low-efficiency crosses, NZDCAD and AUDCAD, chop the most. That suits fading the edges of a range, but their weekend gap shares are the highest in the set.
- Bigger targets. The yen crosses travel furthest per day. In return, their stops are wider and their shocks larger.
Liquidity is a separate factor. The major dollar pairs dominate global turnover, as the BIS Triennial Survey of FX turnover at the Bank for International Settlements shows. Deeper markets usually mean tighter spreads. Our page on the major currency pairs covers that group in detail.
Download the complete indicator database
Put these concepts on your charts. One email unlocks the full library of 1,380+ indicators with compiled MT4 and MT5 files, plus my TradingView scripts. No paywall, no spam, unsubscribe any time.
Get free access to my indicator database
One email unlocks 1,380+ free MT4, MT5 and TradingView indicators — the complete library. No single-tool download; you get the whole database.
Where it fails
First, the gaps at the top are tiny. EURUSD’s 0.211 and USDJPY’s 0.202 differ by less than one hundredth. With this kind of measurement, that gap is too small to call a real ranking. So treat the top six as a group, not as first through sixth.
Second, medians hide regimes. AUDCAD ranked last, yet our own chart shows it climbing for months. Equally, a top pair can chop for a whole quarter. The EURUSD chart has several weeks of sideways candles in July.
Third, efficiency says nothing about direction or entry. Our test used no entry rule, so it shows no trading edge on its own.
Fourth, costs are missing. Every figure here is before spread, swap and commission. Swing trades pay overnight swap every day they stay open, and that cost varies by pair and direction. Read how swap works in forex before you hold for weeks.
Weekend gaps and the runner-up pair
The weekend chart flips the efficiency chart almost upside down. AUDCAD tops it at 51.6% and NZDCAD follows at 49.1%. At the safe end sit USDCAD at 11.4%, USDJPY at 11.7% and EURUSD at 13.2%.
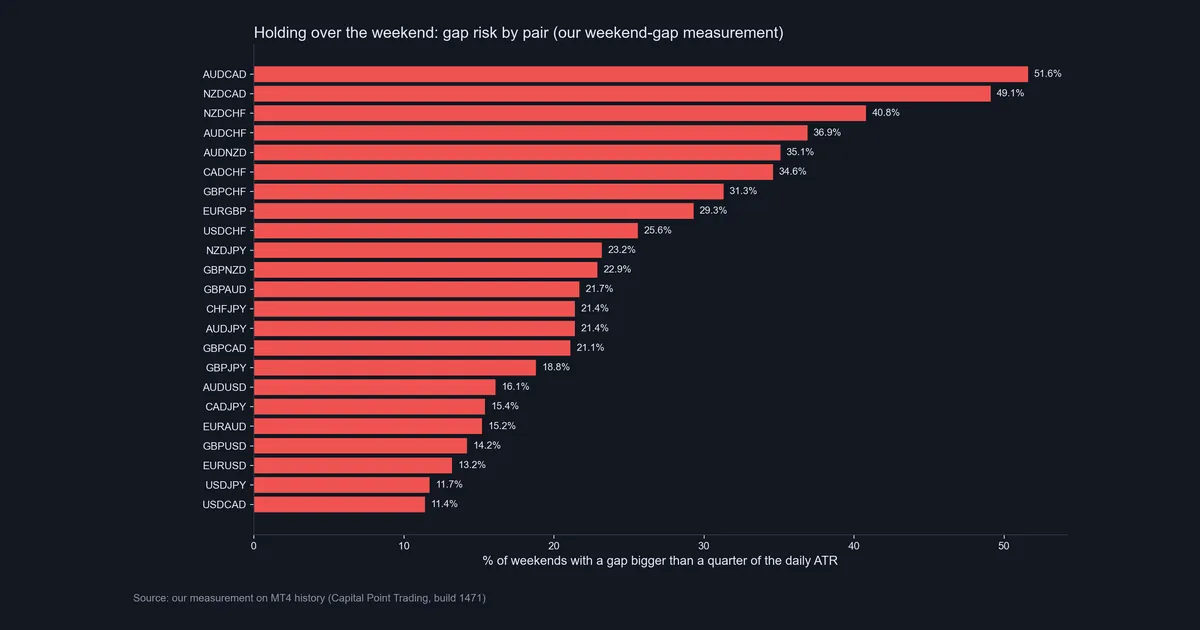
Context helps here. Across all 7,409 weekends in our set, 23.7% gapped beyond a quarter of the ATR. Also, 92.2% of all gaps were filled by price trading back to Friday’s close during the same Monday. So a typical gap is a nuisance, not a disaster. The danger is the rare large one that jumps your stop. Our guide to the weekend gap in forex covers how to plan for it.
The runner-up on efficiency was GBPUSD at 0.207. Its daily chart looks a lot like EURUSD’s: a peak near 1.387 in late January, a slide into the spring, and a drop to about 1.32 by early October.
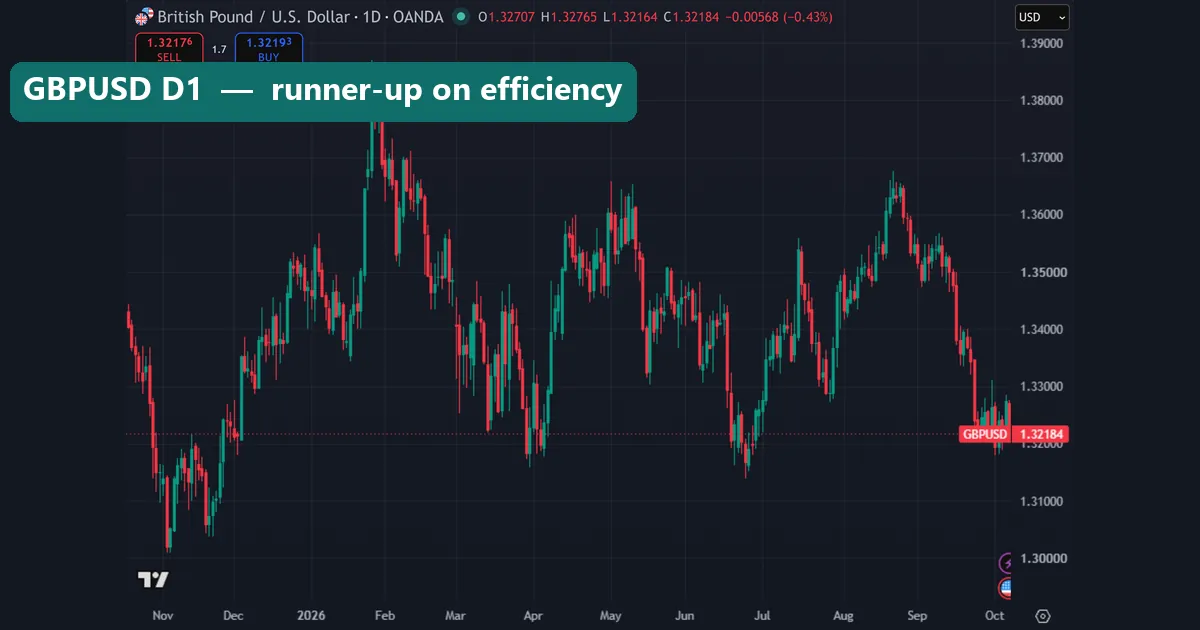
That likeness is the point. EURUSD and GBPUSD share the dollar, so they often move together. If you hold both at once, you may be making one dollar bet twice. Check our forex correlation matrix before you stack positions. GBPUSD also moves more per day than EURUSD, 79.6 pips against 62.8, and its largest close-to-close day reached 404.6 pips on 23 September 2022.
Common mistakes when choosing a swing pair
- Picking by pip range alone. A 141-pip day on GBPJPY is 0.73% of price, while 53 pips on AUDUSD is 0.81%. Compare in percent, not pips.
- Trading too many correlated pairs. Five dollar pairs at the top of the table can act like one trade. Then a single dollar move hits all of them. Our page on portfolio heat shows how to cap total risk.
- Ignoring Monday. Many traders set a stop and forget that a gap can open beyond it. On crosses with high gap shares, size for that.
- Treating a ranking as a forecast. Our numbers describe 2018 to 2026. They do not promise that next month will look the same. Always read the current chart, as the AUDCAD example shows.
Where to go next
If you are new to the style, start with how to swing trade forex. Then compare holding periods in swing vs day trading and position vs swing trading.
For trend tools on daily charts, see trend-following trading and the best MACD settings for swing trading. For a broader view of the market, the swing trading article on Wikipedia gives a neutral summary of the style.
FAQ
What is the best forex pair for swing trading?
No single pair wins every test; in our measurement EURUSD and GBPUSD trended most cleanly over 20 days, while USDCAD had the lowest weekend gap share, so the right choice depends on your style.
Why does EURUSD rank first on efficiency?
Its median 20-day efficiency was 0.211, the highest of 23 pairs, but USDJPY at 0.202 is so close that the top six pairs are best treated as one group.
Is a high daily range good for swing trading?
It helps targets but forces wider stops and smaller positions, so compare ranges in percent of price, where AUDJPY led at 0.88% and EURGBP was lowest at 0.40%.
Are crosses like AUDCAD bad for swing trading?
They suit trend holding less, since AUDCAD’s median efficiency was only 0.099, but their chop can suit range trading if you accept higher weekend gap risk.
How often do weekend gaps hurt a swing trade?
Across 7,409 weekends, 23.7% gapped beyond a quarter of the 14-day ATR, and most gaps were filled on the same Monday, but a rare large gap can still jump a stop.
Should I trade EURUSD and GBPUSD together?
You can, but both share the dollar and often move together, so holding both can double one bet.
Do these numbers include spread and swap?
No, every figure is before spread, swap and commission, because our MT4 history has no usable spread record, and swap matters a lot for trades held for weeks.
Can this ranking tell me which pair will trend next month?
No, it describes how each pair behaved from 2018 to 2026 and is not a forecast or an entry rule; results are not guaranteed; past performance is not indicative of future results.
Last updated: 7 October 2026.

About the author
Written by Dominic Walsh, a Forex trader and MT4/MT5 indicator, Expert Advisor and script developer. Every tool on forexmt4systems.com is tested on live charts before release and ships with ready-to-use compiled MT4 (.ex4) and MT5 (.ex5) files. Learn more about the trader and developer behind this site.
How we build, test and correct every tool: Editorial & Testing Policy. Trading carries risk; see the disclaimer.