
The best MACD setting for swing trading is usually the one you already have. The default 12-26-9 was designed for daily charts held over days and weeks, which is exactly what swing trading is. This guide explains why the defaults fit. It covers which timeframe to use, when 19-39-9 helps, and how to read the histogram.
Why the default is the best MACD setting for swing trading
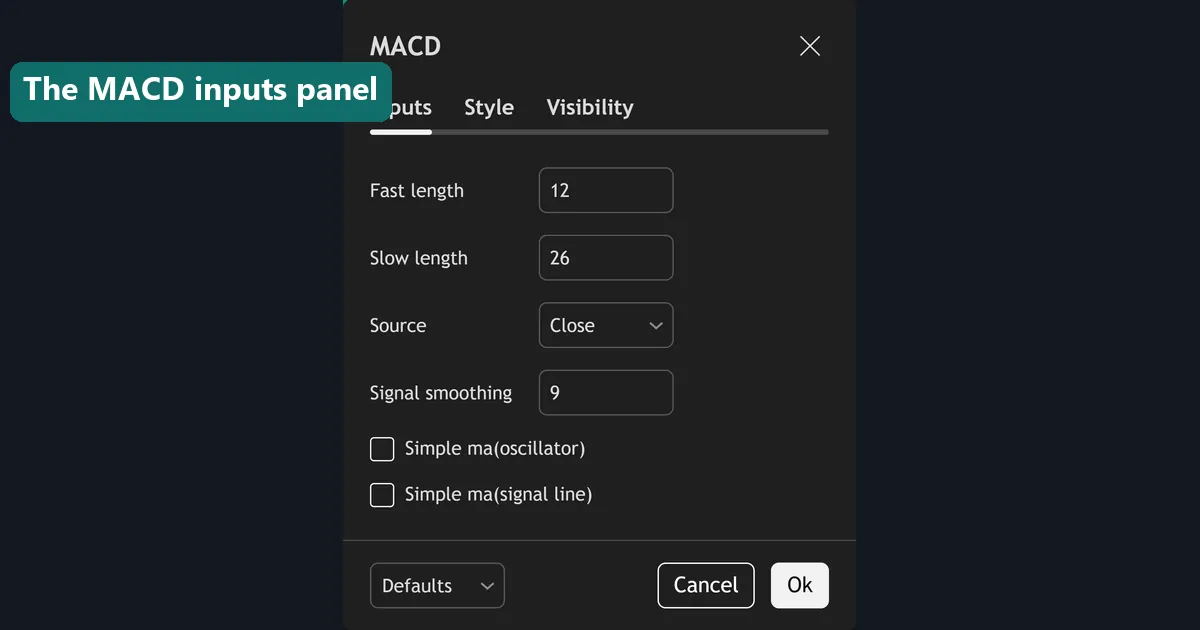
Gerald Appel built MACD in the late 1970s for daily stock charts. The 12 and 26 periods approximate two and four trading weeks, and the 9-period signal line smooths about two weeks of that difference. Those windows match a holding period of several days to several weeks.
Scalpers change the numbers because they are applying a daily-chart tool to a five-minute chart, where 26 bars covers barely two hours. Swing traders have no such mismatch. Running 12-26-9 on H4 or the daily chart puts the indicator back in the environment it was designed for.
So the honest answer is simple. The default is the baseline, and any change needs a specific reason. Our guide to the best MACD settings covers the defaults in more detail, and MACD scalping settings covers the opposite direction.
Timeframe matters more than the inputs
Before changing a single number, check the chart you are on. The same 12-26-9 behaves completely differently across timeframes because the periods measure bars, not time.
| Timeframe | 26 bars covers | Signals per month | Suits |
|---|---|---|---|
| H1 | About one day | Many | Intraday, too noisy for swings |
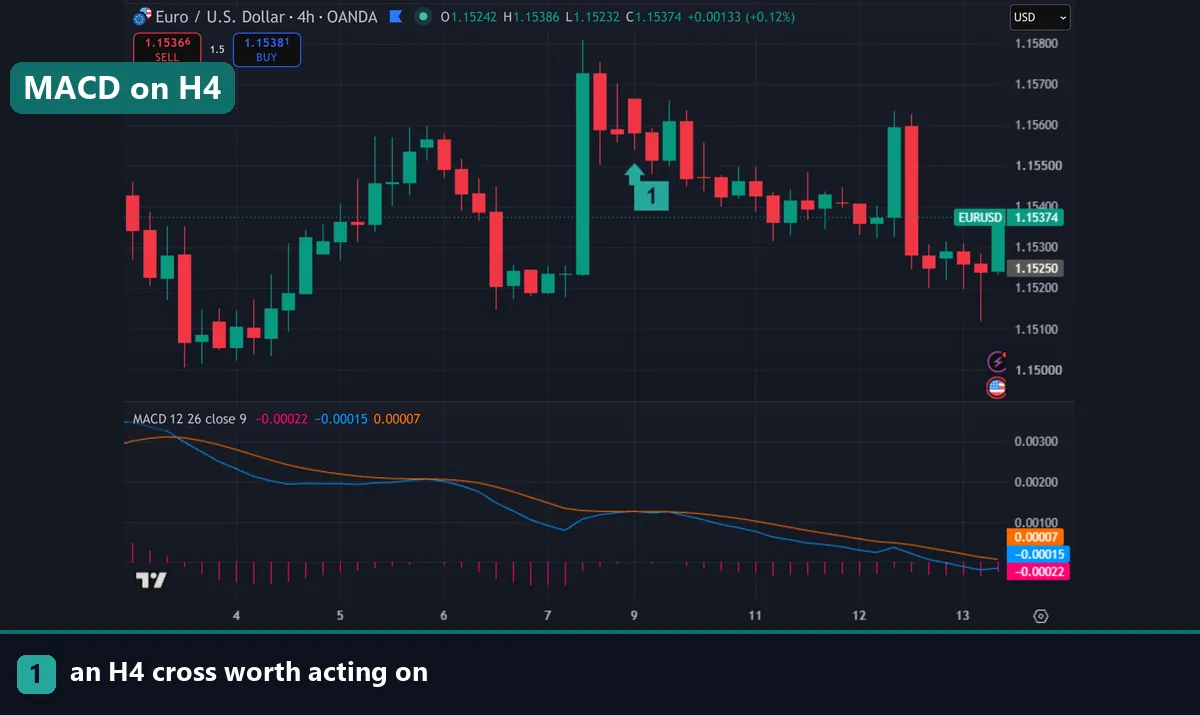
| H4 | About four days | Several | Swing entries and timing |
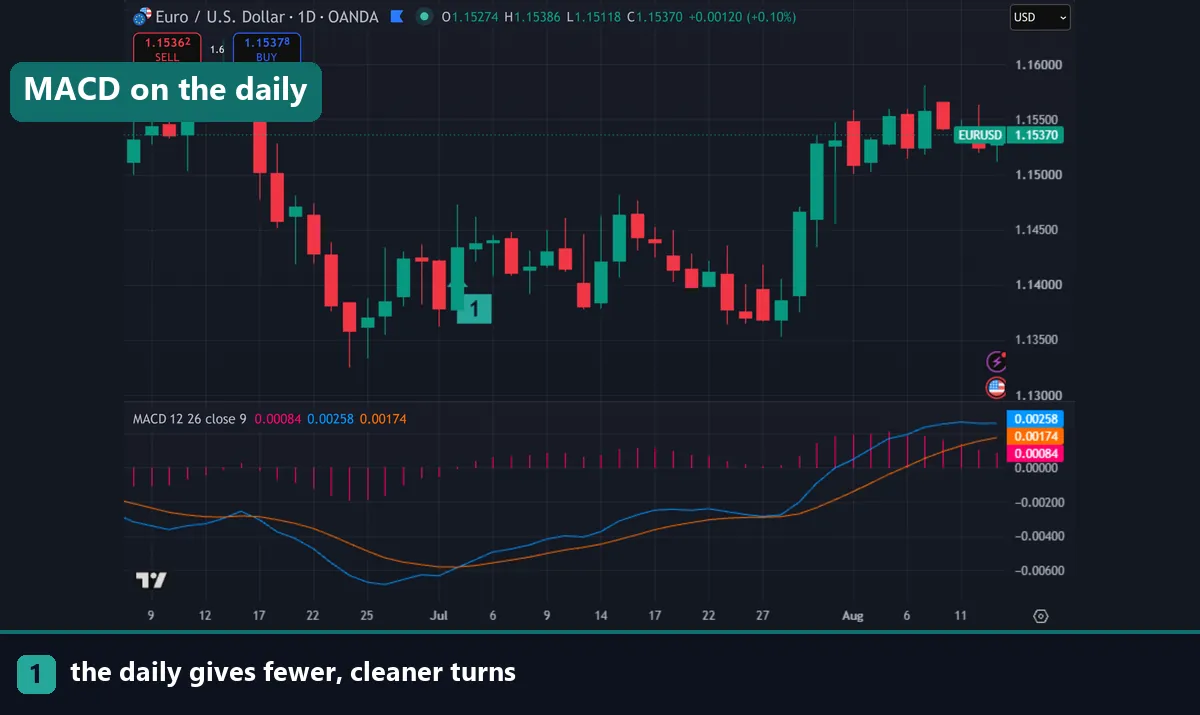
| Daily | About five weeks | One or two | Swing bias and position trades |
| Weekly | About six months | Rare | Long-term context only |
Most swing traders settle on a two-chart arrangement. The daily MACD sets direction, and the H4 MACD times the entry within it. That gives you the daily chart’s reliability without waiting weeks between signals.
Moving from H1 to H4 removes far more noise than any input change could, and it costs you nothing in signal quality.
When slower inputs help
There is one situation where changing the numbers is justified. Say you trade a volatile instrument on H4. The default MACD crosses back and forth inside a single swing. Slowing it down reduces those whipsaws.
The common alternative is 19-39-9, which is roughly the default multiplied by 1.5. It stretches both averages while leaving the signal line alone, so crosses arrive later and less often. On instruments like GBPJPY or XAUUSD, where ordinary noise is large, that trade-off is often worth taking.
A second option is 24-52-9, effectively the default doubled. It turns an H4 MACD into something close to a daily MACD without leaving the H4 chart. Traders who want daily-chart smoothness but H4 entry precision sometimes use it.
Both changes cost you timing. A slower MACD confirms later, so you enter further into the move. Accept that explicitly rather than discovering it after twenty trades.
Read the histogram, not just the cross
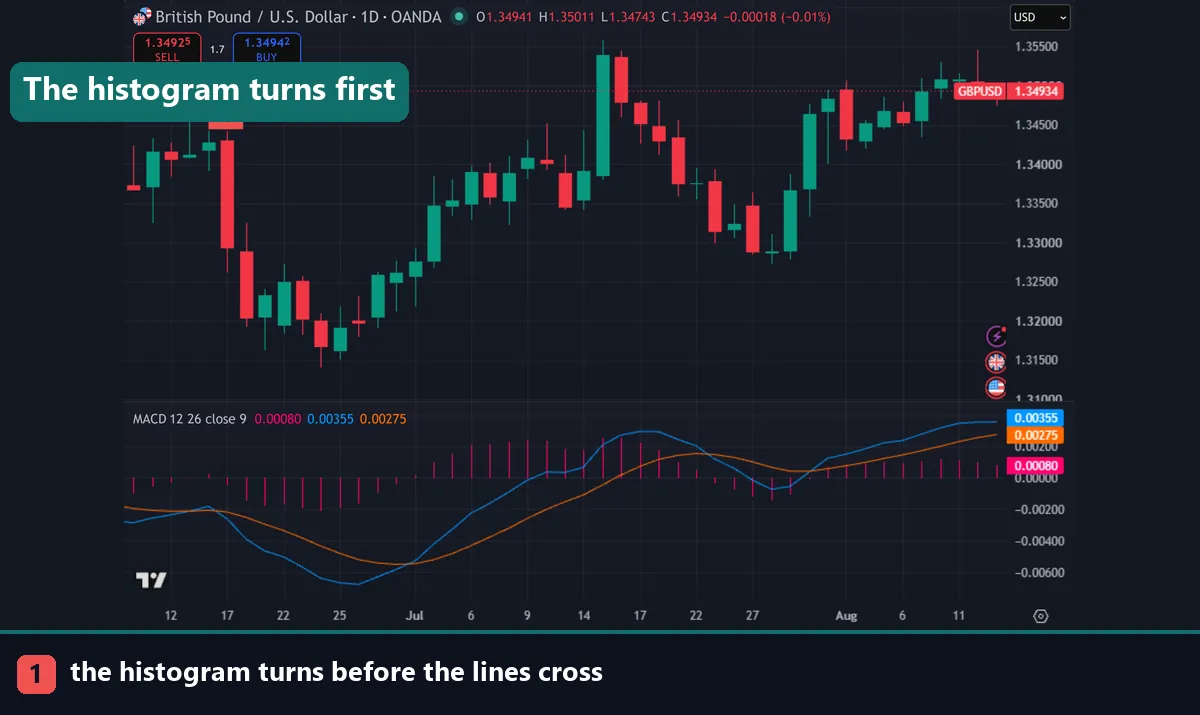
The signal-line cross is the headline, and it is the slowest thing MACD produces. The histogram measures the distance between the MACD line and the signal line, so it starts shrinking before they meet.
That gives you an earlier read. Watch for histogram bars that stop growing and start to contract. Momentum is fading, whether or not a cross follows. Swing traders use this two ways. It warns them to tighten a stop, and it flags an entry worth preparing.
Divergence is the other histogram read. Price makes a higher high while the histogram makes a lower high, which says the new high came with less momentum behind it. Our bullish divergence guide covers the mechanics and, importantly, the fact that divergence can persist for a long time before anything happens.
Download the complete indicator database
Put these concepts on your charts. One email unlocks the full library of 1,380+ indicators with compiled MT4 and MT5 files, plus my TradingView scripts. No paywall, no spam, unsubscribe any time.
Get free access to my indicator database
One email unlocks 1,380+ free MT4, MT5 and TradingView indicators — the complete library. No single-tool download; you get the whole database.
The filter that matters
MACD is a momentum oscillator, and momentum tools generate counter-trend signals constantly. On a swing timeframe those are the expensive ones, because you hold them for days.
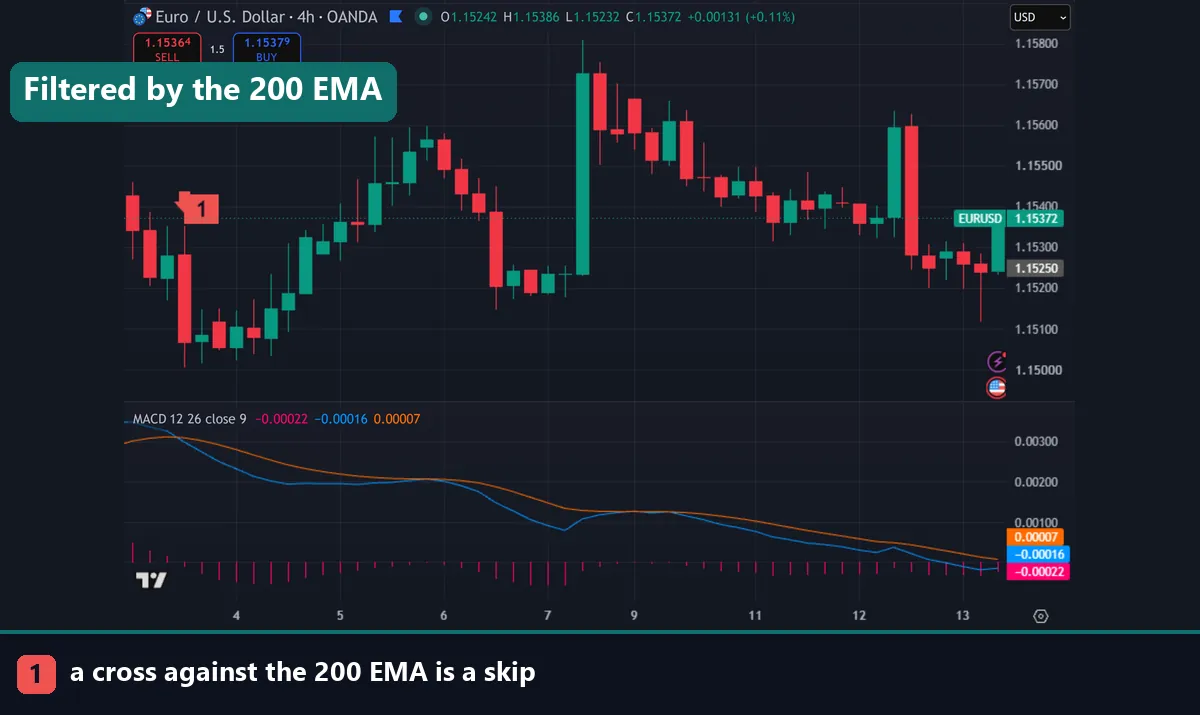
The standard fix is a long moving average on the same chart. With a 200 EMA on H4, take bullish crosses only above the line and bearish crosses only below it. That single rule removes a large share of the signals that would have fought the prevailing move. Our EMA trading strategies guide covers the variations, and forex swing trading strategies shows the full workflow.
The alternative filter is structure. Take long signals only while the chart is making higher highs and higher lows. It requires more judgement than a moving average, and it adapts faster at genuine turns.
Zero-line crosses versus signal-line crosses
MACD produces two different crosses and they mean different things. A signal-line cross happens when the MACD line crosses its own smoothed version. It flags a shift in short-term momentum and arrives relatively early.
A zero-line cross happens when the MACD line passes through zero, which means the fast average has crossed the slow one. That is a change in trend rather than momentum, and it arrives much later.
Swing traders often combine them. The zero line defines the regime you are trading in, and signal-line crosses within that regime provide entries. Taking only the signal crosses that agree with the current side of zero is effectively a filter built from the indicator itself.
Common mistakes
Four repeat. Changing the inputs before checking the timeframe tops the list, since moving from H1 to H4 solves most noise complaints on its own. Taking every cross without a trend filter comes second, and on swing holds those trades are costly. Third, traders act on divergence immediately, when it can run for weeks. Fourth, they optimise settings on a short backtest and adopt whatever scored highest, which is curve fitting rather than research.
Test any change over at least fifty trades on the pair you actually trade, and log the timeframe and filter alongside the result.
Where to go next
MACD is one component of a swing method. Build the surrounding rules with forex swing trading strategies. Set stops with how to use ATR as a stop loss. Then size the trade with the forex position sizing calculator. For faster settings at the other extreme, see MACD scalping settings. To load a custom MACD variant, follow how to install MT4 and MT5 indicators. For further reading, see the MACD article on Wikipedia. StockCharts also covers the MACD oscillator in the StockCharts ChartSchool.
FAQ
What is the best MACD setting for swing trading?
The default 12-26-9 on H4 or the daily chart, because those periods were designed for exactly that holding period. Slower inputs such as 19-39-9 help only on noisy instruments where the default whipsaws inside a single swing.
Should I use H4 or the daily chart?
Many swing traders use both. The daily MACD sets direction. The H4 MACD times the entry, so you keep daily reliability without waiting weeks.
What does 19-39-9 change?
It stretches both moving averages by roughly half again while leaving the signal line at 9. Crosses arrive later and less often, which cuts whipsaws at the cost of entering further into the move.
Is the histogram better than the cross?
It is earlier, not better. The histogram measures the gap between the lines, so it contracts before they meet. Use it as advance warning and the cross as confirmation.
What is the difference between the zero line and the signal line cross?
A signal-line cross flags a momentum shift and arrives early. A zero-line cross means the fast average crossed the slow one, which marks a trend change and arrives much later.
Will the right MACD setting make swing trading profitable?
Settings change timing rather than create an edge, and the trend filter matters more than the numbers. Trading involves risk, results are not guaranteed, and past performance is not indicative of future results.

About the author
Written by Dominic Walsh, a Forex trader and MT4/MT5 indicator, Expert Advisor and script developer. Every tool on forexmt4systems.com is tested on live charts before release and ships with ready-to-use compiled MT4 (.ex4) and MT5 (.ex5) files. Learn more about the trader and developer behind this site.
How we build, test and correct every tool: Editorial & Testing Policy. Trading carries risk; see the disclaimer.