
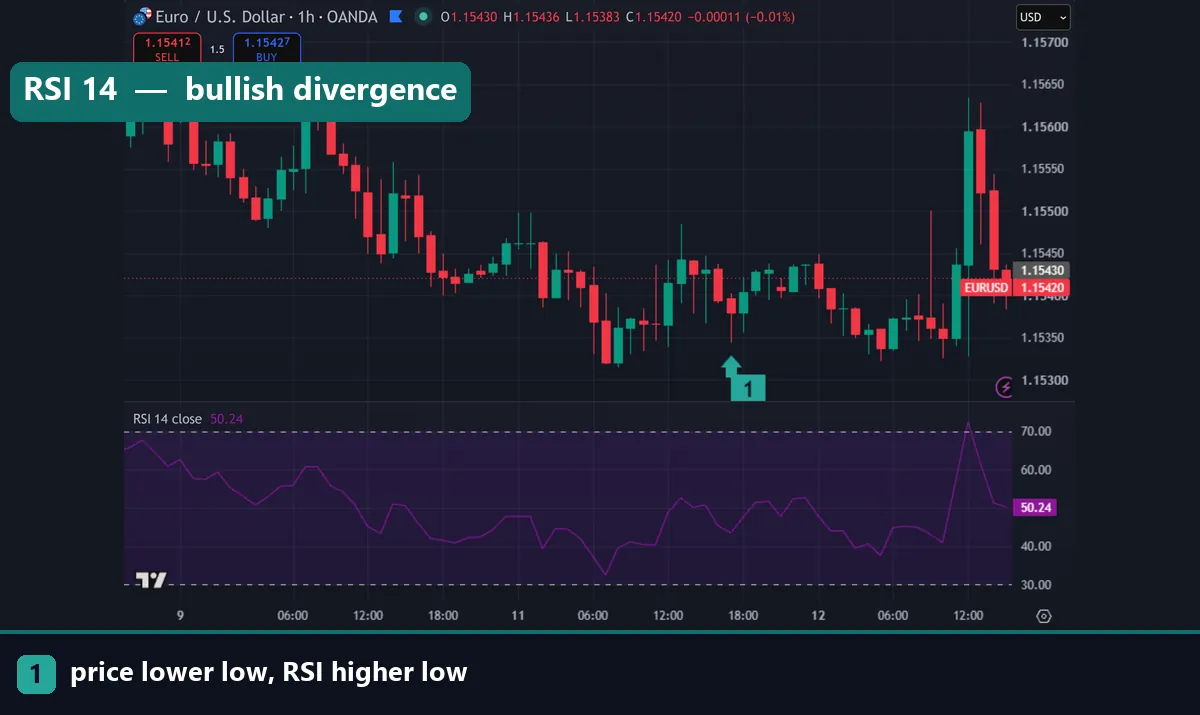
A bullish divergence happens when price makes a lower low but the oscillator underneath makes a higher low. In plain terms, the market printed a fresh low without the selling force that drove the previous one. Momentum is fading even though price is not. That mismatch is the whole idea, and it is why traders watch for bullish divergence near the end of a decline. This guide covers the meaning, the difference between regular and hidden divergence, which oscillators show it most clearly, a step-by-step spotting routine, and the honest reasons divergence fails.
Bullish divergence meaning, without the jargon
Think of price and momentum as two witnesses describing the same sell-off. Price says the decline is getting worse, because each low undercuts the last. Momentum disagrees: each push down travels a shorter distance, closes with smaller bodies, and recovers faster. When the oscillator records that disagreement as a higher low, you have bullish divergence.
Sellers are not gone at that point. They are simply working harder for less. Late in a downtrend, that often means the easy supply has already been dumped and the remaining sellers are chasing. Buyers then need only a small trigger to reverse the move.
Crucially, divergence describes a condition, not an event. Nothing has changed on the price chart yet. The low is still lower. So the correct mental label is “warning”, and the correct next step is to wait for price to agree.
Regular vs hidden bullish divergence
Two versions exist, and they point in opposite directions structurally. Mixing them up is the most common beginner error.
Regular bullish divergence hints at a turn. Price makes a lower low; the oscillator makes a higher low. It appears at the tail of a downtrend and suggests the trend may be exhausting. Traders use it to hunt bottoms, which is exactly why it needs strict confirmation.
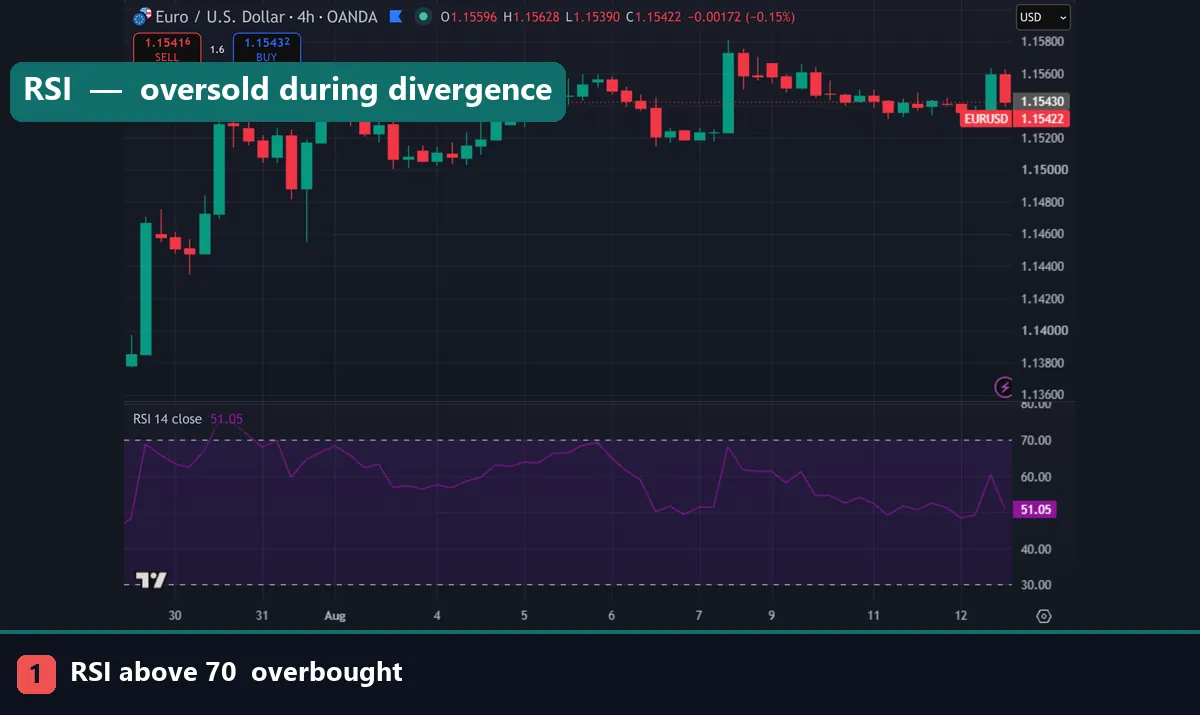
Hidden bullish divergence hints the trend will go on. Price makes a higher low; the oscillator makes a lower low. That pattern shows up during a pullback inside an uptrend. The deeper oscillator low simply reflects a healthy correction, while the higher price low proves the uptrend structure is intact. Hidden divergence therefore says “the trend is probably resuming”, not “the trend is over”.
Because hidden divergence trades with the prevailing trend, many traders find it the more forgiving of the two. Regular divergence fights the trend, and fighting trends is expensive when you are early.
Which oscillators show bullish divergence best
Any momentum tool can display divergence, but three dominate in practice.
RSI is the most widely used. A 14-period RSI produces smooth, well-defined swing lows that are easy to compare against price. Its limitation is that RSI compresses at extremes, so during a violent capitulation it can flatten out and mask the very divergence you are looking for. Our guide to the best RSI indicator settings covers the period choices that keep those swing lows readable.
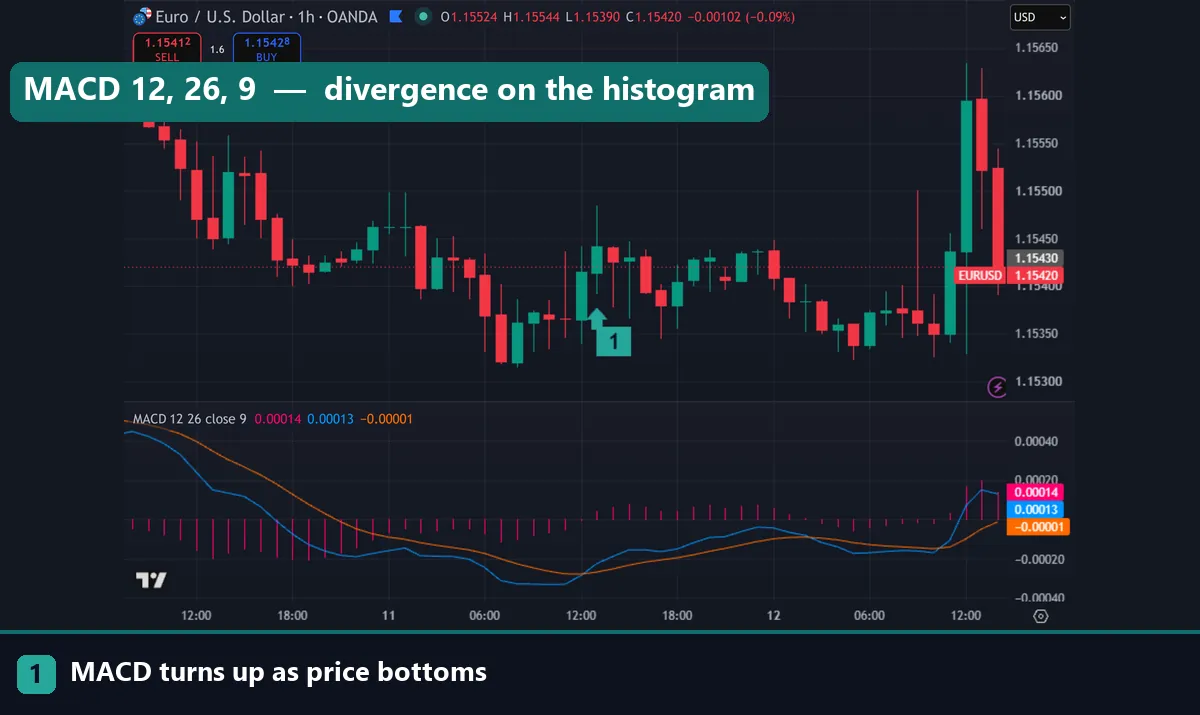
MACD works well on higher timeframes. Compare histogram troughs or the MACD line’s lows. Since MACD is unbounded, it does not compress the way RSI does, so deep sell-offs still register properly. The trade-off is lag: MACD confirms later, and on M5 charts the histogram whips around enough to invent divergences that vanish on the next candle. Tuning matters here, and our notes on the best MACD settings explain which combinations stay stable.
Stochastic reacts fastest and gives the earliest signal. Speed is also its weakness. The stochastic prints so many swing lows that you can find divergence almost anywhere if you look hard enough, which encourages exactly the kind of pattern-hunting that loses money.
How to spot bullish divergence step by step
Use a fixed routine so you are reading the chart rather than decorating it.
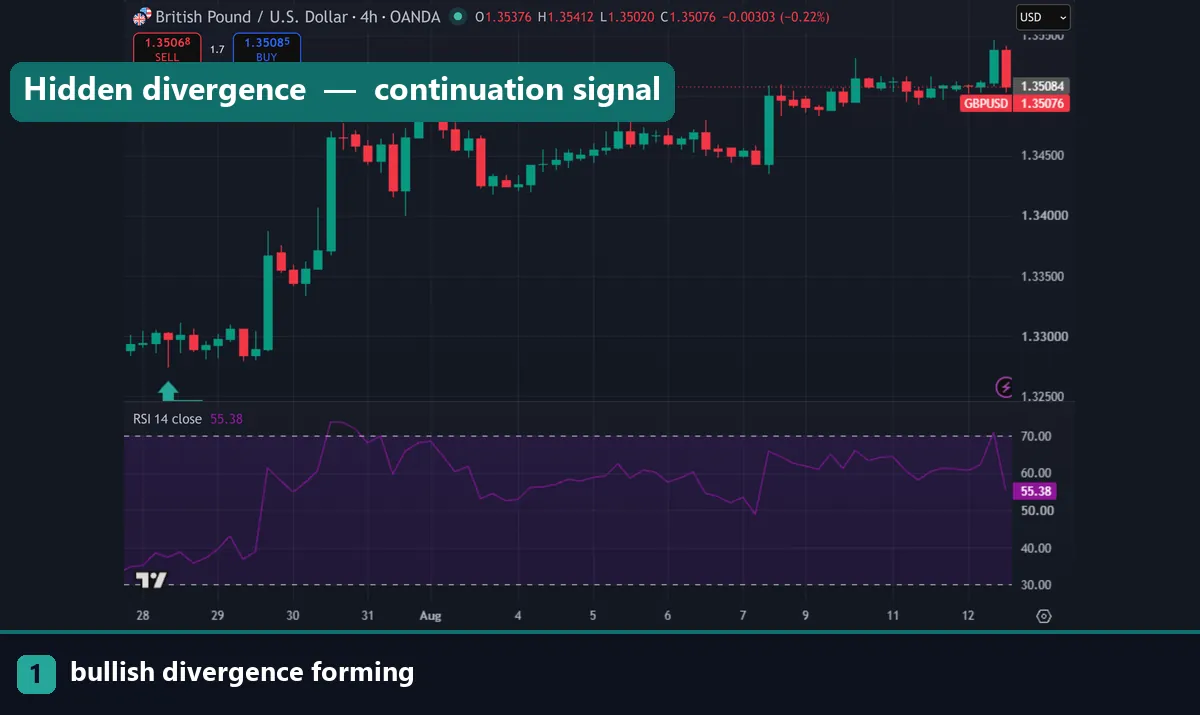
1. Confirm the context. Identify whether price is in a downtrend (look for regular divergence) or pulling back inside an uptrend (look for hidden divergence). Context decides which pattern is even valid.
2. Mark two swing lows on price. Both must be obvious pivots with clear candles either side. Ignore single-wick lows buried inside a range.
3. Mark the matching oscillator lows. The oscillator troughs must line up with those same price pivots, not with random dips between them.
4. Compare the two slopes. Price down and oscillator up gives regular bullish divergence. Price up and oscillator down gives the hidden version.
5. Wait for confirmation. A break of the most recent minor swing high, a bullish engulfing candle, or a reclaim of a broken level all qualify. Learning to read candlestick charts properly is what turns a divergence into an entry with a defined stop.
6. Place the stop below the divergence low. If price takes out that low, the premise is dead. Exit and move on.
Divergence types at a glance
| Type | Price makes | Oscillator makes | Appears in | Suggests |
|---|---|---|---|---|
| Regular bullish | Lower low | Higher low | Downtrend, late stage | Possible bottom / reversal up |
| Hidden bullish | Higher low | Lower low | Pullback in an uptrend | Uptrend likely resuming |
| Regular bearish | Higher high | Lower high | Uptrend, late stage | Possible top / reversal down |
| Hidden bearish | Lower high | Higher high | Rally in a downtrend | Downtrend likely resuming |
Print that table and keep it beside the screen for a fortnight. Once the four combinations are automatic, divergence reading takes about three seconds per chart.
Why bullish divergence is a warning, not an entry
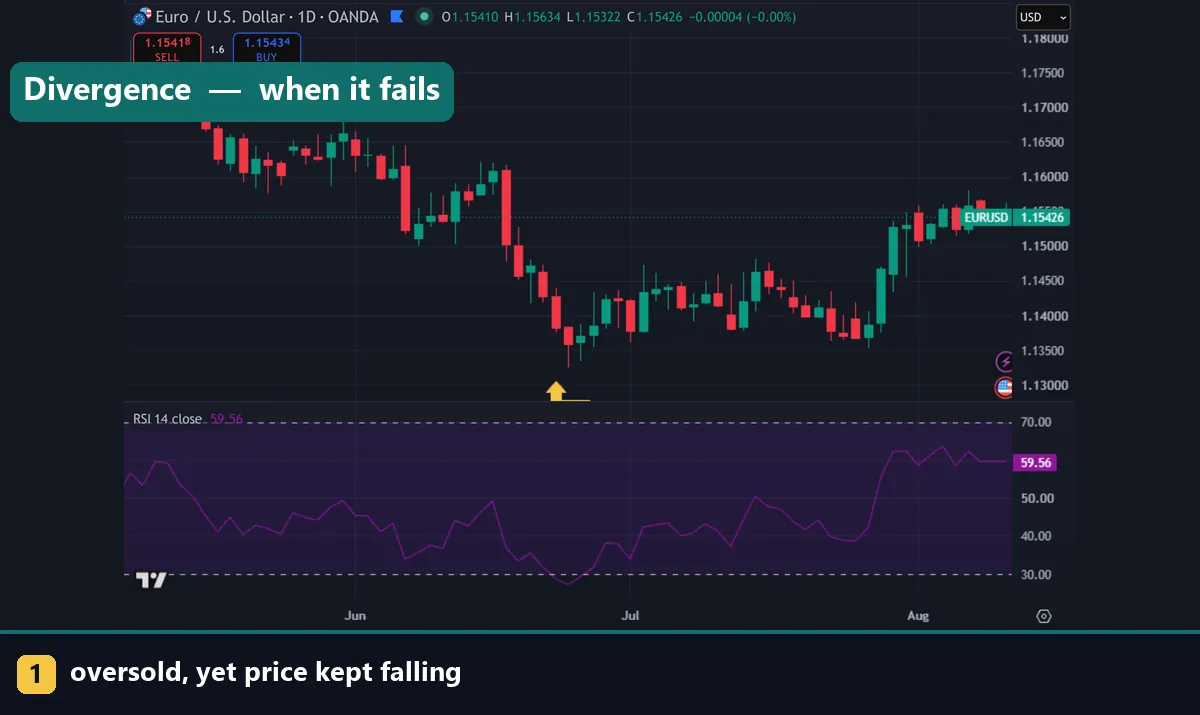
Here is the part most tutorials skip. Divergence can persist for a very long time in a strong trend. During a heavy downtrend, the oscillator may print three, four or five higher lows while price keeps grinding to new lows. Each of those is a textbook bullish divergence. Each one fails.
The reason is structural. An oscillator is bounded or mean-reverting by design, so it physically cannot keep making lower lows forever. Price has no such constraint. In a determined trend the two must eventually disagree, and that disagreement is a mathematical side effect rather than a reversal signal.
So treat divergence as a filter that tells you where to look, never as the trigger that tells you when to buy. The trigger has to come from price: a broken swing high, a higher low confirmed on the chart, a reclaimed support level. Traders who demand that confirmation take fewer trades and skip most of the failures. Traders who buy the divergence itself end up averaging down into a falling market.
One more practical guard: divergence on H4 and daily charts carries far more weight than divergence on M1. Lower timeframes generate a constant stream of small divergences, and most resolve into nothing.
Download the complete indicator database
Put these concepts on your charts. One email unlocks the full library of 1,380+ indicators with compiled MT4 and MT5 files, plus my TradingView scripts. No paywall, no spam, unsubscribe any time.
Get free access to my indicator database
One email unlocks 1,380+ free MT4, MT5 and TradingView indicators — the complete library. No single-tool download; you get the whole database.
Common bullish divergence mistakes
Four habits cause most of the damage. First, drawing lines between pivots that are not real swing lows, which manufactures divergence that no other trader can see. Second, using the wrong oscillator low, one that does not correspond to the price pivot you marked. Third, ignoring trend context and taking regular divergence signals against a powerful downtrend that has not shown a single sign of slowing. Fourth, trading without a stop below the low, on the theory that the divergence “should” hold. It often does not. Adding a broader confirmation layer helps, and the best day trading technical indicators roundup covers the volume and structure tools that pair well with divergence work.
Where to go next
Divergence is one input among several. Tighten your oscillator setup with our RSI settings guide and the MACD settings guide, then set up your platform using the walkthrough on installing MT4 and MT5 indicators. For outside reference, Investopedia defines divergence at Investopedia, and Wikipedia documents the relative strength index on Wikipedia, the oscillator most often used to find it.
FAQ
What does bullish divergence mean?
It means price printed a lower low while the oscillator printed a higher low. Selling momentum weakened even though price fell further, which hints that the downtrend may be running out of fuel.
What is the difference between regular and hidden bullish divergence?
Regular bullish divergence signals a possible reversal: price lower low, oscillator higher low, found at the end of a downtrend. Hidden bullish divergence signals continuation: price higher low, oscillator lower low, found during a pullback inside an uptrend.
Which indicator is best for bullish divergence?
RSI on a 14-period setting suits most traders because its swing lows are clean and easy to compare. MACD works better on H4 and daily charts, while stochastic fires earliest but produces the most false readings.
Can bullish divergence fail?
Yes, and it fails often in strong trends. An oscillator has a floor. So it can print higher lows again and again while price still slides. That is why confirmation from price structure is mandatory before entering.
Which timeframe is best for spotting divergence?
H1 and above give the most reliable readings, with H4 and daily the strongest. Below M15 the oscillator throws up small divergences all day. Most of them lead nowhere.
Is bullish divergence a guaranteed reversal signal?
No. Divergence only describes weakening momentum; it says nothing about when, or whether, price will turn. Always confirm with structure and manage the position with a stop. Trading involves risk, results are not guaranteed, and past performance is not indicative of future results.

About the author
Written by Dominic Walsh, a Forex trader and MT4/MT5 indicator, Expert Advisor and script developer. Every tool on forexmt4systems.com is tested on live charts before release and ships with ready-to-use compiled MT4 (.ex4) and MT5 (.ex5) files. Learn more about the trader and developer behind this site.
How we build, test and correct every tool: Editorial & Testing Policy. Trading carries risk; see the disclaimer.