
Elliott wave EURUSD analysis means labelling the pair’s swings into the five-three sequence Ralph Nelson Elliott described in the 1930s. Done carefully it gives you a map of where the current move sits and what would invalidate that view. Done carelessly it becomes an exercise in forcing labels onto noise. This guide covers the structure, the three rules that cannot be broken, and a repeatable way to count EURUSD without fooling yourself.
The five-three structure
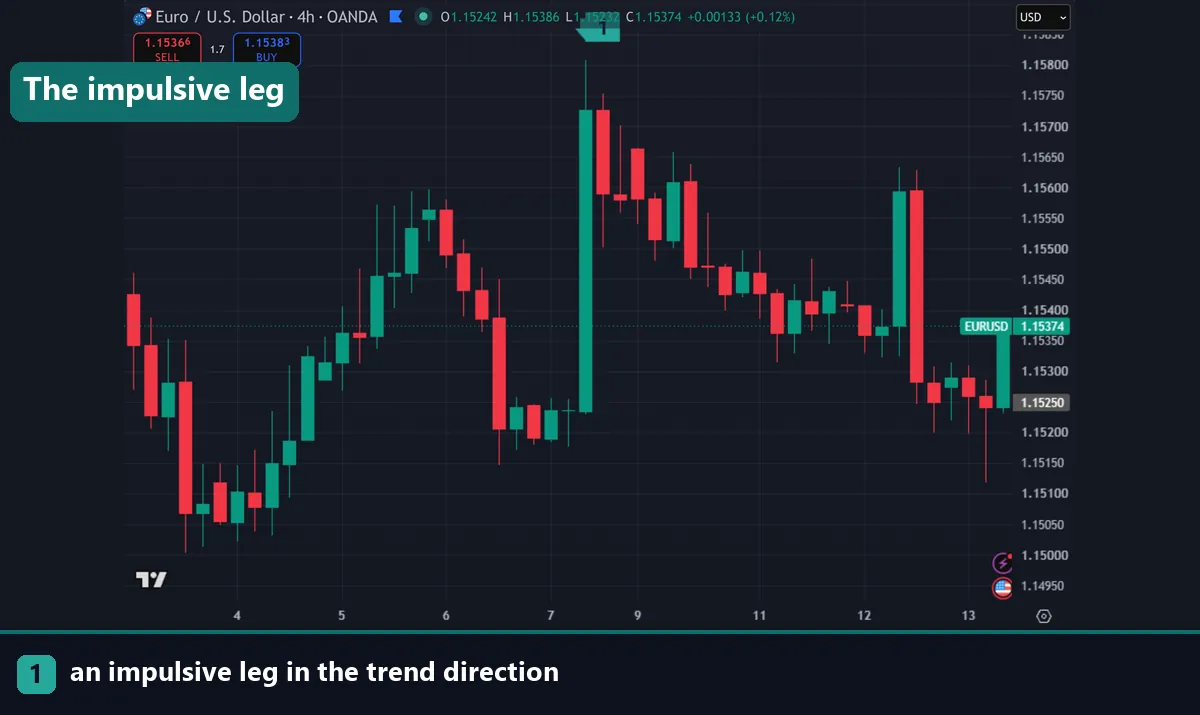
Elliott’s observation was that markets move in a repeating pattern of five waves with the trend, then three against it. The five-wave sequence is called an impulse, and the three-wave sequence is a correction.
Within the impulse, waves 1, 3 and 5 travel in the trend direction. Waves 2 and 4 are the pullbacks between them. The correction that follows is labelled A, B and C, where A and C move against the previous trend and B is the bounce in between.
The pattern is fractal. Each wave of an impulse breaks down into a smaller five-three sequence on a lower timeframe, and the whole eight-wave cycle forms one wave of a larger degree. That is what makes the theory powerful and also what makes it easy to abuse, since almost any squiggle can be labelled at some degree.
The three rules
Elliott wave has exactly three rules. Everything else is a guideline. If a count breaks one of these, the count is wrong and must be redrawn.
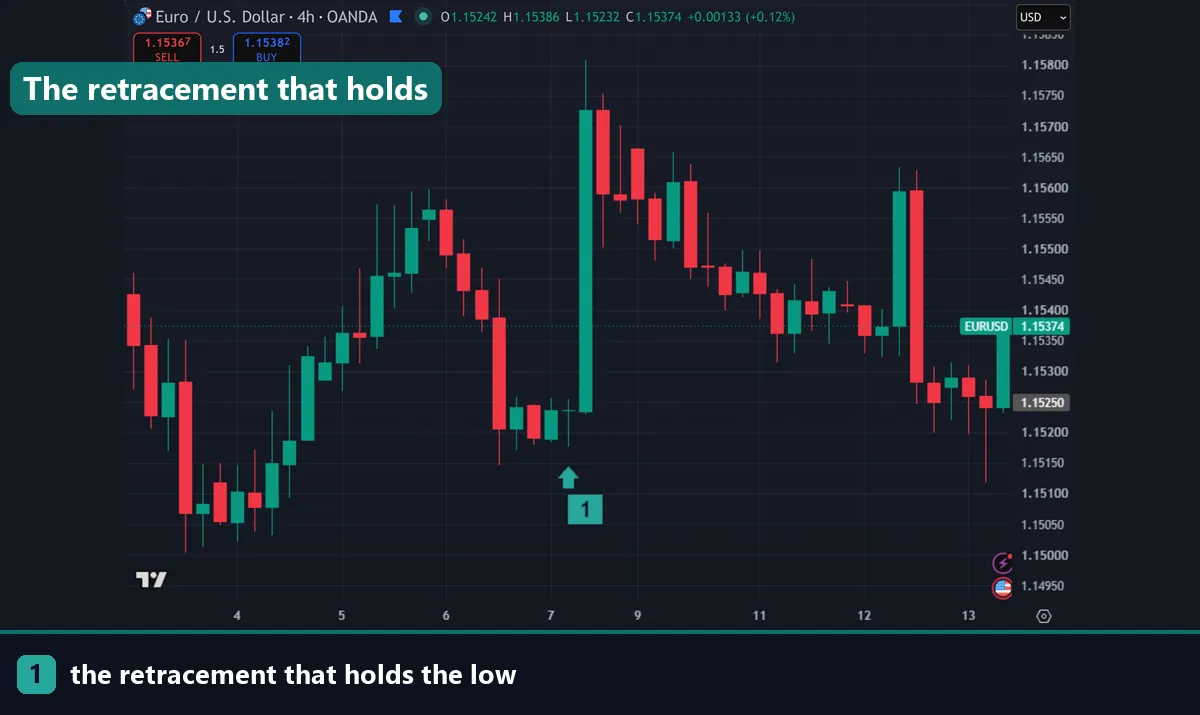
Wave 2 never retraces more than 100% of wave 1. If price trades back through the start of wave 1, what you labelled as wave 1 was not the start of an impulse.
Wave 3 is never the shortest of waves 1, 3 and 5. It does not have to be the longest, though it usually is. It simply cannot be the shortest of the three.
Wave 4 never enters the price territory of wave 1. In a five-wave advance, the low of wave 4 stays above the high of wave 1.
These rules are the discipline of the method. They give you a specific price that invalidates the count, which is exactly what a stop loss needs.
The guidelines worth knowing
Guidelines are tendencies rather than laws, and they help you choose between competing counts.
| Wave | Typical behaviour | Common Fibonacci relationship |
|---|---|---|
| Wave 2 | Deep, often frightening retracement | 50% to 61.8% of wave 1 |
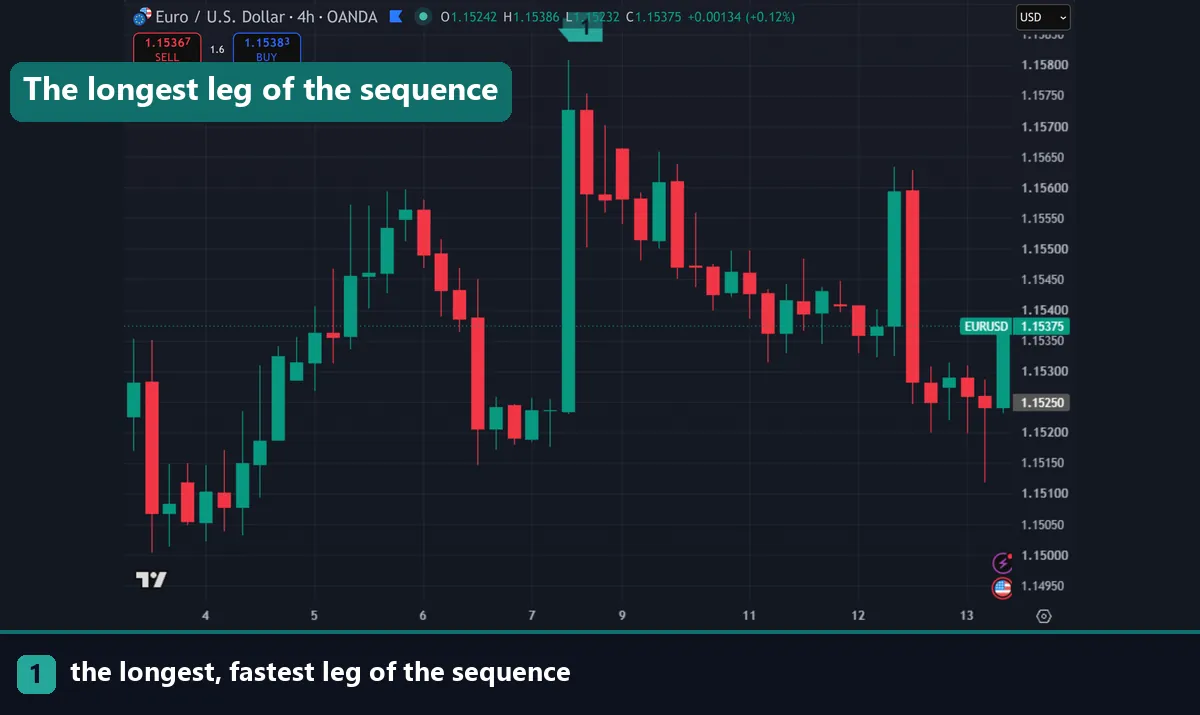
| Wave 3 | Longest and fastest, strong momentum | 161.8% of wave 1, sometimes more |
| Wave 4 | Shallow and sideways, often complex | 38.2% of wave 3 |
| Wave 5 | Weaker momentum, divergence common | Equal to wave 1, or 61.8% of waves 1 to 3 |
| Wave B | Partial bounce that traps trend followers | 50% to 78.6% of wave A |
| Wave C | Decisive, five waves of its own | Equal to wave A, or 161.8% of it |
Alternation is another useful guideline. If wave 2 was a sharp, deep pullback, wave 4 is usually a shallow sideways affair, and vice versa. When the two look identical, question the count.
Momentum divergence at wave 5 is the most practical guideline of all. A fifth wave that makes a new high while the oscillator makes a lower high is the classic warning, and our bullish divergence guide covers reading it properly.
Elliott wave EURUSD analysis in practice
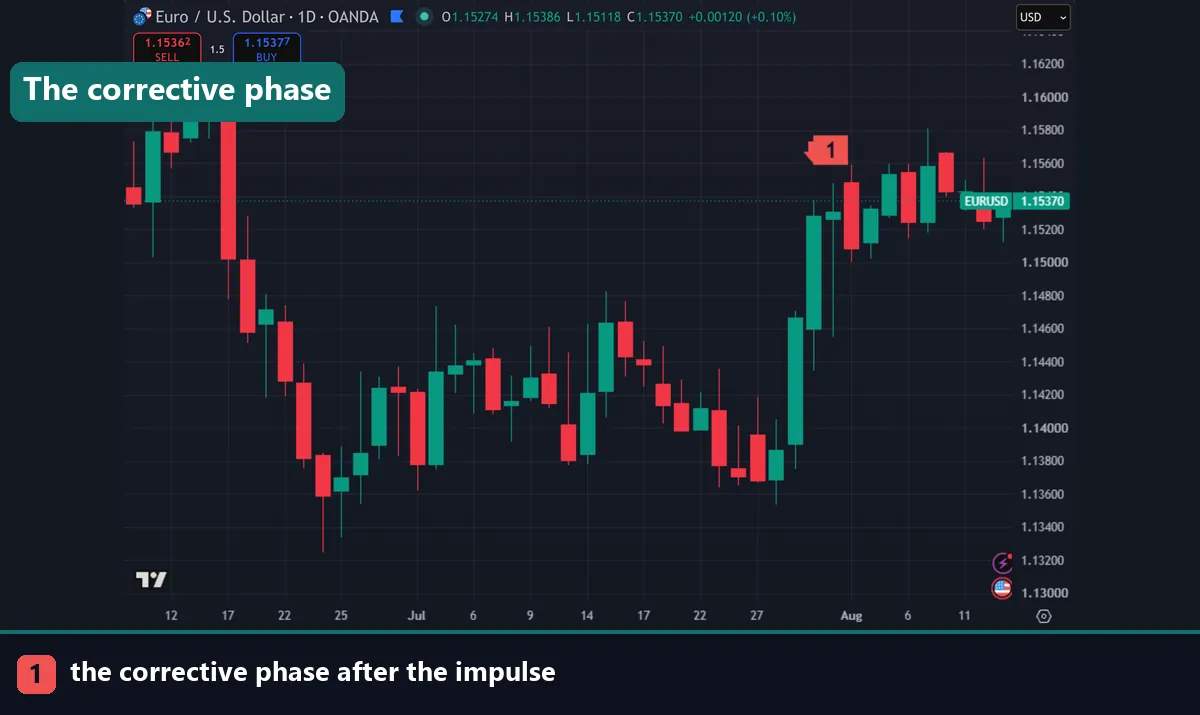
Start on the daily or H4 chart rather than a fast one. EURUSD produces plenty of intraday noise that will not label cleanly, and beginning on a higher timeframe gives you a frame the lower timeframes must fit inside.
Find an obvious, uninterrupted move first. A clean directional run of several weeks is far easier to label than a choppy range, and you need one anchor you are confident about before anything else means much. Mark its start and end.
Then ask whether that move subdivides into five. Drop one timeframe and look. If it clearly breaks into five legs, you have an impulse and the direction of the larger trend. If it breaks into three, you are looking at a correction inside a bigger move going the other way.
Label conservatively. Use the rules as a checklist on every count you draw, and write down the exact price that would invalidate it. If you cannot state that price, you do not have a count; you have a drawing.
Download the complete indicator database
Put these concepts on your charts. One email unlocks the full library of 1,380+ indicators with compiled MT4 and MT5 files, plus my TradingView scripts. No paywall, no spam, unsubscribe any time.
Get free access to my indicator database
One email unlocks 1,380+ free MT4, MT5 and TradingView indicators — the complete library. No single-tool download; you get the whole database.
Trading a wave count
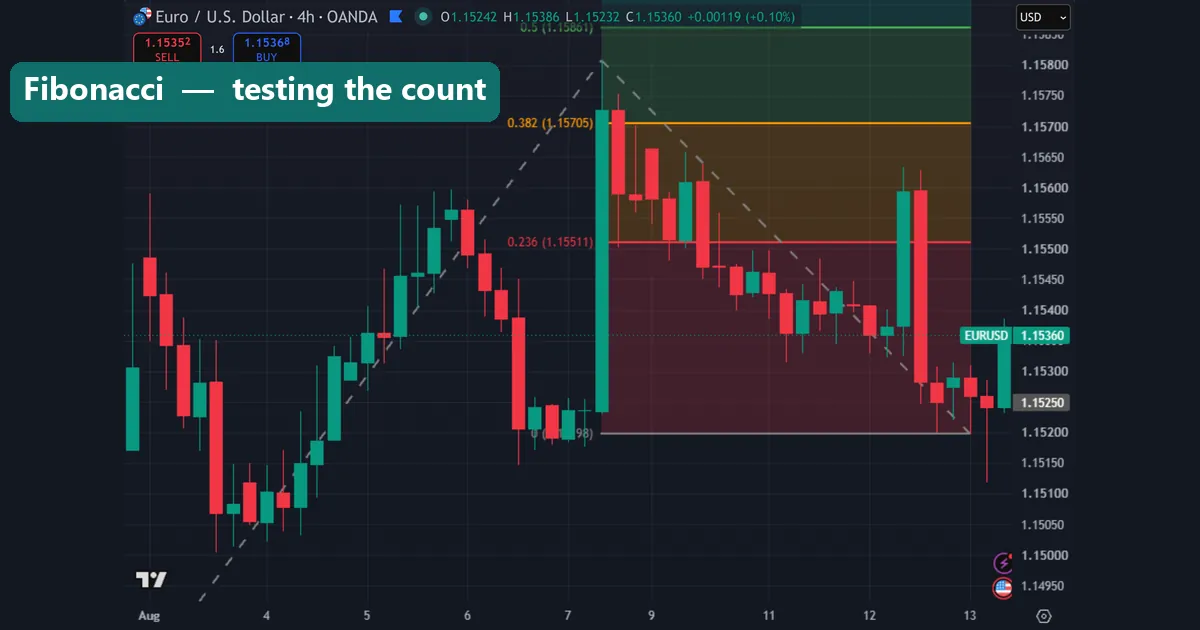
Most traders using Elliott wave do not trade every wave. Two entries carry the best reward relative to their risk.
The first is the start of wave 3. Once wave 1 is complete and wave 2 has retraced into the 50% to 61.8% zone, an entry there targets the strongest leg of the sequence. The invalidation is precise, since a move below the start of wave 1 breaks rule one. Combine the retracement zone with a Fibonacci extension to set targets.
The second is the wave 4 pullback into wave 5. Lower reward, because fifth waves are usually weaker, yet the invalidation is again exact: wave 4 must not enter wave 1 territory.
What most experienced practitioners avoid is trying to pick the top of wave 5 to catch the correction. Fifth waves extend more often than people expect, and counter-trend entries against a trending market have the worst odds in the whole sequence.
The honest limitations
Elliott wave is subjective, and pretending otherwise is the main reason people lose money with it. Two competent analysts routinely produce different counts on the same EURUSD chart, and both can be defensible under the rules.
Counts also change. A structure that looked like a completed five often gets relabelled as the first three waves of a larger move once new highs appear. That is legitimate under the theory, yet it means a count is a working hypothesis rather than a forecast.
The fractal nature makes over-fitting easy. Given enough degrees, almost any price path can be labelled somehow. The defence is to require the three rules on every count, insist on a clear invalidation price, and treat any count you cannot state simply as a count you do not have.
Common Elliott wave mistakes
Four repeat constantly. Forcing a count onto a sideways market tops the list, since corrections are complex and often unlabelled until they finish. Ignoring rule three comes second, and a wave 4 overlapping wave 1 invalidates far more counts than beginners realise. Third, traders count on M5 without a higher timeframe frame. Fourth, they short a suspected wave 5 top with no confirmation, which is the lowest-probability trade in the sequence.
Where to go next
Wave counting pairs well with the tools that measure the legs. Read how to draw a Fibonacci extension for targets, and harmonic pattern trading for a related ratio-based method. Our forex swing trading strategies suit the holding periods a wave count implies, and forex pair volatility shows how far EURUSD typically travels. For further reading, Investopedia explains Elliott wave theory at Investopedia, and the Elliott wave principle article on Wikipedia covers its history.
FAQ
What is Elliott wave EURUSD analysis?
It is the practice of labelling EURUSD price swings into Elliott’s five-wave impulse and three-wave correction. The labels give you a structural map plus a specific price that would prove the reading wrong.
What are the three Elliott wave rules?
Wave 2 never retraces beyond the start of wave 1. Wave 3 is never the shortest of waves 1, 3 and 5. Wave 4 never trades into the price territory of wave 1. Any count breaking one of these is wrong.
Which timeframe should I count EURUSD on?
Begin on the daily or H4 chart to establish the larger structure, then drop down to confirm that a leg subdivides correctly. Counting on M5 without a higher timeframe frame produces labels that change hourly.
Where is the best entry in a wave sequence?
The start of wave 3, taken after wave 2 retraces into the 50% to 61.8% zone. It targets the strongest leg and carries an exact invalidation at the origin of wave 1.
Why do two analysts get different counts?
Because the pattern is fractal and corrections take many forms, so several labellings can satisfy the rules at once. Treat a count as a hypothesis with an invalidation price rather than a prediction.
Can Elliott wave predict where EURUSD goes next?
It frames scenarios and tells you what would disprove them, which is useful. It does not forecast. Trading involves risk, results are not guaranteed, and past performance is not indicative of future results.

About the author
Written by Dominic Walsh, a Forex trader and MT4/MT5 indicator, Expert Advisor and script developer. Every tool on forexmt4systems.com is tested on live charts before release and ships with ready-to-use compiled MT4 (.ex4) and MT5 (.ex5) files. Learn more about the trader and developer behind this site.
How we build, test and correct every tool: Editorial & Testing Policy. Trading carries risk; see the disclaimer.