
To draw a Fibonacci extension, you plot three points in order: the swing low, the swing high, then the retracement pullback. The tool projects profit targets beyond that move, at ratios like 1.272, 1.618 and 2.618. So a Fibonacci extension shows where a trend might run next, not just where it might pause. This guide walks through how to draw a Fibonacci extension on MT4, MT5 and TradingView, with the exact anchor order, the levels that matter, and the mistakes that ruin most attempts.
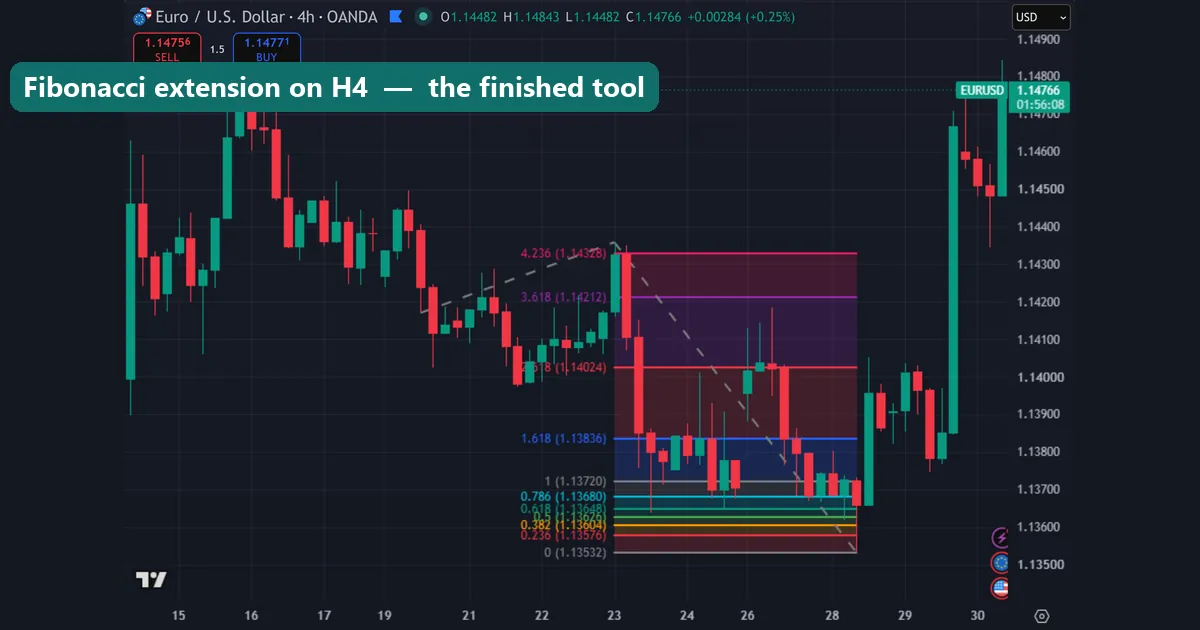
Fibonacci extension vs Fibonacci retracement
These two tools sound alike, yet they answer different questions. A Fibonacci retracement measures a pullback inside a completed move. It marks where price might pause or bounce, at 38.2%, 50% and 61.8%. An extension does the opposite. It projects where price could travel once that pullback ends. Put simply, a retracement finds support and resistance inside the swing, while an extension sets targets outside it. Both rely on the same Fibonacci ratios. Even so, you use them at different moments in a trade, so keep the two clearly separated in your plan.
The three anchor points explained
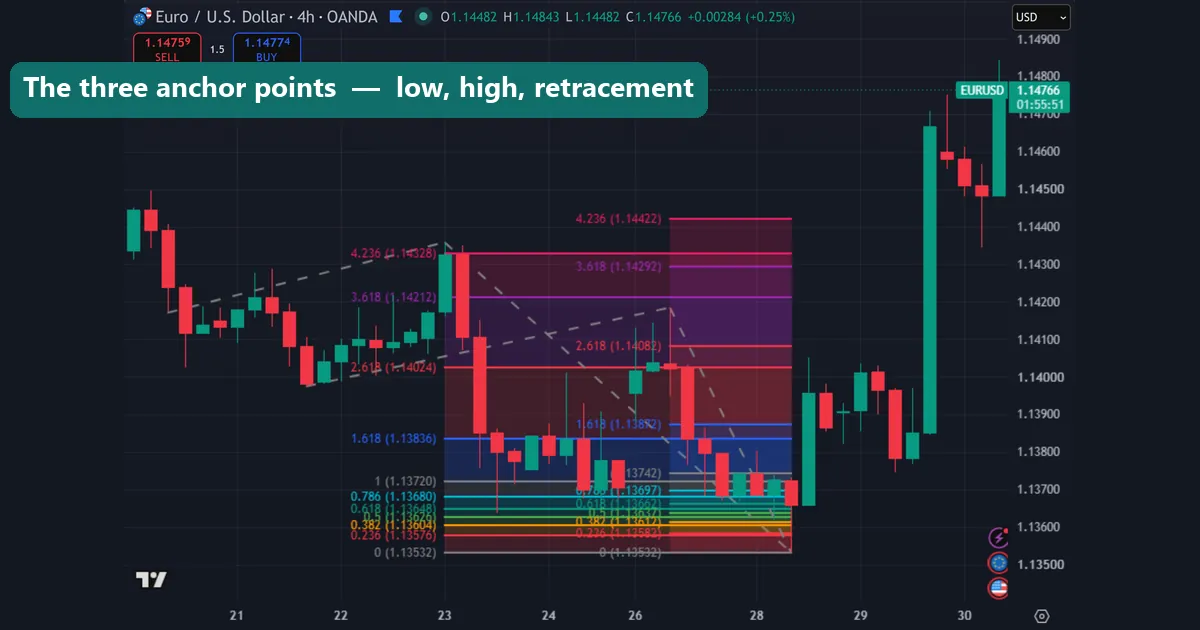
A Fibonacci extension needs three clicks, not two. In an uptrend, the order runs low to high to pullback. Point A is the swing low where the move began. From there, point B marks the swing high where the impulse stalled. Point C is the retracement low where the pullback finished. The tool then measures the A-to-B leg and projects it upward from C. That projection is where your targets appear. Get this order right and the levels line up cleanly above price. Reverse it, and the numbers land in the wrong place, which is the most common error we see.
Fibonacci extension levels: the key numbers
Every extension level comes straight from the Fibonacci sequence and its ratios. You will use three the most: 1.272, 1.618 and 2.618. The 1.272 level is the square root of 1.618, so it often marks the first realistic target. Next comes 1.618, the golden ratio itself, which acts as the main objective in a healthy trend. Beyond that sits 2.618, or 1.618 squared, reserved for strong and extended runs. Two more levels round out the set: 1.414, the square root of two, and a flat 2.0. The table below shows each level and what traders use it for.
| Level | Where it comes from | What it is used for |
|---|---|---|
| 1.272 | Square root of 1.618 | First take-profit target |
| 1.414 | Square root of 2 | Minor target in choppy trends |
| 1.618 | The golden ratio | Main profit target |
| 2.0 | Full projection of the leg | Measured-move objective |
| 2.618 | 1.618 squared | Target in strong, extended trends |
Treat these ratios as planning zones, not exact prices. Backtest them on the pair and timeframe you actually trade before you lean on them.
How to draw a Fibonacci extension in an uptrend
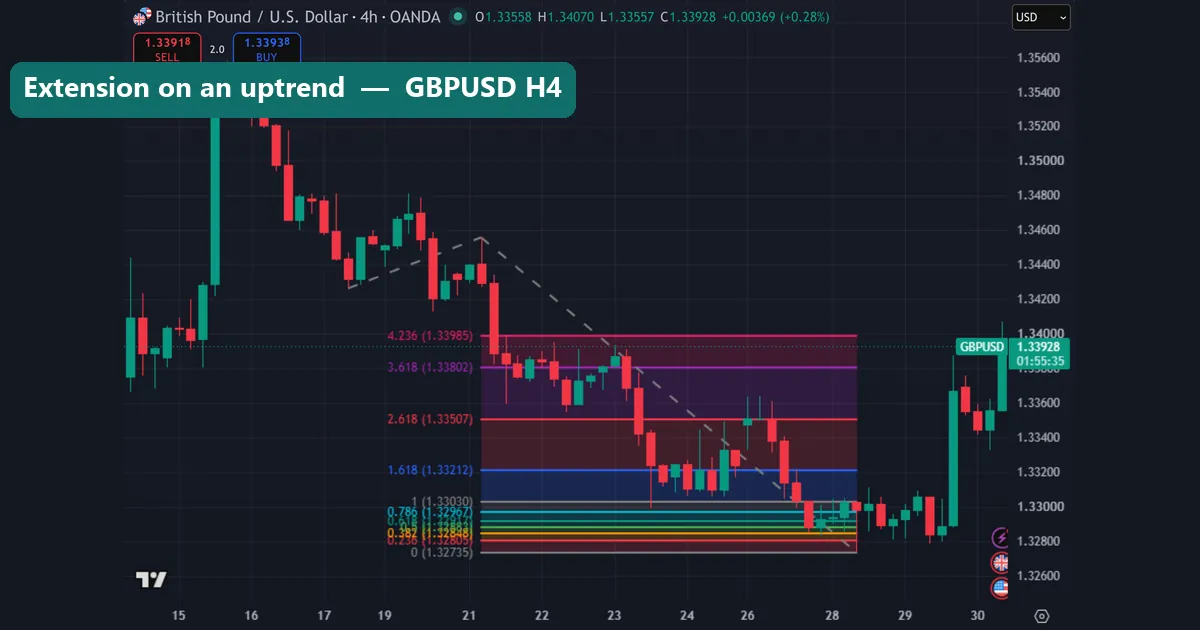
Start with a clear uptrend that has already pulled back. First, click the swing low that launched the move. Next, drag to the swing high where the rally stalled. Finally, click the retracement low where the pullback held. The tool now plots the extension levels above the current price. Those levels become your upside targets. Price often reaches 1.272 first, pauses, then pushes toward 1.618 if the trend stays strong. Wait for a candle to close through a level before you treat it as broken. A wick alone is not confirmation.
How to draw a Fibonacci extension in a downtrend
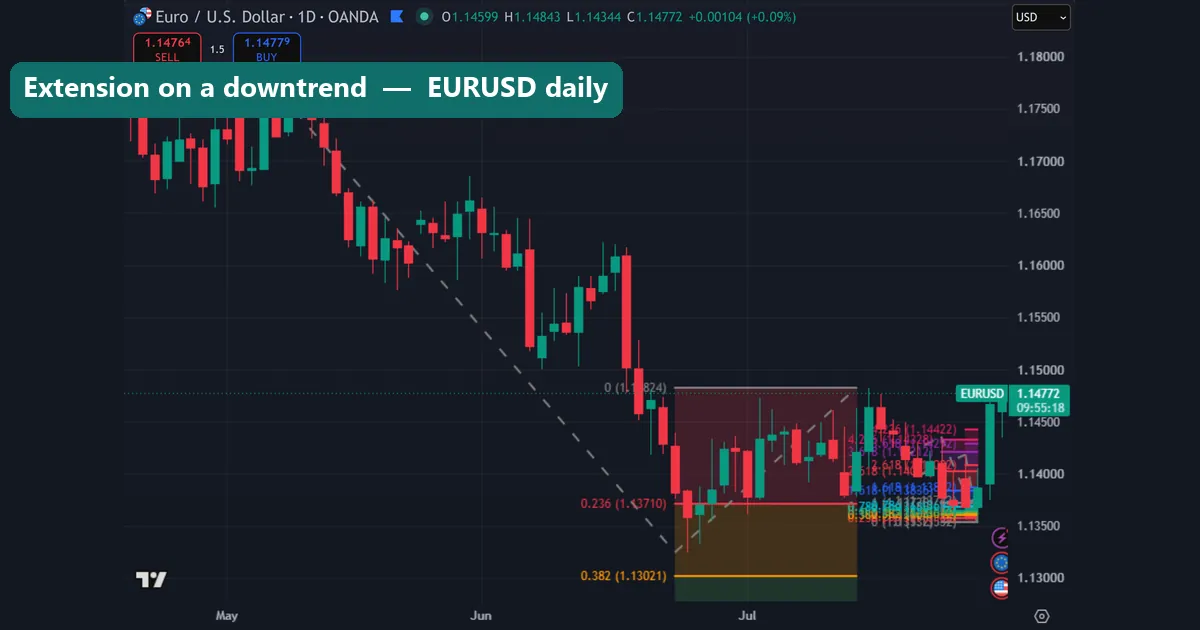
A downtrend simply flips the order. Click the swing high first, then drag to the swing low, and finish at the retracement high where the bounce faded. The tool projects the levels below price this time. Those become your downside targets. The logic mirrors the uptrend exactly: 1.272 is the first stop, 1.618 is the main objective, and 2.618 waits for a powerful move. Keep your anchors on the same swing structure you traded, not on random highs and lows. Sloppy anchors produce targets that mean nothing, so slow down and pick clean turning points.
Extension levels as take-profit targets: 1.272, 1.618, 2.618
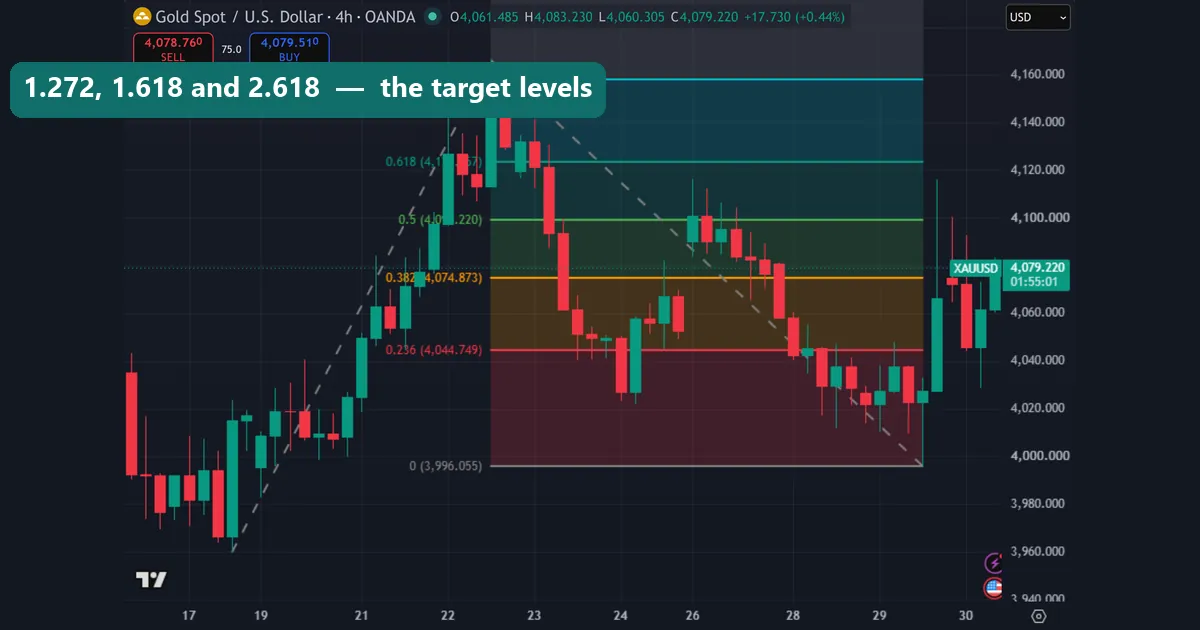
Extensions shine as a take-profit map. Most traders scale out across the levels rather than betting on one. Book part of the position at 1.272, since that target hits most often. Move your stop to breakeven there to protect the trade. Then hold the rest toward 1.618, the main objective in a trending market. Reserve 2.618 for the rare, strong runs that keep their momentum. This approach locks in gains early and still leaves room for a bigger move. Pair each level with structure, such as a prior high or a round number, and your targets get stronger.
How to draw a Fibonacci extension on MT4 and MT5
On MetaTrader, the tool sits under Insert → Fibonacci → Expansion. Select it, then make the same three clicks: swing low, swing high, retracement point. MT4 labels the default levels 61.8, 100.0 and 161.8, which map to the 1.618 and 2.618 projections. Open the tool’s properties and add 127.2 and 261.8 in the Fibo Levels tab so the full set shows. MT5 works the same way through the Insert menu. Set the description text to display each ratio, and the levels stay readable on the chart. The full setup walkthrough lives in our guide on how to install MT4 and MT5 indicators.
How to draw a Fibonacci extension on TradingView
TradingView calls the tool the Trend-Based Fib Extension. Open the drawing toolbar on the left, pick it from the Fibonacci group, and click your three points in order. Point one is the start of the move, point two is the end of the impulse, and point three is the retracement. The extension levels appear instantly, and you can drag any anchor to refine them. Open the tool’s settings to toggle levels on or off, so only 1.272, 1.618 and 2.618 show if you prefer a clean chart. TradingView then remembers your choices for the next drawing.
Download the complete indicator database
Put these concepts on your charts. One email unlocks the full library of 1,380+ indicators with compiled MT4 and MT5 files, plus my TradingView scripts. No paywall, no spam, unsubscribe any time.
Get free access to my indicator database
One email unlocks 1,380+ free MT4, MT5 and TradingView indicators — the complete library. No single-tool download; you get the whole database.
Common Fibonacci extension mistakes
Three mistakes trip up most traders. First, the wrong anchor order: clicking high before low in an uptrend flips the whole projection, so the targets land in the wrong zone. Always follow the move’s direction. Second, drawing extensions in a range. These levels only make sense when a trend is running; in a sideways market the projections are noise. Third, treating a level as a certainty. Price can stall short of 1.272 or blow past 2.618, so use the levels as planning zones, not fixed exits. Confirm each target with structure and a candle close, and the tool earns its place in your process.
Where to go next
Fibonacci works best alongside other tools. Browse our full library of Fibonacci indicators for MT4, MT5 and TradingView, and see the roundup of the best forex indicators to pair with your levels. More step-by-step tutorials sit in our how-to guides hub. For the theory, Investopedia explains how Fibonacci extensions work, and Wikipedia covers the related Fibonacci retracement the extension builds on.
FAQ
What is the difference between a Fibonacci extension and a retracement?
A retracement measures a pullback inside a completed move and marks likely support or resistance. An extension projects targets beyond the move, once the pullback ends. In short, one finds levels inside the swing, the other sets goals outside it.
What are the most important Fibonacci extension levels?
The 1.272, 1.618 and 2.618 levels do most of the work. The 1.272 level is the usual first target, 1.618 is the main objective, and 2.618 suits strong, extended trends. Add 1.414 and 2.0 if you want extra reference points.
How do I draw a Fibonacci extension on MT4?
Open Insert → Fibonacci → Expansion, then click three points in order: the swing low, the swing high and the retracement. MT4 shows 61.8, 100 and 161.8 by default, so add 127.2 and 261.8 in the properties to see the full set.
Can I use Fibonacci extensions on any timeframe?
Yes. The levels work on M5, H1, daily and beyond, because the ratios stay the same at every scale. Higher timeframes tend to give cleaner swings, so the anchors are easier to place accurately.
Where should I take profit with a Fibonacci extension?
Many traders scale out. Book part of the position at 1.272, move the stop to breakeven, then hold toward 1.618. Reserve 2.618 for strong momentum. Always confirm a target with structure, such as a prior high or a round number.
Are Fibonacci extensions guaranteed to work?
No. Extensions are a planning tool, not a forecast. Price can stop short of a level or run straight through it. Trading involves risk, results are not guaranteed, and past performance is not indicative of future results.

About the author
Written by Dominic Walsh, a Forex trader and MT4/MT5 indicator, Expert Advisor and script developer. Every tool on forexmt4systems.com is tested on live charts before release and ships with ready-to-use compiled MT4 (.ex4) and MT5 (.ex5) files. Learn more about the trader and developer behind this site.
How we build, test and correct every tool: Editorial & Testing Policy. Trading carries risk; see the disclaimer.