
Forex pair volatility is simply how far a pair tends to travel in a given period, usually measured in pips or by ATR. Some pairs drift. Others swing hard. That difference should shape your stop distance, your position size and even the timeframe you trade. This guide explains what volatility means in practice, which pair groups typically move most, how to measure it yourself with ATR on your own broker feed, and why a busier pair does not mean an easier one.
What volatility means for a currency pair
Volatility describes the size of a pair’s typical movement, not its direction. A volatile pair covers a lot of ground within the day. A calm pair covers less. Neither state tells you which way price will go.
Traders usually express it two ways. The first is range: the distance from high to low over a bar or a session, counted in pips. The second is ATR, or Average True Range, which averages that distance over a set number of bars and includes gaps. ATR is the more useful of the two, because it smooths one-off spikes.
Volatility also changes with regime. A pair that barely moved during a quiet summer can double its daily range once a central bank turns hawkish. So treat any figure you read, here or anywhere else, as a snapshot rather than a constant.
One more distinction helps. Realised volatility is what already happened, and ATR measures exactly that. Implied volatility comes from options pricing and reflects what the market expects next. Retail forex traders work almost entirely with the realised kind, since it is visible on any chart and needs no extra data feed.
Which pairs move most, and which stay calm
Relative behaviour is far more reliable than fixed numbers, so think in tiers.
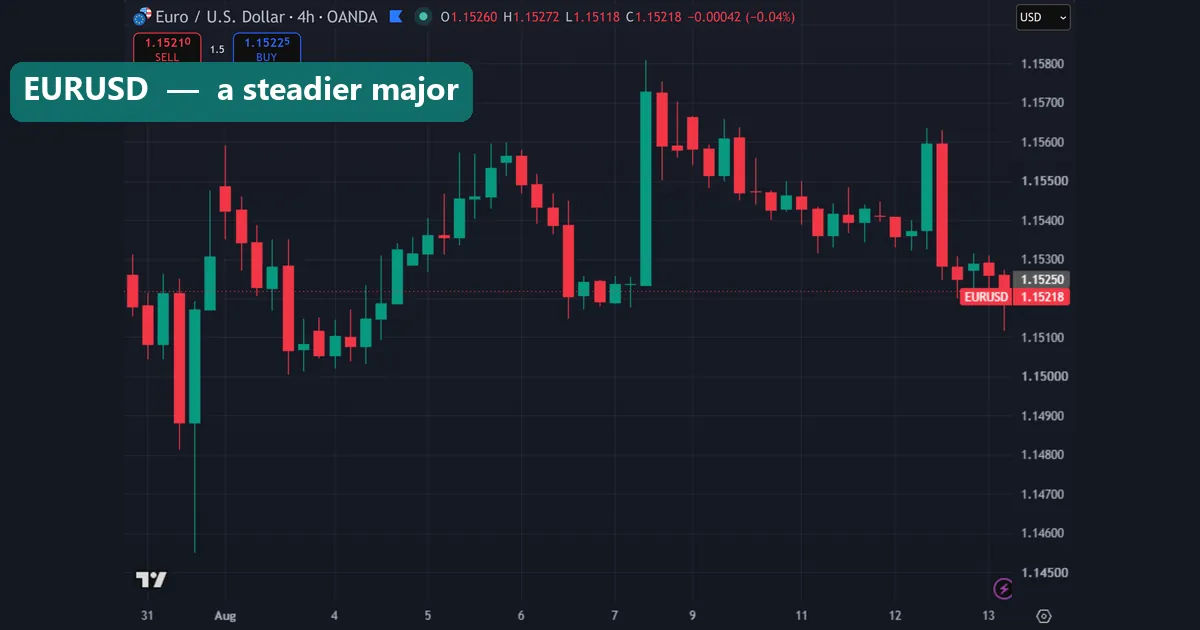
The majors are generally the steadiest group. EURUSD in particular tends to grind rather than lurch, which is one reason it suits beginners. USDCHF and EURGBP often sit calmer still, since the underlying economies move closely together.
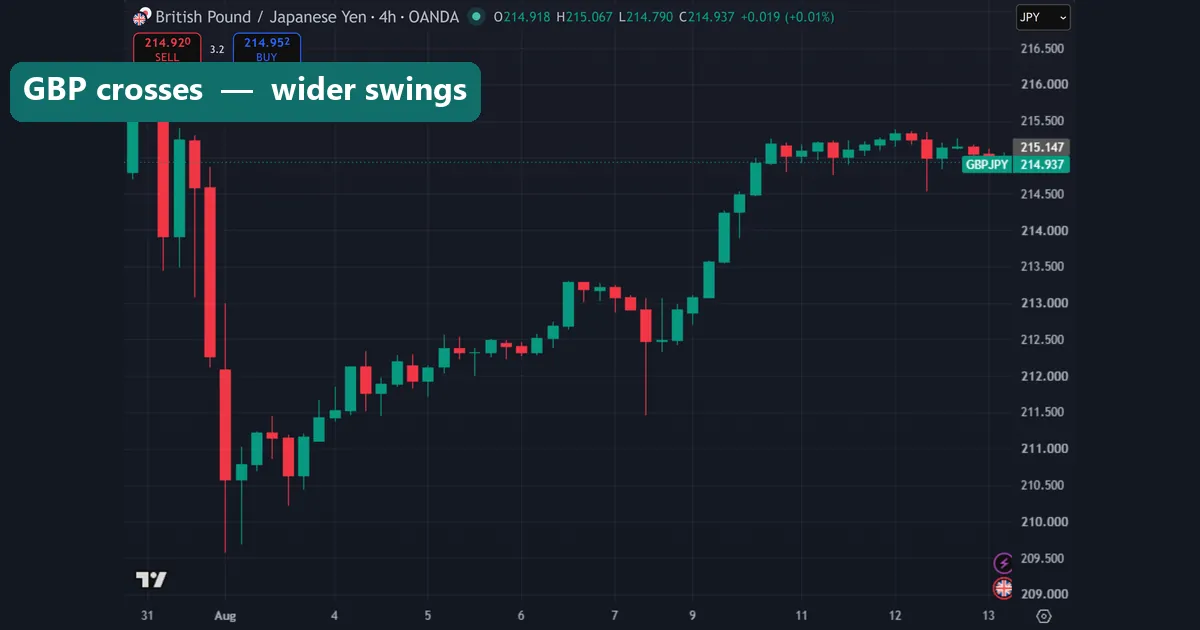
GBP crosses sit at the busier end. GBPJPY has a long-standing reputation for wide swings, and GBPNZD or GBPAUD frequently travel further again. Yen crosses generally amplify whatever risk sentiment is doing.
Exotics move furthest relative to their normal state, though much of that movement arrives in gaps and jumps rather than tradeable trends. Gold deserves its own mention: XAUUSD routinely travels far more than any major pair, and traders who carry major-pair habits onto gold usually oversize badly.
Measure all of this yourself before you act on it. Ranges differ between brokers, quoting conventions and eras, so your own feed is the only honest source.
How to measure forex pair volatility with ATR
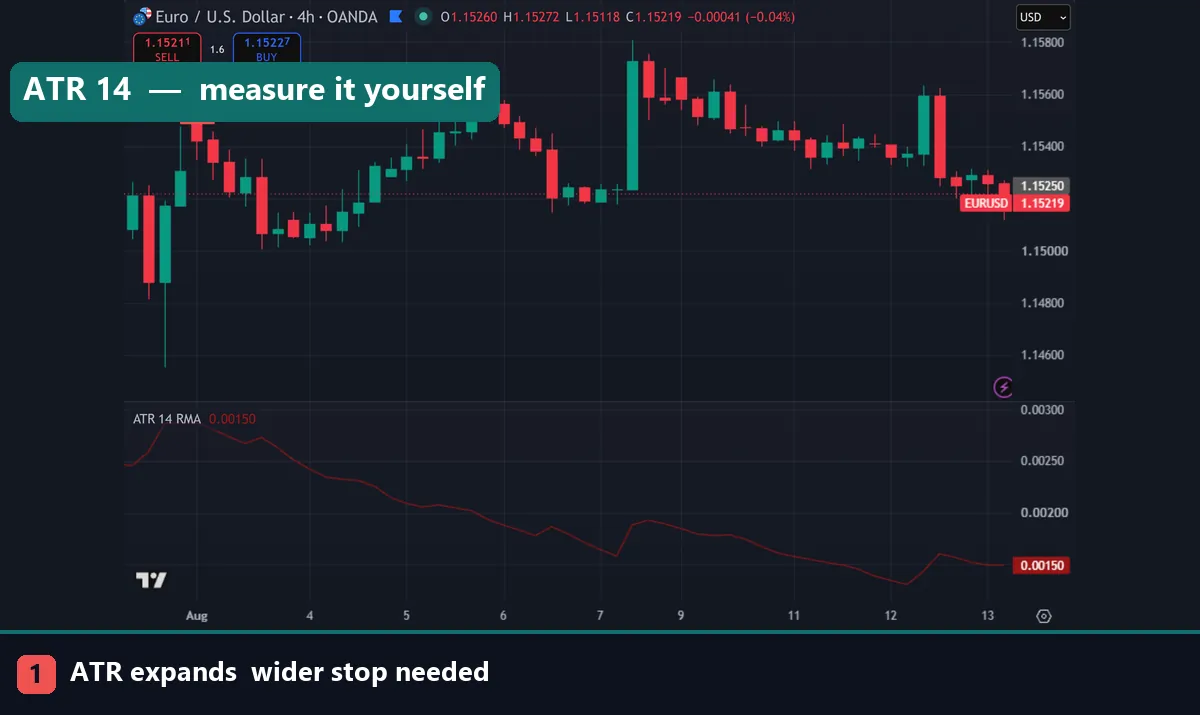
ATR turns a vague impression into a number you can use. Add it from Insert → Indicators → Oscillators → Average True Range in MetaTrader, or from the indicator search on TradingView.
Start with a 14-period ATR on the daily chart. The value it prints is the average true range of the last fourteen days, expressed in the pair’s price units. Divide by the pip size to read it in pips. Do this for every pair on your watchlist and write the values down.
Then repeat on the timeframe you actually trade. An ATR on H1 tells you what a normal hour looks like, which is the number your intraday stops should respect. Re-check monthly, because these values drift. Our guide on using ATR as a stop loss covers the multipliers in detail, and a pip value calculator converts the result into money on your account.
How volatility changes by session
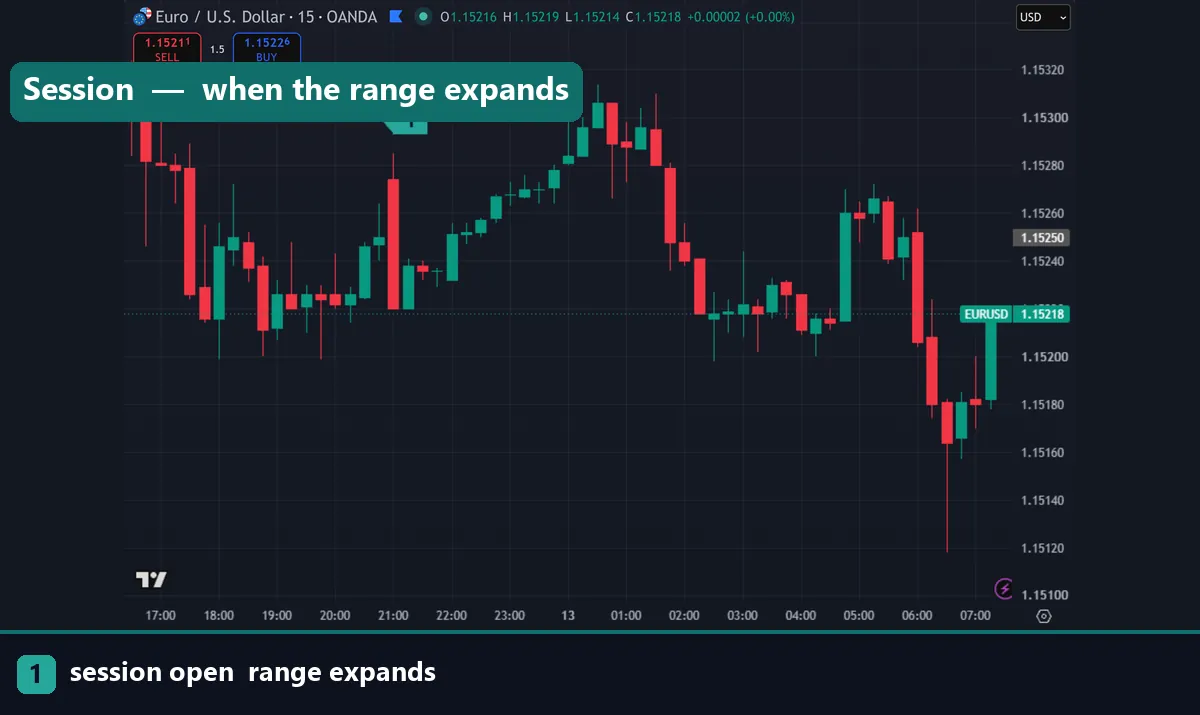
Time of day matters as much as the pair. The Asian session is usually quiet for European crosses, so ranges compress and breakouts fail more often. London arrives and volatility jumps. The London–New York overlap is normally the busiest window of the day.
Different pairs peak at different hours. AUD and NZD pairs wake up during the Asian session. GBP and EUR pairs need London. USD pairs respond to US data releases in the New York morning.
Scheduled events distort everything briefly. Central bank decisions and inflation prints can produce an hour that dwarfs a normal day. Check the session map in our guide to forex market opening hours, then align your trading window with the pairs you follow.
Why volatility must set your stop and your size
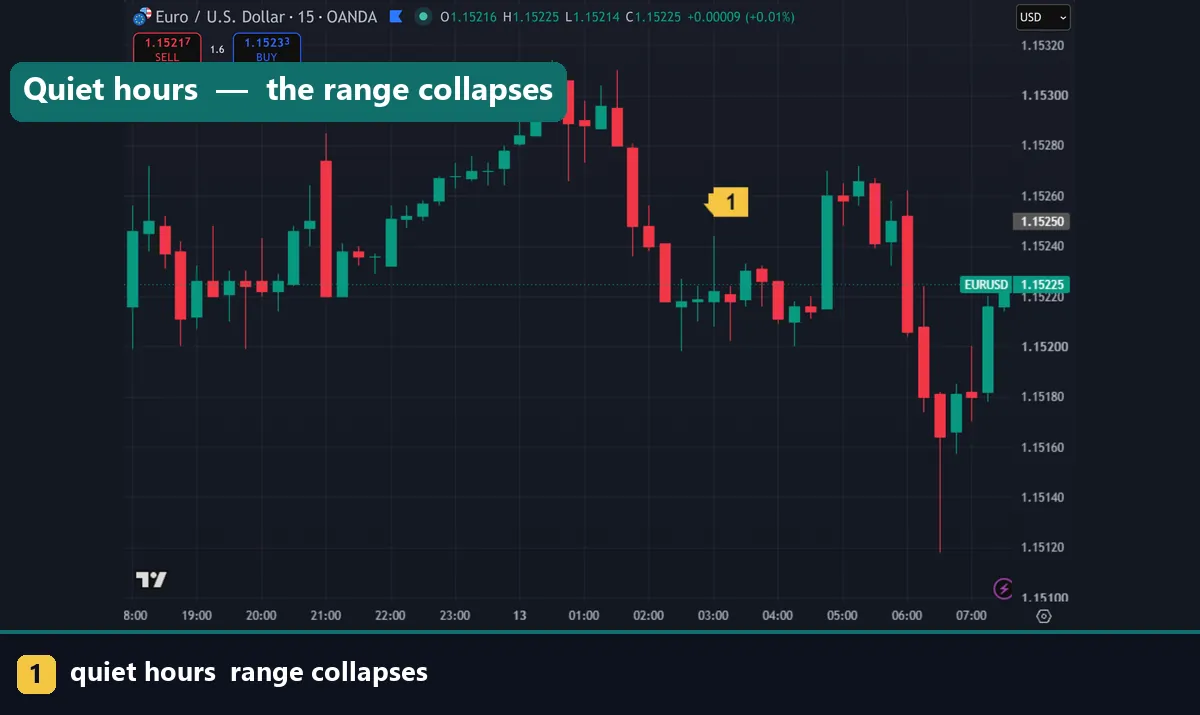
Most beginners pick a stop distance first, then wonder why it keeps getting hit. Reverse the order. Volatility decides how much room the trade needs; your position size then adjusts to keep the risk constant.
The sequence is straightforward. Measure ATR on your timeframe. Place the stop beyond normal noise, commonly one to two ATR from entry, and behind a structural level where possible. Convert that pip distance into a position size that risks your fixed percentage. A forex position size calculator does the arithmetic in seconds.
Notice what falls out of this. A more volatile pair needs a wider stop, so it gets a smaller position for identical risk. Volatility does not increase your profit potential by itself. It increases the distance price travels in both directions, and your size shrinks to match.
Target distance follows the same logic. If a normal day on your pair covers roughly one ATR, then a target three ATR away inside a single session is asking for something unusual. Scale your expectations to the range the pair actually delivers. That single habit removes a lot of frustration, and it costs nothing to apply.
Pair groups at a glance
| Group | Examples | Relative volatility | Typical use | What to watch |
|---|---|---|---|---|
| Steady majors | EURUSD, USDCHF, EURGBP | Lowest | Learning, scalping, tight structured stops | Ranges can compress until a data release breaks them |
| Active majors | GBPUSD, USDJPY, AUDUSD | Moderate | Intraday and swing trading | Session timing changes behaviour sharply |
| GBP and JPY crosses | GBPJPY, GBPNZD, EURJPY | High | Swing trading with wider stops | Fast reversals; stops need real room |
| Exotics | USDTRY, USDZAR, USDMXN | Very high | Occasional macro positions | Wide spreads, gaps and swap costs |
| Gold | XAUUSD | Far above the majors | Momentum and breakout trading | Size down hard; ATR dwarfs major-pair habits |
Use this table for ranking, never for exact numbers. Run ATR on your own charts to get the values that apply to your broker and to the current market regime.
Download the complete indicator database
Put these concepts on your charts. One email unlocks the full library of 1,380+ indicators with compiled MT4 and MT5 files, plus my TradingView scripts. No paywall, no spam, unsubscribe any time.
Get free access to my indicator database
One email unlocks 1,380+ free MT4, MT5 and TradingView indicators — the complete library. No single-tool download; you get the whole database.
Common volatility mistakes
Several errors show up again and again. Traders apply one fixed stop across every pair, so it is too tight on GBPJPY and too loose on EURGBP. Some chase the busiest pair after a big week, arriving exactly as the move ends. Others keep full size on gold because the lot maths looks familiar. And plenty ignore session timing, then trade a European cross at three in the morning and blame the strategy.
One further trap deserves attention. Rising ATR after a long calm stretch often marks the start of a new regime, not a temporary blip. Update your stop distances when that happens, rather than defending numbers that suited last month.
Where to go next
Volatility work pays off fastest when your risk tools are already set up. Continue with our guides on ATR stop placement and position sizing, then load your charts using the walkthrough on how to install MT4 and MT5 indicators. For definitions and theory, Investopedia explains volatility at Investopedia, and Wikipedia covers volatility in finance on Wikipedia.
FAQ
What is forex pair volatility?
It is how far a pair typically travels over a period, measured in pips or by ATR. Volatility describes movement size, never direction, so a busy pair is not automatically a profitable one.
Which currency pairs are the most volatile?
GBP crosses such as GBPJPY and GBPNZD usually rank high, and exotics move further still. Gold travels far beyond any major. Confirm the current ranking with ATR on your own broker feed.
Which pairs are the calmest?
EURUSD, USDCHF and EURGBP tend to be the steadiest. Their economies and rate paths track each other closely, so daily ranges stay tighter than on the GBP and JPY crosses.
How do I measure volatility myself?
Add a 14-period ATR to the daily chart, read the value, and convert it into pips. Repeat on your trading timeframe and recheck monthly, since ranges shift with the market regime.
Should beginners trade volatile pairs?
Usually not. Wider swings demand wider stops and smaller positions, which makes mistakes more expensive. Learn on a steadier major, then move up once your risk process is consistent.
Does higher volatility guarantee bigger profits?
No. Bigger ranges mean wider stops and smaller positions, so your risk per trade stays the same. Trading involves risk, results are not guaranteed, and past performance is not indicative of future results.

About the author
Written by Dominic Walsh, a Forex trader and MT4/MT5 indicator, Expert Advisor and script developer. Every tool on forexmt4systems.com is tested on live charts before release and ships with ready-to-use compiled MT4 (.ex4) and MT5 (.ex5) files. Learn more about the trader and developer behind this site.
How we build, test and correct every tool: Editorial & Testing Policy. Trading carries risk; see the disclaimer.