
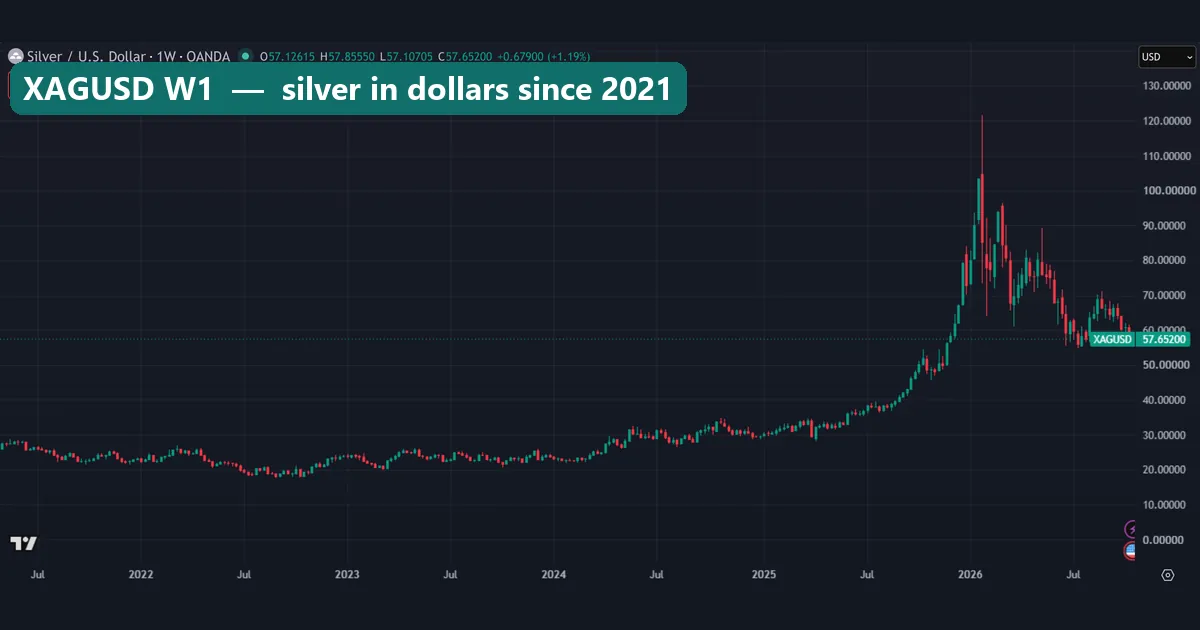
XAGUSD is the trading symbol for silver priced in US dollars. The number on the chart is the price of one troy ounce of silver, in dollars. This guide settles four questions. What does the symbol mean, and what is a move worth? How closely does silver follow gold, and how much harder does it swing? We measured the last two on TradingView data pulled on 19 October 2026. On that day silver closed near 57.75 dollars an ounce and gold near 4,175.
What XAGUSD means: silver priced in dollars
The symbol joins two codes. XAG is the code for one troy ounce of silver, and USD is the US dollar. The ISO 4217 code list on Wikipedia shows XAG beside the gold code XAU and the other metal codes. So XAGUSD reads like a currency pair, with the ounce as the base and the dollar as the quote.
The physical market has its own daily benchmark. The LBMA’s precious metal prices page publishes the LBMA Silver Price, set once each London business day in dollars per ounce. Your broker’s XAGUSD is a different thing. It is often a contract for difference that tracks the metal for most of each weekday. You hold a price contract, not metal.
Some brokers list silver against other currencies too. For example, our Capital Point MT4 terminal carries XAGEUR and XAGAUD next to XAGUSD.
How the XAGUSD price works
The quote is plain arithmetic. If XAGUSD reads 57.75, one ounce costs 57.75 dollars. When silver fell from 58.68 to 55.64 on 14 October 2026, each ounce lost 3.04 dollars. The result on a position follows one formula:
P&L in dollars = (exit price - entry price) x ounces per lot x lots
For a short trade, flip the sign. A move of one cent is worth one cent per ounce. So the value of a one-cent step depends only on how many ounces your contract holds. Brokers set that number, and it is not the same everywhere. Our guide to gold pip value walks through the same sum for XAUUSD.
The second formula is the gold/silver ratio:
gold/silver ratio = XAUUSD price / XAGUSD price
It tells you how many ounces of silver one ounce of gold buys. Both metals carry a dollar price, so the dollar drops out of the ratio. That makes it a cleaner gauge of silver against gold than either chart alone. A broad dollar move still shifts both prices at once. Our page on the dollar index in forex shows how that works.
How we tested silver against gold
All figures here come from OANDA price data on the TradingView web chart, pulled on 19 October 2026. We used two symbols, OANDA:XAGUSD and OANDA:XAUUSD.
First, we took 300 weekly closes, from the week of 25 January 2021 to October 2026. From these we built the weekly ratio and the weekly return correlation. Next, we took the last 300 daily bars for the daily correlation, the volatility ratio and the median daily range. Returns are log changes from close to close. The volatility ratio divides the standard deviation of silver’s returns by gold’s. The daily range is each bar’s high minus its low, divided by its close.
For the ratio chart we typed the spread symbol OANDA:XAUUSD/OANDA:XAGUSD into TradingView. TradingView’s help page on spread charts explains how dividing one symbol by another works. The hourly chart covers 7 to 19 October 2026.
These are price measurements, not trading results, so no spread, swap or commission enters them. We also checked which silver symbols our MetaTrader 4 terminal holds history for (Capital Point Trading, build 1471). Our editorial testing policy sets out how we collect and check data like this.
XAGUSD contract details to check in MT4
Before you size a trade, open the symbol’s specification. In MT4, right-click XAGUSD in Market Watch and choose Specification. These fields decide what a move is worth to you:
| Field | What it tells you | What we saw |
|---|---|---|
| Digits | Decimal places in the quote | OANDA’s feed shows five (57.65200) |
| Contract size | Ounces in one 1.00 lot | Set by each broker; read it |
| Tick size and value | Smallest step and its dollar value per lot | Step x contract size |
| Spread | Gap between bid and ask | 2.7 to 3.2 cents in our three captures |
| Swap | Overnight financing per lot | Set by each broker; changes often |
| Sessions | Hours when quotes stream | Listed in the same window |
One more trap: “pip” has no fixed meaning on silver. Some platforms call one cent a pip, and others a tenth of a cent. So count in cents or points instead. Our page on pips vs points explains the difference, and the pip value calculator does the sum.
Reading the XAGUSD daily chart
The daily chart shows the last year in detail. At its left edge, in September 2025, silver traded near 42 dollars. It then climbed with few pauses into late January 2026, when one daily wick reached just above 120.
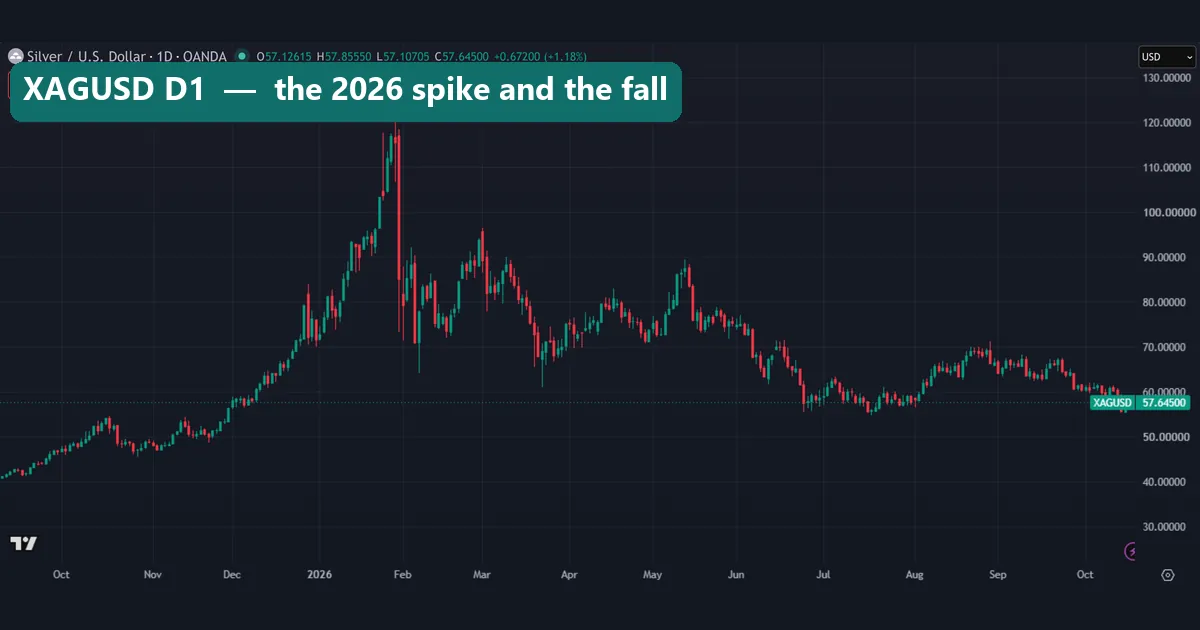
The turn came fast. A single red candle at the end of January fell from near 120 to the mid-80s. After that, each rally stalled lower: near 96 in early March and near 89 in mid-May. By late June the price was back in the 50s.
Since then silver has moved sideways, mostly between about 55 and 70 dollars. The chart closed at 57.645 on the capture. In short, a market that nearly tripled in about four months then lost more than half its peak price. Near the top, one candle could cover several normal days.
Reading the gold/silver ratio chart
This weekly chart is the ratio itself, built from the spread symbol. From late 2021 to 2024 it mostly swung between about 75 and 95.
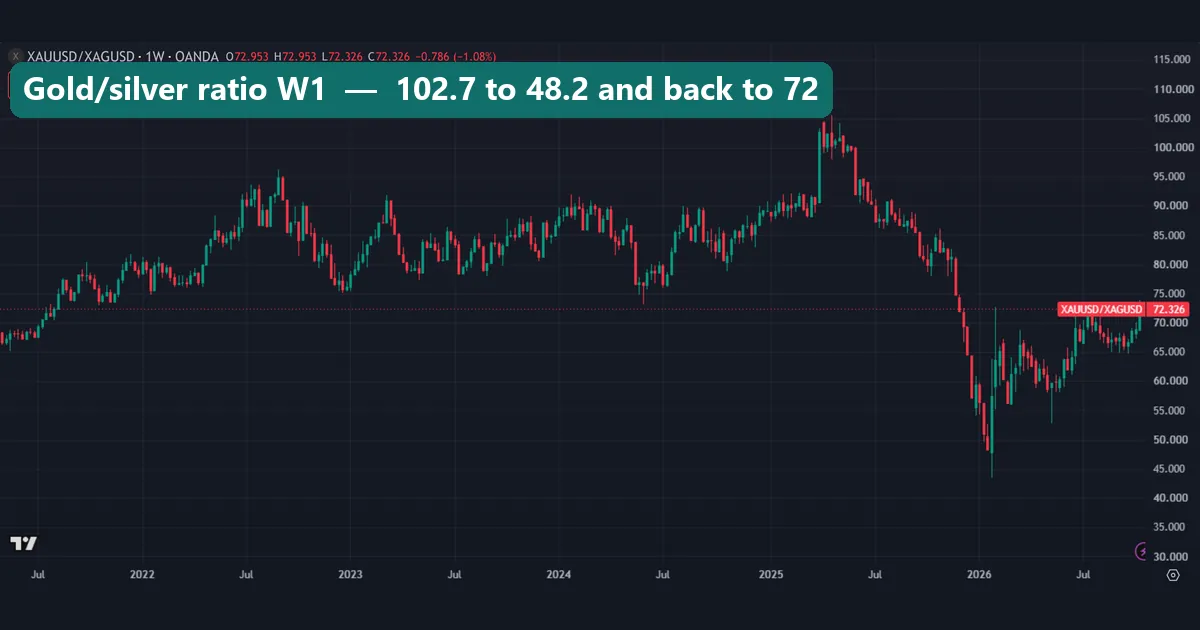
Then came two extremes. In the week of 31 March 2025 the weekly close reached 102.7, the high of our 300 weeks. About ten months later, in the week of 19 January 2026, it closed at 48.2, the low. That was silver’s spike: it rose much faster than gold, so the ratio lost more than half.
On 19 October 2026 the ratio stood at 72.3. A rising ratio means silver lags gold, and a falling ratio means silver outruns it. That reading holds whether both metals rise or both fall.
Worked example: XAGUSD against gold on 19 October 2026
Here is how our measured closes fit together.
Step 1, the ratio. Gold closed at 4,175.36 and silver at 57.7515. Divide one by the other: 4,175.36 / 57.7515 = 72.3. So one ounce of gold bought about 72 ounces of silver.
Step 2, a typical day in dollars. Silver’s median daily range was 4.04% of price. At 57.7515 that is about 2.33 dollars per ounce, or 233 one-cent steps. Gold’s median range was 2.02%, which comes to about 84.34 dollars per ounce. In percent, silver’s normal day was twice as wide as gold’s.
Step 3, equal risk. Say you want the same dollar risk on both metals, with a stop one median day away. Then the silver stop sits 4.04% from entry and the gold stop 2.02%. So the silver position should carry about half the dollar value of the gold one: 2.02 / 4.04 = 0.5. Our guide to position sizing covers the general method.
Step 4, the cost to get in. In our captures the OANDA quote gap was 3.1 cents on silver (57.629 against 57.660). On gold it was 36 cents (4,168.650 against 4,169.010). Against a median day, silver’s spread was about 1.3% of the move and gold’s about 0.4%. So silver cost roughly three times more per typical day to enter. Those spreads are single snapshots on one feed, and yours will differ.
What our measurement shows: how closely silver follows gold
Our two-panel chart sums up the link. On daily returns, silver’s correlation with gold was 0.825 (the chart rounds it to 0.82). On weekly returns it was 0.766. Square the daily figure and you get about 0.68. In plain terms, gold’s daily move lines up with about two-thirds of the swings in silver’s. The other third belongs to silver alone.
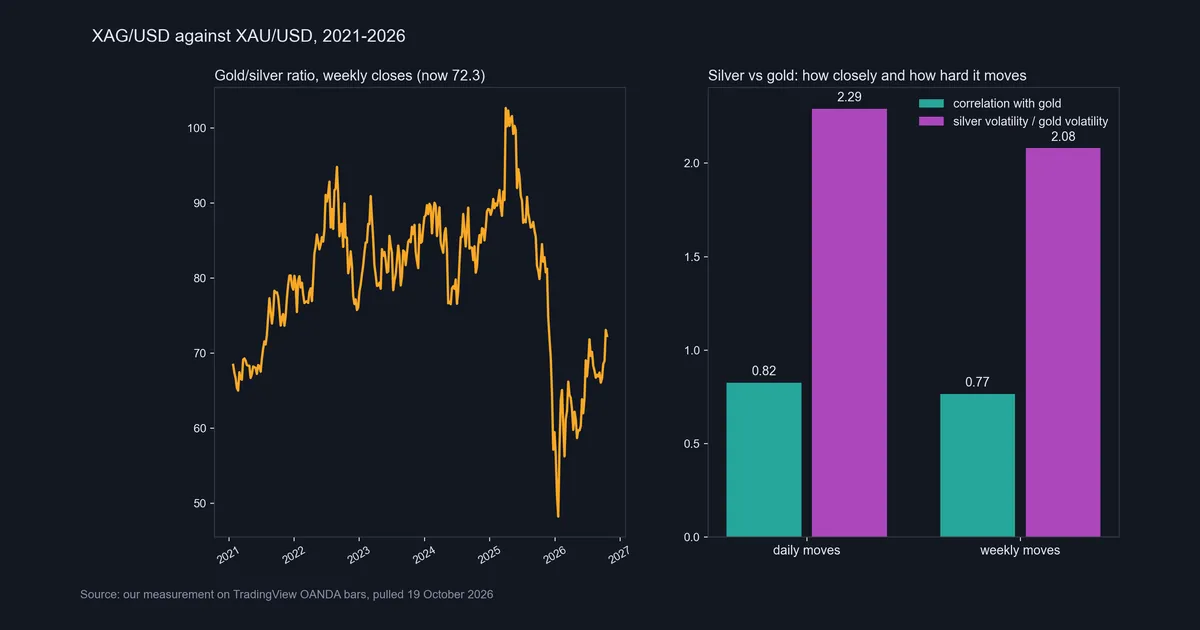
Silver also moved harder. Its daily returns were 2.29 times as volatile as gold’s, and its weekly returns 2.08 times. Multiply the two daily numbers (0.825 x 2.29) and a 1% gold day came with about a 1.9% silver day on average. That is an average over 300 days, not a rule for any single one. To compare silver with other markets, open our forex correlation matrix.
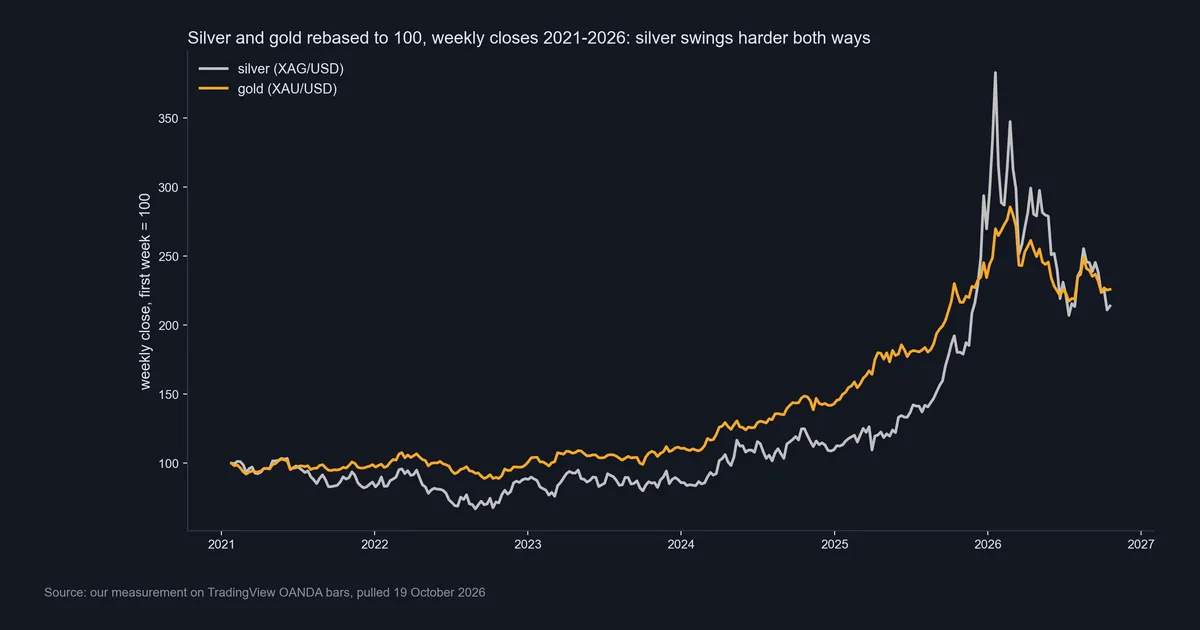
Silver and gold rebased to 100
Our second chart rebases both metals to 100 in the week of 25 January 2021. In the 2022 slump silver fell further, to about 67 against gold’s 89. At the top it rose much higher, near 380 in January 2026 against gold’s peak near 285. By 19 October 2026 the two had nearly met again, at about 214 for silver and 226 for gold.
Download the complete indicator database
Put these concepts on your charts. One email unlocks the full library of 1,380+ indicators with compiled MT4 and MT5 files, plus my TradingView scripts. No paywall, no spam, unsubscribe any time.
Get free access to my indicator database
One email unlocks 1,380+ free MT4, MT5 and TradingView indicators — the complete library. No single-tool download; you get the whole database.
Where it fails: what these silver numbers cannot do
First, a correlation of 0.825 still leaves many days when silver and gold part ways. So gold makes a weak “confirmation” signal for silver, and the weekly link was looser still. Also, we measured how much the metals move together, not which moves first.
Second, the ratio has no fixed home. It is tempting to call a reading near 90 “high” and wait for a return to some average. Yet our 300 weeks ran from 102.7 down to 48.2. A reading near 90 in early 2025 led to 102.7, not to a fall. Our page on forex commodity correlations shows how such links shift over time.
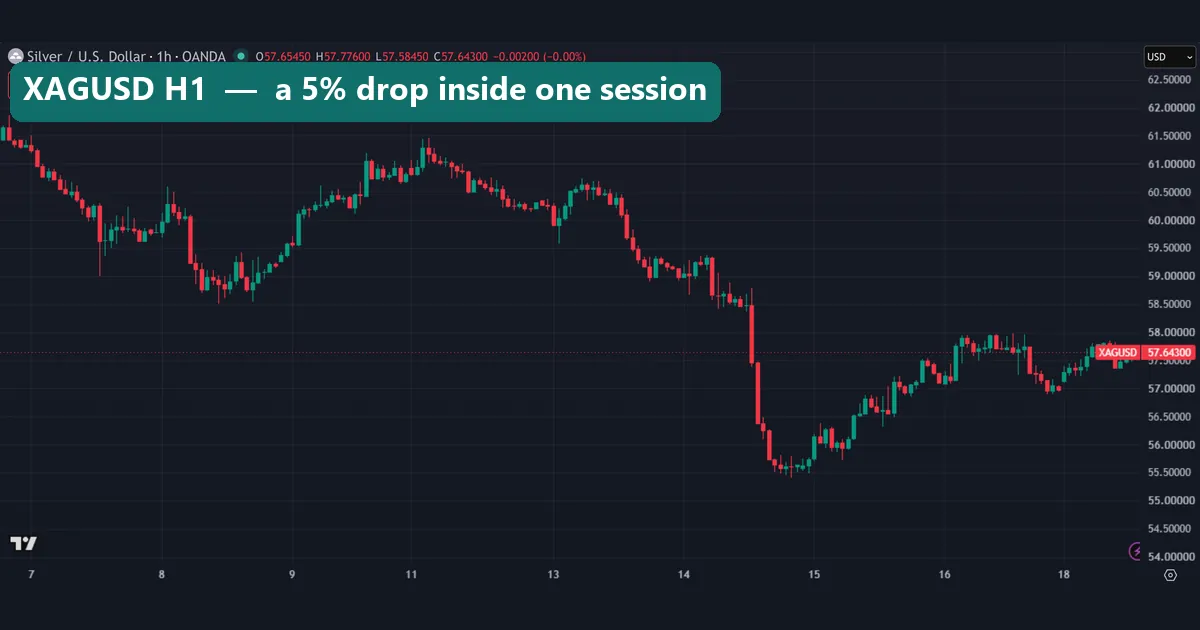
Third, the window is short and unusual. It holds a spike year, so the 2.29 volatility ratio may not hold in quieter years. Fourth, silver can cover a full day’s range in hours. On 14 October 2026 it fell from 58.68 at the 07:00 UTC bar to 55.64 at the 16:00 UTC bar. That is about 5.2% in nine hours, more than its median full-day range of 4.04%.
Finally, OANDA’s feed is not your broker’s feed. Prices, spreads and gaps differ, and spreads widen in thin hours. Silver also gaps over weekends; see our page on the weekend gap in forex.
Silver next to gold on the weekly chart
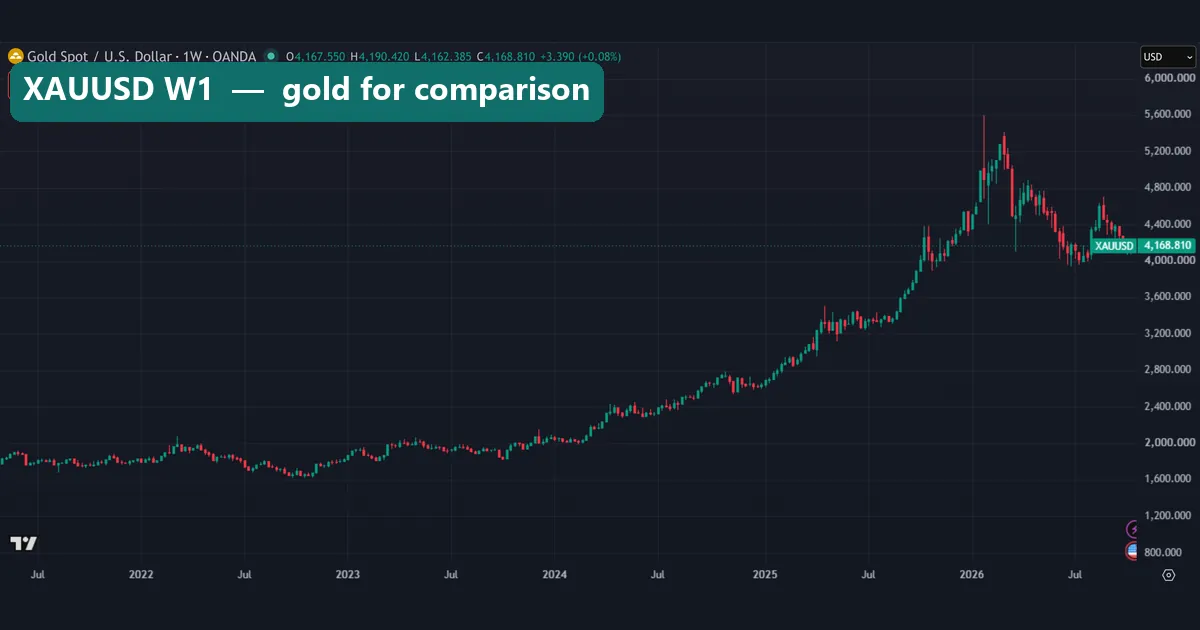
The gold weekly chart below covers the same years as our first silver chart. The shape is alike: a slow stretch to 2023, a climb through 2024 and 2025, and a peak in early 2026. The size is not. Gold’s top wick reached about 5,600 dollars, and the capture closed at 4,168.81, roughly a quarter below. Silver’s top wick sat just above 120, and its weekly close of 57.652 was more than half below. Same direction, about twice the damage.
Our gold RSI chart guide reads gold on its own terms. If you carry a gold method over to silver, widen the stops to match silver’s range first.
Common mistakes when trading XAGUSD
1. Copying gold’s lot size. Silver and gold contracts can hold very different numbers of ounces, and the prices differ by a factor of about 72. A lot size that feels normal on XAUUSD can mean a very different dollar exposure on XAGUSD. Check the contract size first, then work out the lot size from your risk.
2. Using gold’s stop distance. Silver’s median day was 4.04% against gold’s 2.02%. A stop set at the same percentage sits inside silver’s normal noise. Measure silver’s own range, for example with the method in our guide to ATR stop loss distance.
3. Treating the ratio as a timer. The ratio shows which metal has done better. It does not show when that will change, as the run from 102.7 to 48.2 made clear.
4. Ignoring overnight costs. Holding a contract past the daily rollover adds a swap charge or credit, and each broker sets its own rate for metals. Check it before you hold for weeks. Our page on swap in forex shows where to find it.
Where to go next
To compare silver’s swings with currency pairs, see our list of the most volatile forex pairs.
Outside our site, the Silver Institute’s supply and demand page splits silver use into industry, jewellery, silverware, photography, and coins and bars.
FAQ about XAGUSD
What does XAGUSD stand for?
XAG is the code for one troy ounce of silver, and USD is the US dollar. The price is the number of dollars one ounce costs. On 19 October 2026 our data had it at about 57.75.
Is XAGUSD the same as a silver futures contract?
No. Many brokers offer XAGUSD as a contract for difference with no expiry date. Futures trade on an exchange, have a fixed size and expire on set dates. The two prices track each other closely, but they are not identical.
How much is a one-cent move on XAGUSD worth?
One cent per ounce. Multiply that by the ounces in your contract and by your lots. Your broker’s contract size sits in the MT4 symbol specification, so do not assume it matches another broker’s.
Why does silver move more than gold?
We measured that it does: 2.29 times gold’s daily volatility and 2.08 times its weekly volatility. One common explanation is that silver is a smaller market with large industrial demand. We did not test that explanation.
What is the gold/silver ratio now?
It was 72.3 on 19 October 2026. Over our 300 weekly closes since January 2021, it ranged from 48.2 to 102.7.
Does gold lead silver?
We cannot say. We measured how closely daily and weekly returns line up, at 0.825 and 0.766, but not which metal moves first. A lead or lag claim needs its own test.
Can I trade XAGUSD on MetaTrader 4?
Yes, if your broker lists it. Names vary, and some brokers add a suffix to the symbol. Our Capital Point Trading terminal also carries silver against the euro and the Australian dollar.
Will silver go back above 100 dollars?
We do not forecast prices. Our numbers describe how silver behaved from 2021 to October 2026, and the next stretch may look nothing like it. Size positions for silver’s own range, and keep in mind that results are not guaranteed; past performance is not indicative of future results.
Last updated: 19 October 2026.

About the author
Written by Dominic Walsh, a Forex trader and MT4/MT5 indicator, Expert Advisor and script developer. Every tool on forexmt4systems.com is tested on live charts before release and ships with ready-to-use compiled MT4 (.ex4) and MT5 (.ex5) files. Learn more about the trader and developer behind this site.
How we build, test and correct every tool: Editorial & Testing Policy. Trading carries risk; see the disclaimer.