
Reading a gold RSI chart takes the same oscillator everyone knows and applies it to an instrument that trends harder than any currency pair. That combination is exactly where the classic overbought reading fails most expensively. This guide covers how RSI behaves on XAUUSD, why gold sits above 70 for weeks at a time, and the adjustments that keep the tool useful.
What a gold RSI chart measures
The Relative Strength Index compares the size of recent gains against recent losses over a fourteen-period lookback, scaling the result from 0 to 100. Readings above 70 are conventionally called overbought and below 30 oversold.
The calculation does not care what it is applied to. What changes on gold is the character of the underlying moves, and that changes how the readings should be interpreted.
Our guide to the best RSI indicator settings covers the lookback and thresholds. The default 14 works on gold as well as anywhere else; the interpretation is what needs adjusting.
Why gold stays extreme longer
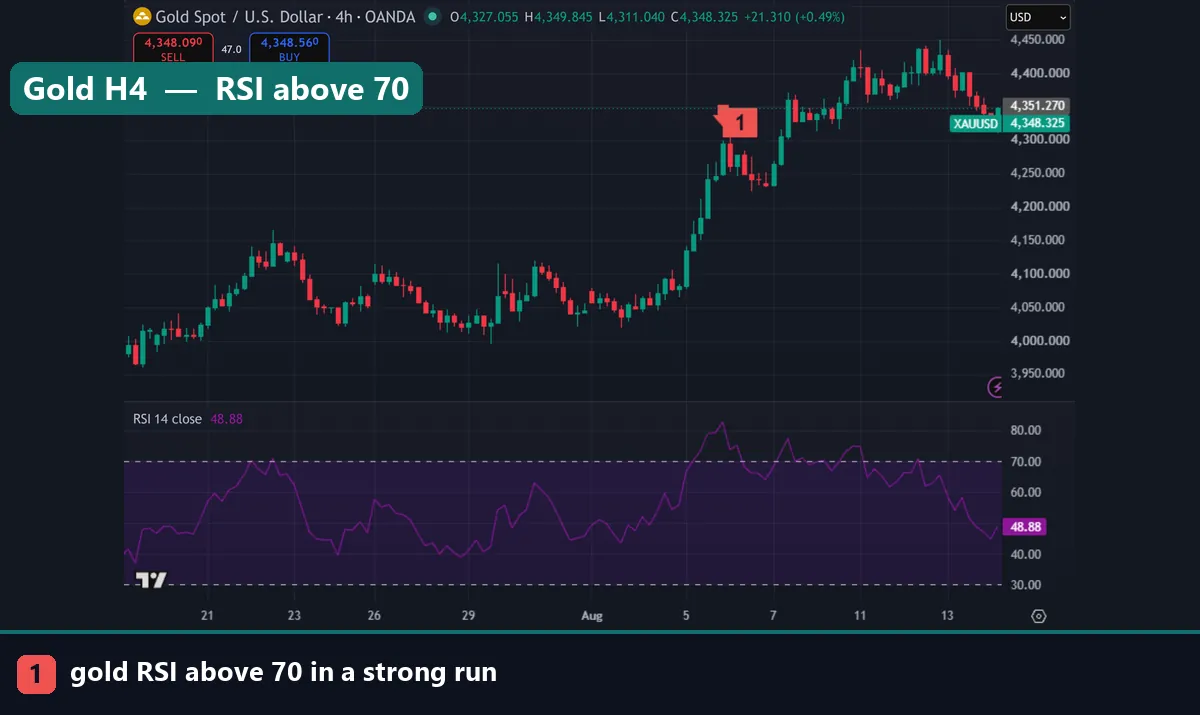
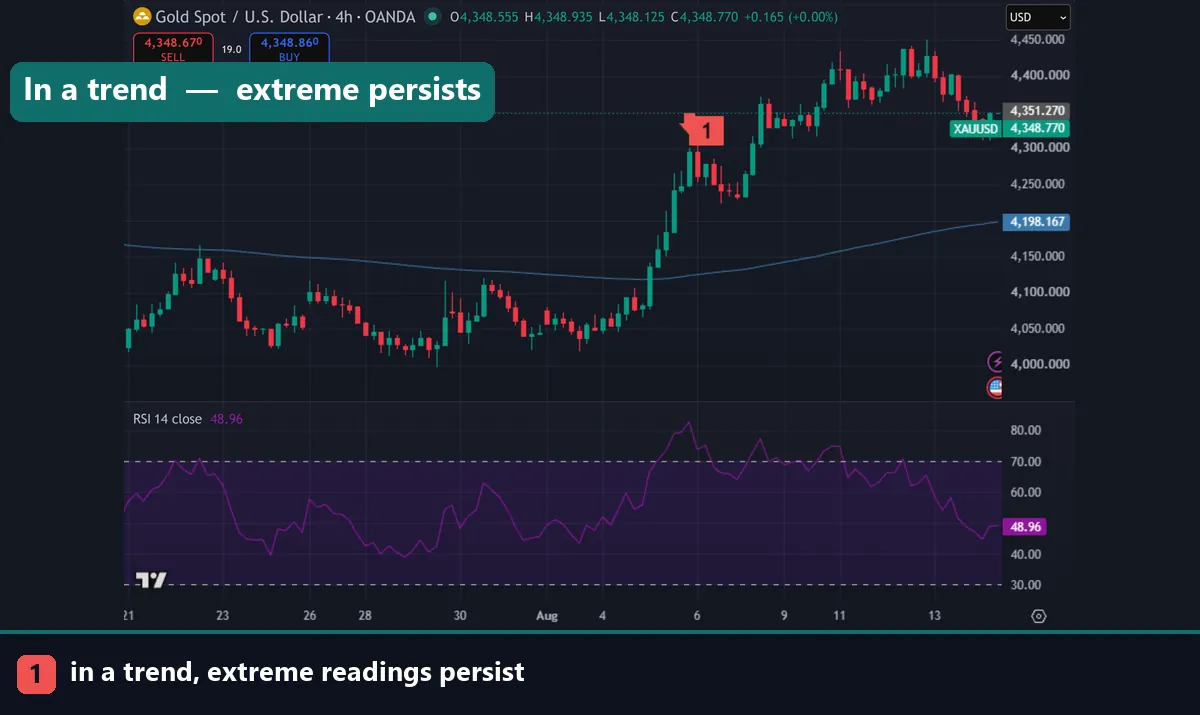
This is the central point of the article, so it deserves stating plainly. Gold trends more persistently than currency pairs, so RSI stays above 70 or below 30 for far longer.
The reason is structural. A currency pair is a relative price between two economies, and both sides are anchored by interest rates and trade flows. When one currency runs too far, the differential itself creates pressure the other way.
Gold has no such anchor. It pays no yield, has no earnings, and no central bank sets its rate. When capital moves into gold it can keep moving for months, and the ratio of up closes to down closes stays lopsided the whole time.
So a trader who sells the first 70 print on gold is betting against the strongest force on the chart, and will keep getting the same signal at higher prices. That is not a failure of the indicator; it is the indicator correctly reporting sustained strength.
Reading the chart in context
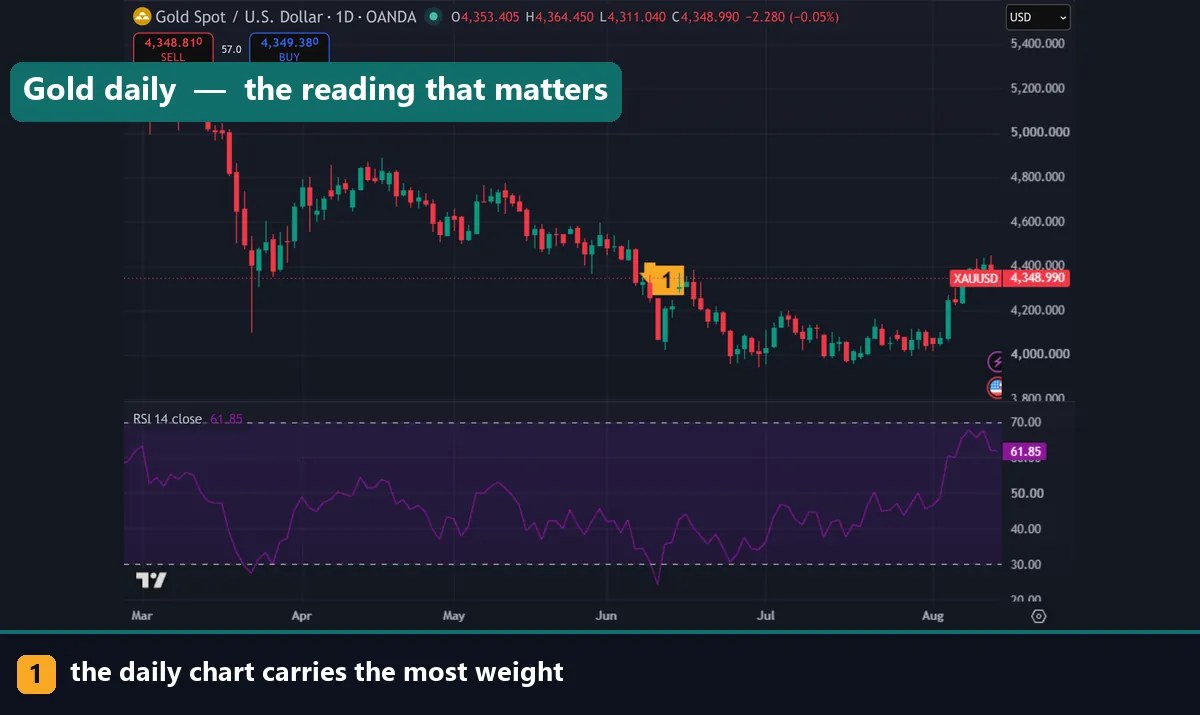
Regime decides everything. Two questions come before any RSI reading.
Is gold trending or ranging? In a range, extremes mark the edges and mean reversion works. In a trend, extremes confirm strength and fading them loses. A 200 EMA on the same chart answers this quickly: price persistently above it means trend, price crossing it repeatedly means range.
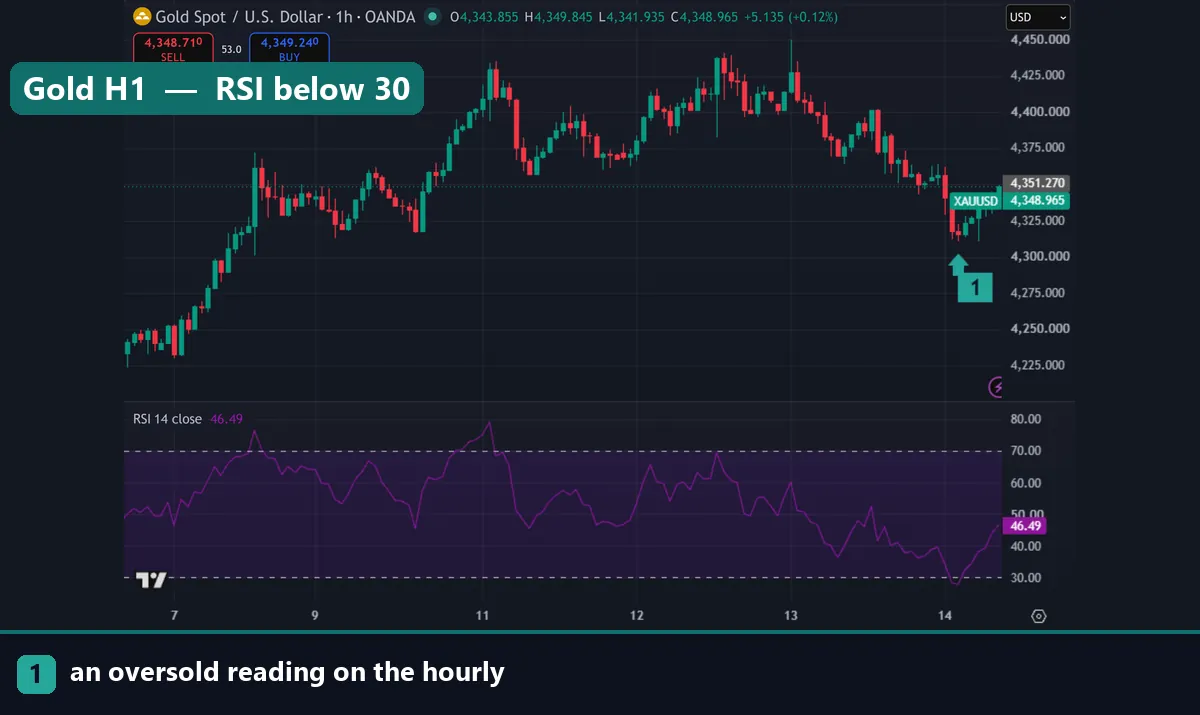
Which timeframe? An oversold H1 reading inside a daily uptrend is a pullback worth buying. The same reading with the daily also falling is continuation, not opportunity.
Alignment across timeframes is the useful signal. Gold oversold on both H4 and the daily is a different proposition from gold oversold on M15 alone.
The reading that carries weight
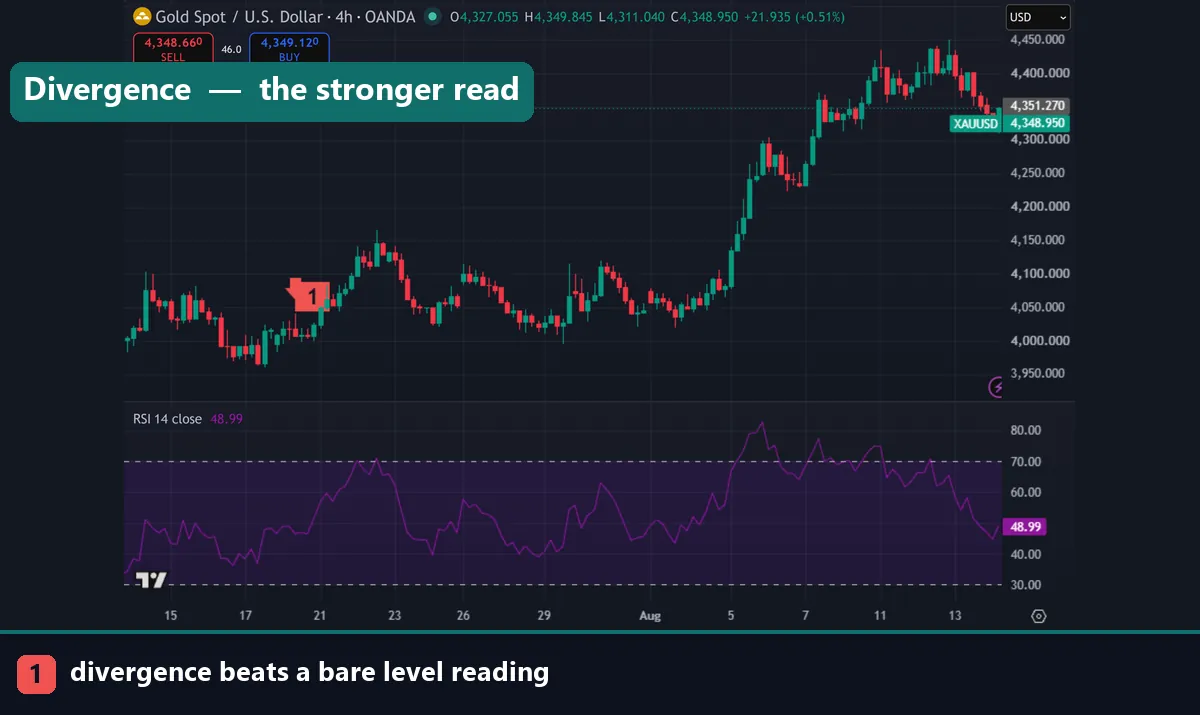
Divergence is the strongest signal RSI produces on gold, precisely because it does not depend on a threshold.
Price making a new high while RSI makes a lower high says the new high came with less force behind it. That compares two swings rather than reading one value, which is why it survives gold’s tendency to hold extreme readings.
The usual caveat applies with extra weight here: divergence on gold can persist for a very long time. A strong run will print divergence repeatedly on the way up, and each one loses money for anyone acting on it alone. Our RSI divergences cheat sheet covers the four types and the confirmation that makes them tradeable.
Wait for a structural break — a close beyond the swing that formed the divergence — before treating it as a signal rather than a warning.
Download the complete indicator database
Put these concepts on your charts. One email unlocks the full library of 1,380+ indicators with compiled MT4 and MT5 files, plus my TradingView scripts. No paywall, no spam, unsubscribe any time.
Get free access to my indicator database
One email unlocks 1,380+ free MT4, MT5 and TradingView indicators — the complete library. No single-tool download; you get the whole database.
Practical adjustments for gold
Three changes make RSI more useful on this instrument.
Shift the thresholds in a trend. Many practitioners use 40 to 80 in an uptrend and 20 to 60 in a downtrend. That keeps the tool timing pullbacks rather than trying to call tops, which is where it earns its keep on gold.
Add a trend filter. With a 200 EMA on the chart, take oversold buys only above the line and overbought sells only below it. That single rule removes most of the losing signals.
Work on H4 and daily. Gold’s intraday noise produces constant RSI signals on M5 and M15 that lead nowhere, and the wide spread makes short-term trades expensive anyway.
Size from volatility rather than from the RSI reading. Gold’s daily range dwarfs the majors and its contract is 100 ounces, so our ATR stop loss guide and the position sizing calculator matter more here than the entry signal does.
What moves gold regardless of RSI
Three drivers override any technical reading. Real interest rates lead: gold pays no yield, so higher real rates raise the cost of holding it. Risk events push capital towards gold independently of rates. And dollar strength matters because gold is priced in dollars.
A Federal Reserve decision or an inflation print will drive gold straight through any level, whatever the oscillator says. Check the calendar before planning around a reading, as covered in our forex news factory guide.
Common mistakes
Four repeat. Selling every 70 print tops the list, and on gold that is a reliably losing rule. Ignoring the higher timeframe comes second, which turns a pullback into a perceived reversal. Third, traders act on divergence immediately, when on gold it can run for months. Fourth, they size the position from forex habits rather than from the 100-ounce contract.
Where to go next
RSI is one input among several. Set it up with the best RSI indicator settings, then read the RSI divergences cheat sheet for its strongest reading and RSI buy and sell signals for the rest. For levels on the same instrument, see gold pivot points, and volatile forex pairs for how gold compares on range. For further reading, Investopedia explains the Relative Strength Index at Investopedia, and the gold as an investment article on Wikipedia covers what drives the metal.
FAQ
How do I read a gold RSI chart?
The same way as any RSI, with one adjustment: establish whether gold is trending or ranging first. In a range, extremes suggest reversal. In a trend, they confirm strength and fading them loses money.
Why does gold RSI stay above 70 so long?
Gold has no yield, no earnings and no central bank setting its rate, so nothing anchors it the way rate differentials anchor a currency pair. Trends run further, and the oscillator reports that honestly.
What RSI settings suit gold?
The default 14 works. What helps more is shifting the thresholds in a trend, commonly 40 to 80 in an uptrend and 20 to 60 in a downtrend, so the tool times pullbacks instead of calling tops.
Which timeframe works best?
H4 and daily. Gold’s intraday noise produces constant signals on M5 and M15 that lead nowhere, and the wide spread makes short-term trades expensive.
Is divergence reliable on gold?
It is the strongest reading RSI produces here, though it can persist for months in a strong run. Wait for a close beyond the swing that formed it before treating it as more than a warning.
Can I trade gold on RSI alone?
No. Real rates, risk events and dollar strength override any technical reading, and gold’s contract size demands careful sizing. Trading involves risk, results are not guaranteed, and past performance is not indicative of future results.

About the author
Written by Dominic Walsh, a Forex trader and MT4/MT5 indicator, Expert Advisor and script developer. Every tool on forexmt4systems.com is tested on live charts before release and ships with ready-to-use compiled MT4 (.ex4) and MT5 (.ex5) files. Learn more about the trader and developer behind this site.
How we build, test and correct every tool: Editorial & Testing Policy. Trading carries risk; see the disclaimer.