
This RSI divergences cheat sheet puts the four divergence types in one place, with the exact price-and-indicator condition for each and what it implies. Divergence is the strongest reading RSI produces, because it compares two swings rather than reading one value. It is also the most misused, so the tables below are followed by the confirmation rules that keep it honest.
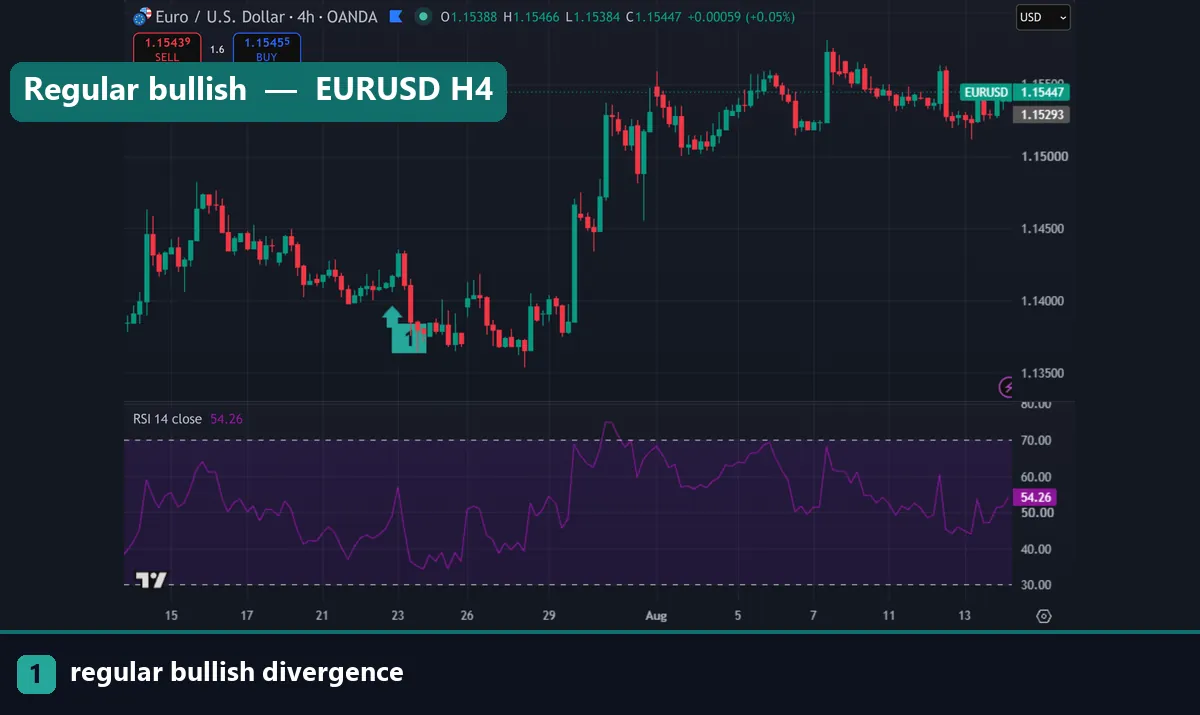
What divergence measures
RSI compares the size of recent gains against recent losses over a fourteen-period lookback. Divergence occurs when price makes a new extreme and RSI does not follow.
The reasoning is about force rather than direction. If price grinds to a new low but the selling behind it was weaker than the selling that produced the previous low, the move has less behind it than it appears. That is a change in the balance, not a reversal signal.
Crucially, divergence needs two swing points. A single RSI reading tells you the current state; divergence tells you the state is shifting. Our guide to the best RSI indicator settings covers the lookback behind these readings.
The RSI divergences cheat sheet
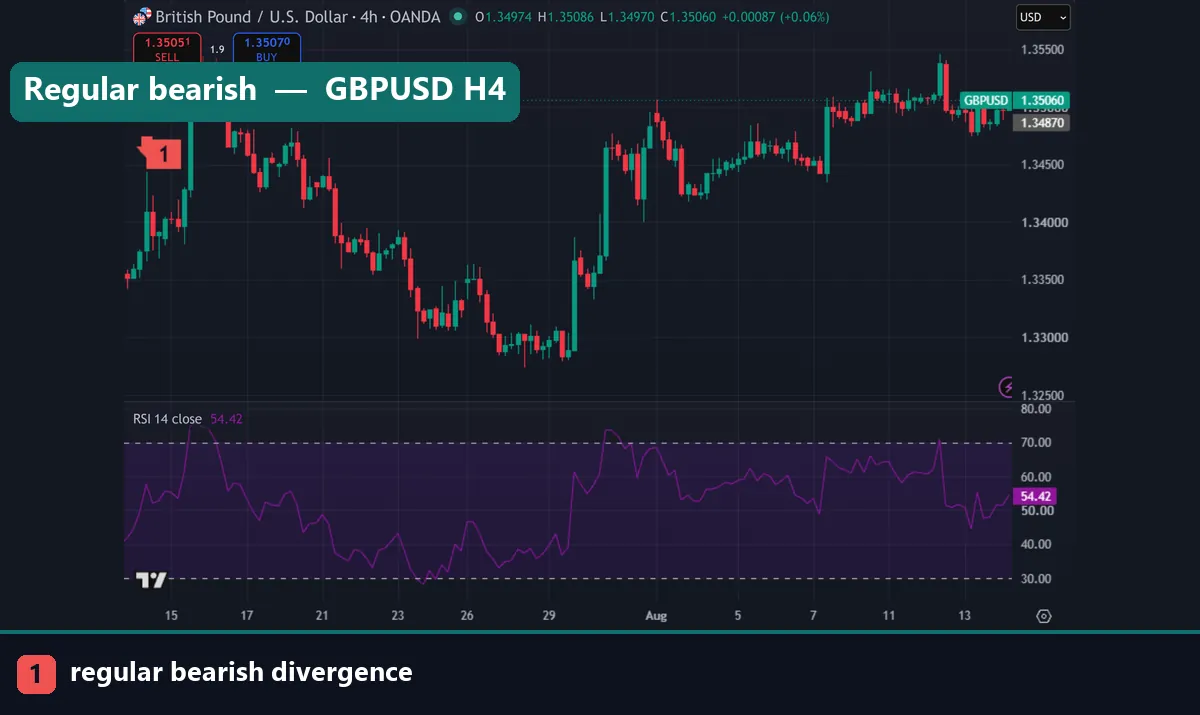
Four types, split into regular divergence which suggests reversal and hidden divergence which suggests continuation.
| Type | Price does | RSI does | Suggests | Where to look |
|---|---|---|---|---|
| Regular bullish | Lower low | Higher low | Downtrend weakening, possible turn up | End of a downtrend |
| Regular bearish | Higher high | Lower high | Uptrend weakening, possible turn down | End of an uptrend |
| Hidden bullish | Higher low | Lower low | Uptrend intact, pullback ending | Pullback within an uptrend |
| Hidden bearish | Lower high | Higher high | Downtrend intact, bounce ending | Bounce within a downtrend |
The pattern is easy to hold once you see it. In regular divergence, price makes the more extreme reading. In hidden divergence, RSI makes the more extreme reading. Regular warns of reversal; hidden supports continuation.
Hidden divergence is the more useful of the two for most traders, precisely because it trades with the trend rather than against it, and trend-following setups are more forgiving.
Drawing it correctly
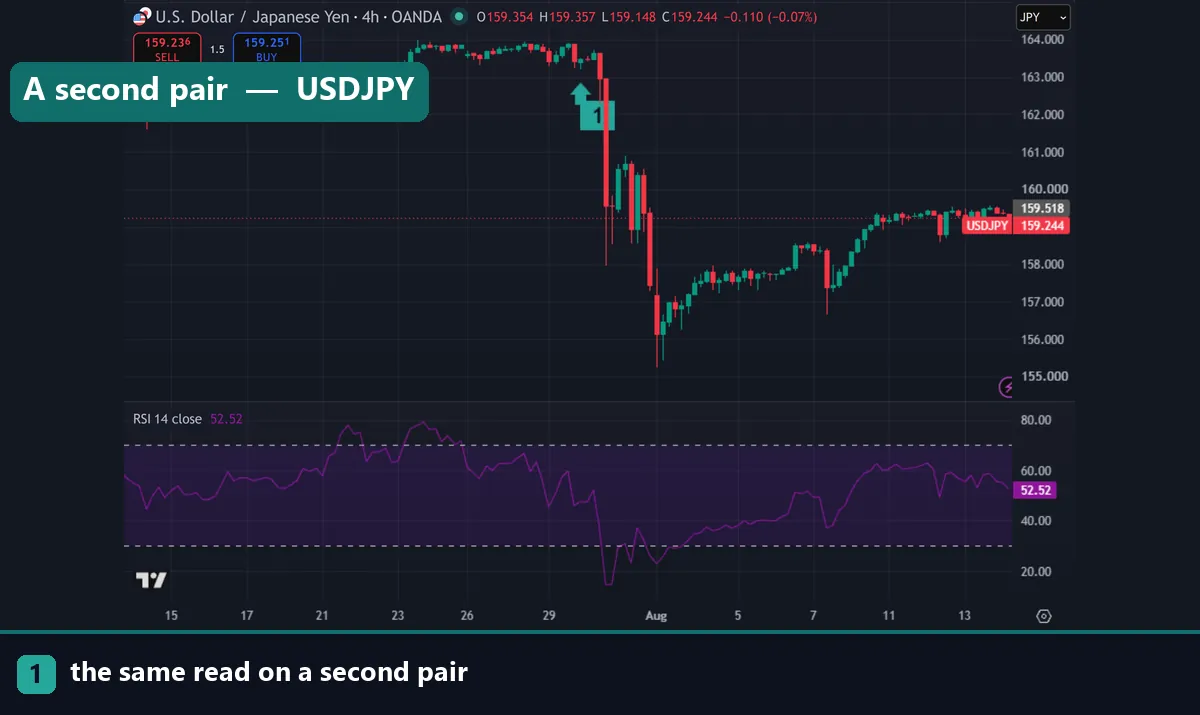
Most bad divergence calls come from careless drawing rather than a bad concept. Four rules keep it clean.
Connect swing points, not arbitrary bars. A swing low needs lower lows either side of it. If you cannot identify the pivot without squinting, it is not one.
Match the points on both charts. The RSI low you use must correspond to the same bar as the price low. Connecting a price low to an RSI low several bars away is the single most common error.
Keep the swings adjacent. Divergence between two swings twenty bars apart is meaningful. Between swings a hundred bars apart, with several swings in between you ignored, it is cherry-picking.
Do not skip intervening swings. If there is a swing between your two points, use it. Choosing which pivots to connect until the picture agrees with your bias is how divergence gets a bad reputation.
The confirmation problem
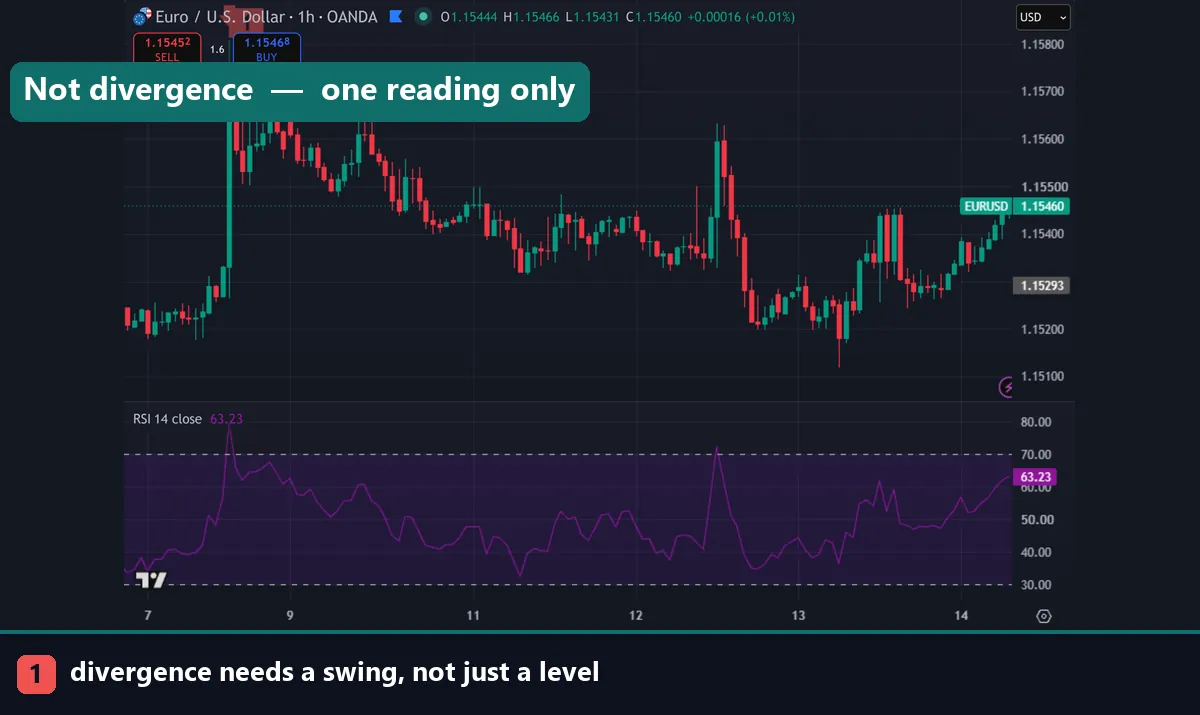
Here is the part that costs people money, and it deserves its own section.
Divergence can persist for a very long time. In a strong trend, price will keep making new extremes while RSI keeps failing to follow, and it can do that for weeks. Each new divergence looks like a better signal than the last, and each one loses money for anyone who acts on it alone.
So divergence is a warning, not a trigger. It says momentum is fading, and momentum can fade for a long time before price responds — or never respond at all if fresh buying arrives.
Three confirmations turn it into something tradeable. Wait for a structural break, meaning price closes beyond the swing that formed the divergence. Wait for a level, so the divergence coincides with support or resistance that already matters. Or wait for a candle reaction at that level rather than entering on the divergence itself.
Our bullish divergence guide covers the confirmation sequence in more depth.
Download the complete indicator database
Put these concepts on your charts. One email unlocks the full library of 1,380+ indicators with compiled MT4 and MT5 files, plus my TradingView scripts. No paywall, no spam, unsubscribe any time.
Get free access to my indicator database
One email unlocks 1,380+ free MT4, MT5 and TradingView indicators — the complete library. No single-tool download; you get the whole database.
Where each type works best
Context decides whether a divergence is worth anything.
Regular divergence works best at the end of an extended move, ideally at a level that has already turned price before. It works poorly in the middle of a strong trend, where it appears constantly and means little.
Hidden divergence works best on pullbacks inside an established trend. If the higher timeframe is clearly trending and price is retracing, hidden divergence at the end of that retracement is a reasonable continuation read.
Timeframe matters as much as type. H4 and daily divergences carry far more weight than M5, where the swings are noise. Many traders find divergence on fast charts almost useless for this reason.
Set the stop beyond the swing that formed the divergence, since a break of it means the read was wrong. Our ATR stop loss guide handles the distance and the position sizing calculator the lots.
Common mistakes
Four repeat. Trading divergence without confirmation tops the list, and in a trend it is a reliable way to lose. Connecting mismatched points on price and RSI comes second. Third, traders skip intervening swings until the chart agrees with them. Fourth, they hunt divergence on M1 and M5 where the swings carry no information.
Where to go next
Divergence is one reading among several. Set the tool up with the best RSI indicator settings, then read bullish divergence for the full mechanics and RSI buy and sell signals for the other reads. To scan several pairs at once, see the RSI heat map. To add a divergence indicator, follow how to install MT4 and MT5 indicators. For further reading, Investopedia explains divergence at Investopedia, and the RSI article on Wikipedia covers Wilder’s formula.
FAQ
What are the four RSI divergence types?
Regular bullish (lower low in price, higher low in RSI), regular bearish (higher high in price, lower high in RSI), hidden bullish (higher low in price, lower low in RSI) and hidden bearish (lower high in price, higher high in RSI).
What is the difference between regular and hidden divergence?
In regular divergence price makes the more extreme reading and it suggests reversal. In hidden divergence RSI makes the more extreme reading and it suggests the existing trend continues after a pullback.
Why does divergence keep failing?
Because it is a warning rather than a trigger. In a strong trend price can keep making new extremes while RSI fails to follow, for weeks. It needs a structural break or a level to become tradeable.
How do I draw divergence correctly?
Connect genuine swing points, match each RSI point to the same bar as its price point, keep the swings adjacent, and never skip an intervening swing to make the picture fit.
Which timeframe works best?
H4 and daily. The swings on those charts carry real information, whereas M1 and M5 produce constant divergences from noise that rarely lead anywhere.
Can I trade divergence on its own?
Not reliably. Pair it with a level and wait for price confirmation before acting. Trading involves risk, results are not guaranteed, and past performance is not indicative of future results.

About the author
Written by Dominic Walsh, a Forex trader and MT4/MT5 indicator, Expert Advisor and script developer. Every tool on forexmt4systems.com is tested on live charts before release and ships with ready-to-use compiled MT4 (.ex4) and MT5 (.ex5) files. Learn more about the trader and developer behind this site.
How we build, test and correct every tool: Editorial & Testing Policy. Trading carries risk; see the disclaimer.