
The G10 currencies are the US dollar, euro, Japanese yen, British pound, Swiss franc, Canadian dollar, Australian dollar, New Zealand dollar, Swedish krona and Norwegian krone. This guide settles three questions. Why does a list of ten carry the name of a group with eleven countries? How much does each one trade? And how did the nine non-dollar members move against the dollar from January 2021 to October 2026?
What are the G10 currencies?
In trading, “G10 currencies” is shorthand for ten currencies of large, rich economies. All ten float freely, so the market sets their prices. Here is the list, with the central bank behind each one:
- USD, US dollar: Federal Reserve
- EUR, euro: European Central Bank
- JPY, Japanese yen: Bank of Japan
- GBP, British pound: Bank of England
- CHF, Swiss franc: Swiss National Bank
- CAD, Canadian dollar: Bank of Canada
- AUD, Australian dollar: Reserve Bank of Australia
- NZD, New Zealand dollar: Reserve Bank of New Zealand
- SEK, Swedish krona: Sveriges Riksbank
- NOK, Norwegian krone: Norges Bank
Each central bank sets its own interest rate. For example, Norges Bank’s monetary policy page says it sets the policy rate to keep inflation low and stable in Norway. Rate gaps are one reason these currencies drift apart, as our guide to the interest rate differential explains.
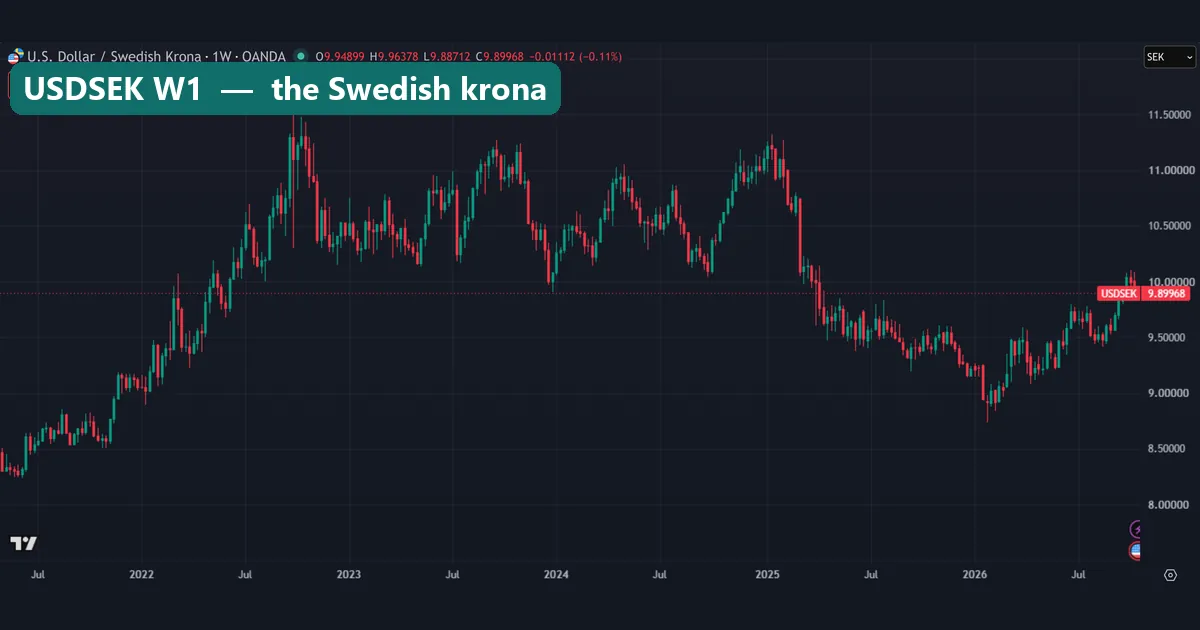
The krona chart above shows a smaller member: USDSEK rose from about 8.50 in mid-2021 to near 11.50 in late 2022. Then it fell hard in 2025 and dipped below 9.00 early in 2026. The last close in our shot was 9.89968.
Why “G10” when the group has eleven countries
The name comes from the Group of Ten. In 1962, ten countries agreed to lend extra money to the International Monetary Fund. Switzerland joined in 1964 and became a full member in 1983, but the name stayed. The Group of Ten entry on Wikipedia lists the eleven: Belgium, Canada, France, Germany, Italy, Japan, the Netherlands, Sweden, Switzerland, the United Kingdom and the United States.
Now compare that with the currency list. Five members now share the euro, so the eleven countries use just seven currencies: USD, EUR, JPY, GBP, CHF, CAD and SEK. Traders then added the Australian dollar, the New Zealand dollar and the Norwegian krone. None of those three countries belongs to the Group of Ten.
In short, the trading list borrowed the name, not the membership. We found no official body that publishes it, so it is market custom.
How G10 currencies are quoted and measured
Every exchange rate is a ratio. EURUSD near 1.12 means one euro buys about 1.12 dollars, while USDJPY near 158 means one dollar buys about 158 yen.
By habit, the euro, the pound and the Australian and New Zealand dollars come as dollars per unit. The other five come as units per dollar. The Federal Reserve’s H.10 exchange-rate release uses the same split and marks the dollars-per-unit rows with an asterisk.
To compare all nine, we turned every pair into “this currency against the dollar”:
- EURUSD, GBPUSD, AUDUSD, NZDUSD:
change = end close / start close - 1 - USDJPY, USDCHF, USDCAD, USDSEK, USDNOK:
change = start close / end close - 1 - Weekly log change:
r = ln(this close / last close), sign flipped for dollar-first pairs - Annualised volatility:
standard deviation of r x sqrt(52) - Correlation: the Pearson correlation of r between two currencies
A positive change means the currency gained on the dollar. Volatility tells you how big the weekly swings were, scaled to a year.
How much each G10 currency trades
The Bank for International Settlements surveys FX turnover every three years. Its April 2025 round found $9.6 trillion of trading per day. Each trade has two currencies, so the shares add up to 200%.
The dollar sat on one side of 89.2% of all trades. Next came the euro at 28.9%, the yen at 16.8% and the pound at 10.2%. The franc reached 6.4%, while the Australian and Canadian dollars held around 6% each, according to the BIS 2025 Triennial Survey results.
The Chinese renminbi reached 8.5%, more than the franc or either of those dollars. Yet nobody counts it as G10, because China’s central bank sets a daily reference rate and limits moves away from it. In other words, G10 means free-floating, not simply big.
The krona, the krone and the New Zealand dollar do not even get a mention in the release’s text. They trade far less, and that shows up in what you pay to trade them.
How we tested
We pulled weekly OANDA bars for all nine non-dollar G10 currencies on a TradingView web chart: EURUSD, GBPUSD, AUDUSD, NZDUSD, USDJPY, USDCHF, USDCAD, USDSEK and USDNOK. The window runs from the week of 25 January 2021 to the week of 19 October 2026, which gives 299 shared weekly changes. We took the shots on 19 October 2026; images 4 and 5 are our own charts.
For a second view, we used daily bars from MetaTrader 4, build 1471, with Capital Point Trading history to 24 August 2026. That feed has no NZDUSD, USDSEK or USDNOK, so it covers only six currencies. From it we took median daily ranges, where range means (high – low) / close, plus yearly changes and daily correlations.
We did not use volume, since forex feeds carry tick counts only. These are price measurements, not trade results, so no spread, swap or commission enters them. Our methods follow the editorial testing policy.
The G10 currencies in numbers
The table ranks the nine by change against the dollar. The last column uses the MetaTrader 4 data.
| Currency | Pair we used | Change vs USD, Jan 2021 to Oct 2026 | Annualised volatility | Median daily range (MT4) |
|---|---|---|---|---|
| Swiss franc (CHF) | USDCHF | +8.0% | 7.9% | 0.676% |
| British pound (GBP) | GBPUSD | -2.7% | 7.6% | 0.685% |
| Euro (EUR) | EURUSD | -7.5% | 7.0% | 0.62% |
| Australian dollar (AUD) | AUDUSD | -8.5% | 9.5% | 0.893% |
| Norwegian krone (NOK) | USDNOK | -8.9% | 10.9% | no data |
| Canadian dollar (CAD) | USDCAD | -9.2% | 5.9% | 0.544% |
| Swedish krona (SEK) | USDSEK | -15.4% | 10.5% | no data |
| New Zealand dollar (NZD) | NZDUSD | -21.1% | 10.1% | no data |
| Japanese yen (JPY) | USDJPY | -33.8% | 9.3% | 0.691% |
Three results stand out. Only the franc gained on the dollar. The yen lost a third of its dollar value. And the three smallest markets, the krone, krona and kiwi, swung the most, at 10.1% to 10.9% a year. By contrast, the Canadian dollar was the calmest at 5.9%.
Reading G10 currency charts the right way up
A rising chart does not always mean a rising currency. On USDNOK, a climb means the krone is getting weaker. On NZDUSD, a climb means the kiwi is getting stronger.
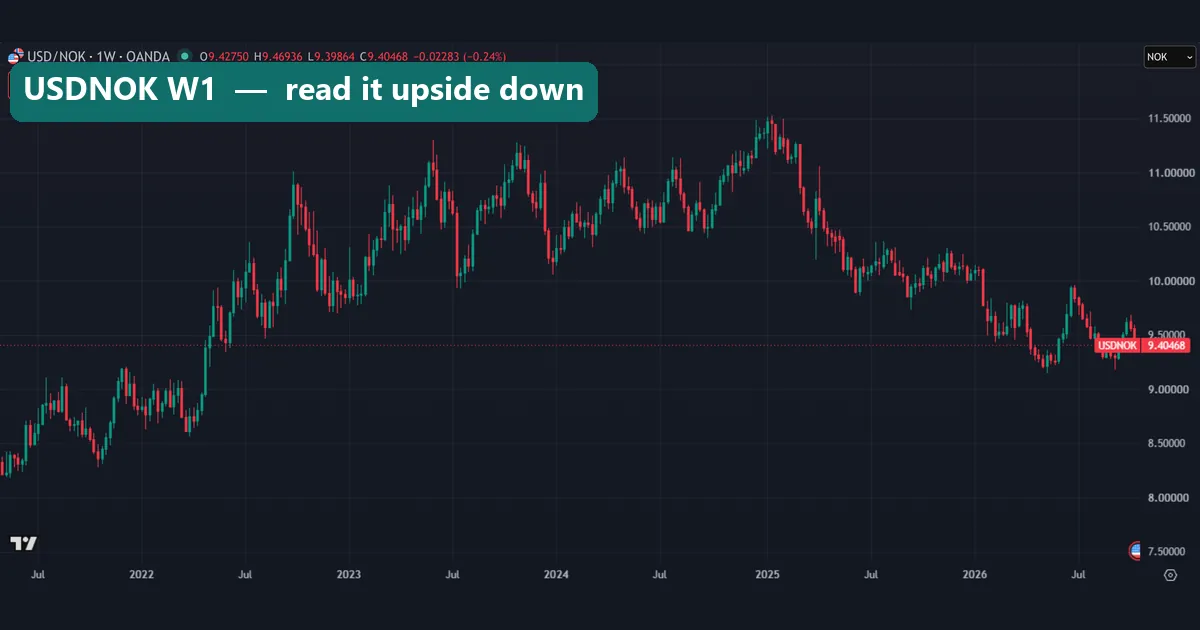
Our USDNOK chart climbs from about 8.30 in mid-2021 to near 11.50 at the turn of 2025. That is the krone losing ground. Then the line falls to a last close of 9.40468, as the krone wins some back. Across the window it still lost 8.9%.
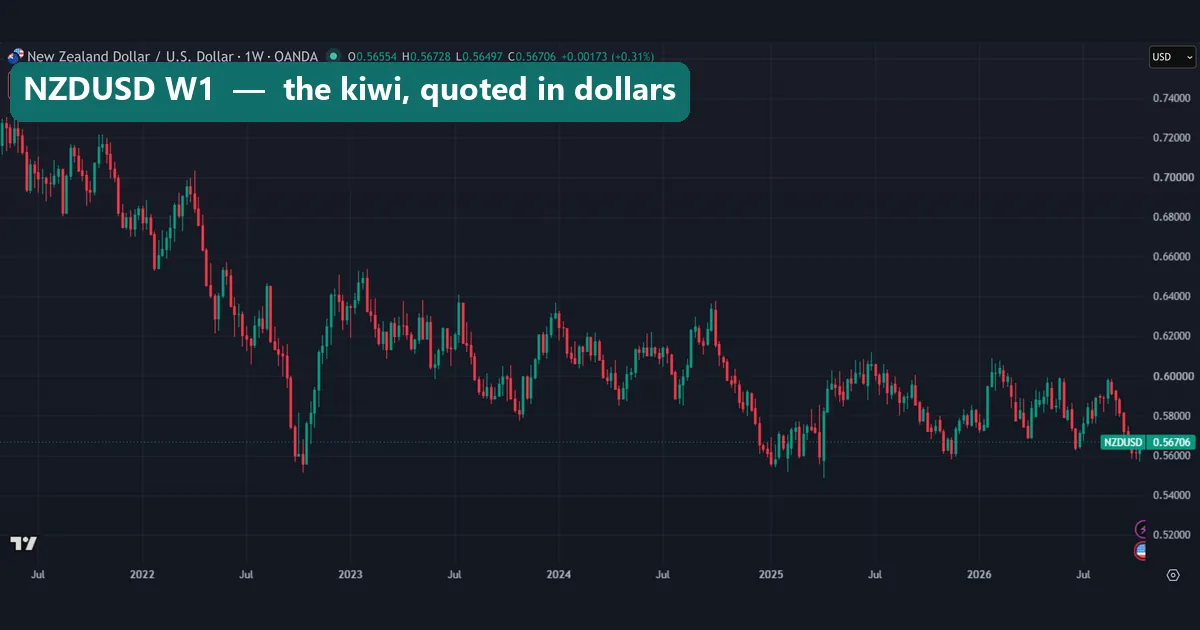
NZDUSD reads the other way round. It slid from above 0.72 in mid-2021 to near 0.55 in late 2022, then sank there again in 2025. The last close was 0.56706, and the kiwi lost 21.1% overall.
Also look at the boxes at the top left of each shot. They show OANDA’s sell and buy quotes at the moment of capture. USDNOK showed a 30.6-pip gap, but NZDUSD only 1.3 pips. As a share of price, that is about 0.033% against 0.023%. One snapshot proves little, yet the order matches the BIS ranking. Our page on the spread in forex explains that cost.
Worked example: what a 33.8% yen fall looks like on USDJPY
The yen shows why direction matters. Follow the numbers from our weekly data:
- The yen lost 33.8% against the dollar from January 2021 to October 2026.
- So one yen bought 1 – 0.338 = 0.662 times as many dollars at the end.
- USDJPY is the same ratio flipped. Its rise was 1 / 0.662 = 1.511, or about 51%.
- The franc gained 8.0%, so USDCHF fell by 1 – 1 / 1.08, about 7.4%.
So percentage moves do not mirror each other. The yen would need that same 51% gain just to get back to its start.
Our daily MetaTrader 4 data shows how the fall built up. The yen lost 10.3% in 2021, 12.2% in 2022, 7.0% in 2023 and 10.3% in 2024. In 2025 it gained just 0.3%.
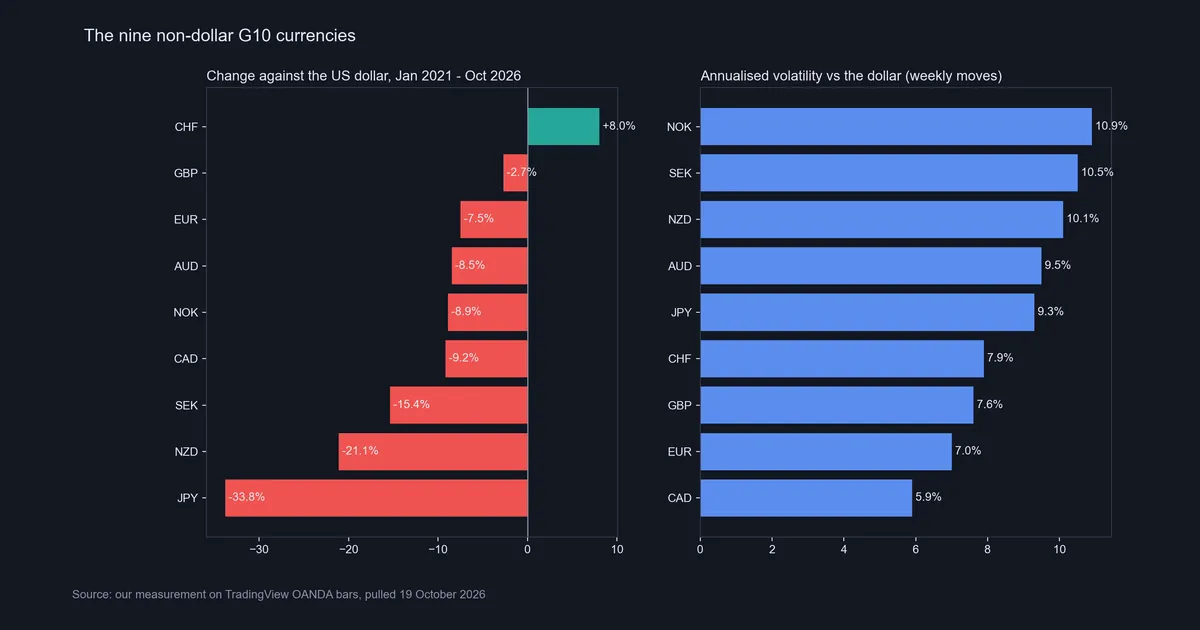
Our data chart puts all nine side by side. Note how the panels disagree: the yen swung less than the krone each week, yet it lost far more.
How the G10 currencies move together
Correlation shows how often two currencies move the same way against the dollar. Near 1 means they tend to move together; near 0 means little link.
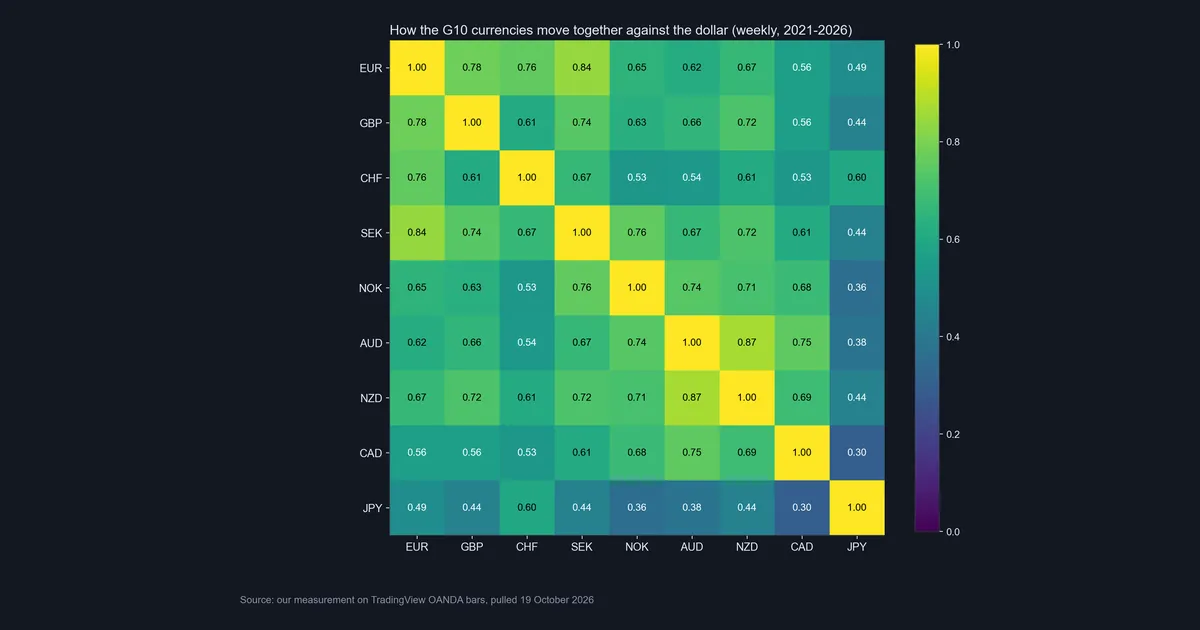
The strongest links sit between neighbours. The Australian and New Zealand dollars scored 0.87, the highest in our grid. Next, the euro and the krona scored 0.84, and the euro and the pound 0.78. The yen was the loner, from 0.30 against the Canadian dollar to 0.60 against the franc. Daily MetaTrader 4 bars agree, with CAD and JPY at only 0.27.
So a long AUDUSD trade plus a long NZDUSD trade is close to one bigger bet. Our forex correlation matrix does the sums, and the guide to currency correlation in forex explains the output.
Download the complete indicator database
Put these concepts on your charts. One email unlocks the full library of 1,380+ indicators with compiled MT4 and MT5 files, plus my TradingView scripts. No paywall, no spam, unsubscribe any time.
Get free access to my indicator database
One email unlocks 1,380+ free MT4, MT5 and TradingView indicators — the complete library. No single-tool download; you get the whole database.
Where it fails
The label says nothing about safety. Membership did not stop the yen from losing a third of its dollar value in under six years.
The answer depends on the window. Our MetaTrader 4 window starts in 2020 and ends on 24 August 2026. Over it, the pound gained 10.2% and the euro 5.9% against the dollar. Over the weekly window from January 2021, they lost 2.7% and 7.5%. Both results are correct. Only the start date differs, and it flips the sign.
Correlations drift. Our 0.87 for AUD and NZD is a 299-week average that hides weeks when the two split apart.
Our daily data has gaps. The MetaTrader 4 feed lacks NZD, SEK and NOK pairs, so its daily figures cover six of the ten.
Weekly closes hide the path. A move inside the week can hit a stop and never show in our volatility figures. Spreads change too, as our why spreads widen guide shows, so our snapshot is one moment, not a typical cost.
Safe havens and commodity currencies: what the labels missed
Traders often call the franc and the yen safe-haven currencies. Meanwhile, the Australian, New Zealand and Canadian dollars and the krone count as commodity currencies, because raw materials make up much of what those countries export.
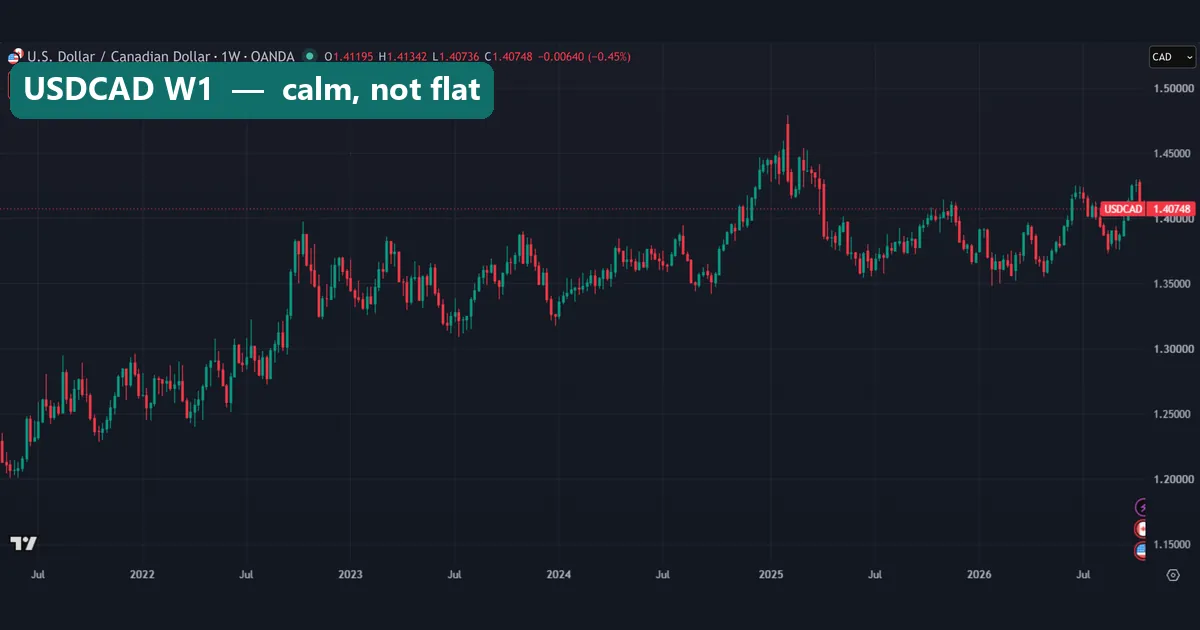
The Canadian dollar was the calmest of the nine at 5.9% a year. Calm is not flat, though. Our USDCAD chart runs from near 1.21 in mid-2021 to a spike above 1.45 early in 2025. The last close was 1.40748, and the loonie lost 9.2% overall.
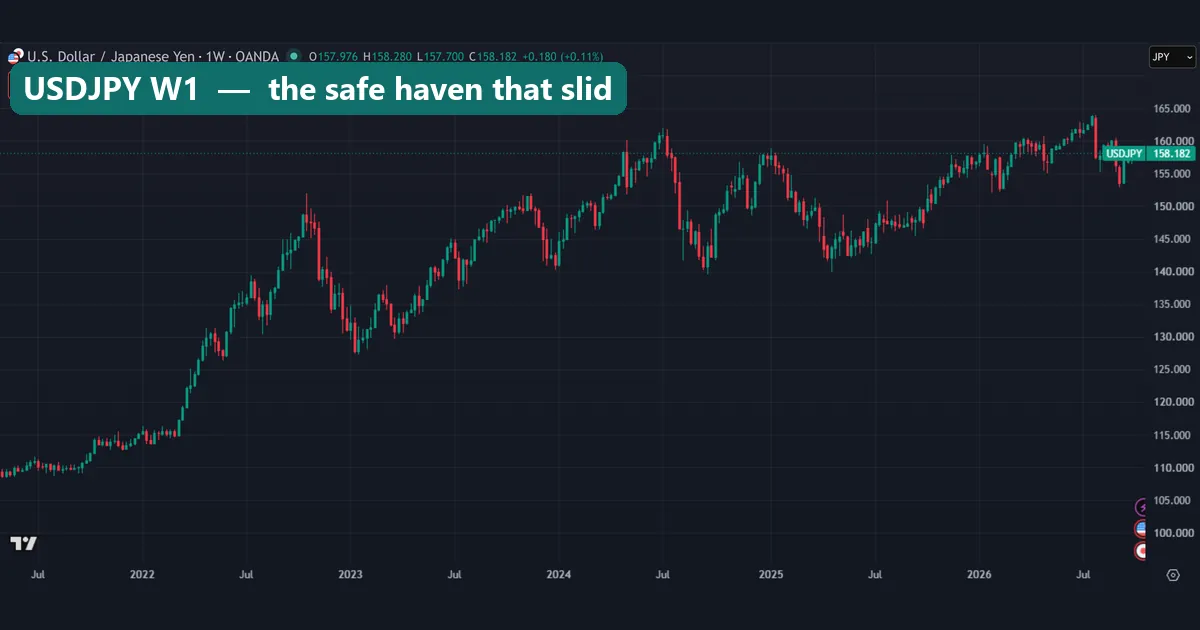
The yen is the bigger surprise. It carries the safe-haven tag, yet it lost the most. USDJPY climbed from near 110 in 2021 to above 160 in mid-2024, then again in July 2026, before a last close of 158.182. One common explanation is the gap between Japanese and US interest rates, the engine of the carry trade. We did not test that cause. The franc, on the other hand, matched its label as the only gainer.
Common mistakes with G10 currencies
1. Reading dollar-first charts upside down. On USDJPY, USDCHF, USDCAD, USDSEK and USDNOK, a rising line means the other currency is getting weaker.
2. Treating percent moves as mirror images. The yen’s 33.8% fall equals a 51% rise in USDJPY, so convert before you compare.
3. Doubling up without noticing. AUD and NZD moved together at 0.87, so two same-way trades act like one big position. The currency strength meter helps you spot one theme driving several pairs.
4. Assuming every G10 pair costs the same. In our shots, USDSEK showed a 30.8-pip spread and USDCAD 1.9 pips. Even after you adjust for price, the krona cost more than twice as much to cross.
Where to go next
Start with the major currency pairs: seven of our nine pairs are majors, but USDSEK and USDNOK are not. Next, see how the dollar index tracks the dollar against other G10 currencies. For bigger swings, try our list of volatile forex pairs.
For a ranking by unit value, read about the most valuable currency in the world. Timing matters too, so check the forex trading sessions. For primary data, use the BIS and Fed sources linked above.
FAQ about G10 currencies
What are the 10 G10 currencies?
The US dollar (USD), euro (EUR), Japanese yen (JPY), British pound (GBP), Swiss franc (CHF), Canadian dollar (CAD), Australian dollar (AUD), New Zealand dollar (NZD), Swedish krona (SEK) and Norwegian krone (NOK).
Why is it called G10 if the group has 11 countries?
The Group of Ten started in 1962 with ten countries. Switzerland joined in 1964, but the name stayed.
Is the Chinese yuan a G10 currency?
No. In the April 2025 BIS survey the renminbi took 8.5% of turnover, more than the franc. But China manages its rate around a daily reference rate, so it stays outside the free-floating G10 group.
Which G10 currency trades the most?
The US dollar. It sat on one side of 89.2% of all trades in April 2025, ahead of the euro at 28.9%.
Which G10 currency gained the most against the dollar since 2021?
Only the Swiss franc gained, by 8.0%, in our weekly data from January 2021 to October 2026. The yen lost the most.
Are G10 currencies the same as the major pairs?
Not quite. The seven majors are EURUSD, GBPUSD, USDJPY, USDCHF, USDCAD, AUDUSD and NZDUSD, so USDSEK and USDNOK miss out.
Which G10 currencies move together?
In our weekly data the Australian and New Zealand dollars scored 0.87, and the euro and krona 0.84. The yen linked least, between 0.30 and 0.60.
Are G10 currencies safer to trade than others?
The larger ones are usually cheaper to trade, but none is safe in value. The yen lost a third of its dollar value in our window. Size every trade for those swings; results are not guaranteed; past performance is not indicative of future results.
Last updated: 19 October 2026.

About the author
Written by Dominic Walsh, a Forex trader and MT4/MT5 indicator, Expert Advisor and script developer. Every tool on forexmt4systems.com is tested on live charts before release and ships with ready-to-use compiled MT4 (.ex4) and MT5 (.ex5) files. Learn more about the trader and developer behind this site.
How we build, test and correct every tool: Editorial & Testing Policy. Trading carries risk; see the disclaimer.