
Macau patacas are the money of Macao, and their value follows the Hong Kong dollar at about 1.03. This guide settles three things. First, how tight that link is, measured over 5,756 days of quotes. Second, what the strange bars on a USD/MOP chart mean, since two features look like a broken peg and are not. Third, why there is so little here for a trader. The short answer: the pataca barely moves, and most of the drama on its chart comes from the data feed.
What Macau patacas actually are
The pataca is Macao’s official currency, and its code is MOP. One pataca splits into 100 avos, according to the Macao Government Tourism Office’s practical info page. Official bodies write Macao, while the TradingView chart header writes Macau. Both names mean the same place.
Banks put the notes into circulation. For example, Bank of China’s page on its Macau notes calls it one of the two note-issuing banks there, and it dates its first issue to 16 October 1995. Like most modern money, the pataca is a fiat currency, so no metal stands behind each note. Instead, a link to another currency does the work.
How the pataca link works
The link is a chain with two parts. Macao ties the pataca to the Hong Kong dollar, and Hong Kong ties its dollar to the US dollar. So the pataca’s dollar rate is inherited.
The first part comes from the Monetary Authority of Macao’s January 2025 stability review. It gives a fixed middle rate of HKD1:MOP1.03 under a currency board arrangement. It also says reserves of MOP232.6 billion at the end of November 2024 fully backed the pataca’s monetary liabilities. And it says Macao’s Base Rate fell in line with Hong Kong’s in 2024, so policy rates follow the anchor. Our page on central bank rate decisions covers the general case.
The second part belongs to Hong Kong. The Hong Kong Monetary Authority’s page on the Linked Exchange Rate System gives a band of HK$7.75 to 7.85 per US dollar, and it dates the system to 17 October 1983. Together they make one formula:
USD/MOP = USD/HKD x 1.03
That formula implies a zone for the pataca. At the bottom, 7.75 x 1.03 gives 7.9825. At the top, 7.85 x 1.03 gives 8.0855. This zone is our arithmetic, not an official band.
How we tested
We pulled FX_IDC:USDMOP and FX_IDC:USDHKD on the TradingView web chart on 3 November 2026, on daily, weekly and monthly bars. The chart header names ICE as the source. Daily USD/MOP bars run from 17 September 2002 to 3 November 2026, and daily USD/HKD bars start on 4 November 2003.
Our main test divides each USD/MOP close by the USD/HKD close on the same date, which leaves 5,756 shared days. We then checked highs and lows on their own, because bad quotes tend to hide there. We ran no trade test, so nothing here includes spread, swap, financing or commission. Our editorial testing policy explains how we treat data like this, and the two line charts below are our own measurement.
The numbers that define the link
| Parameter | Value | Where it comes from |
|---|---|---|
| Currency code and subunit | MOP, 100 avos | Macao tourism office |
| Middle rate | HKD1 = MOP1.03 | Monetary Authority of Macao |
| Tourism office rate | HKD100 = MOP103.20 | Macao tourism office |
| Hong Kong dollar band | 7.75 to 7.85 per US dollar | Hong Kong Monetary Authority |
| Implied USD/MOP zone | 7.9825 to 8.0855 | Our arithmetic |
| USD/MOP closes since 2016 | 7.9781 to 8.0854 | Our bars |
| USD/HKD closes since 2016 | 7.7494 to 7.8499 | Our bars |
| Latest closes, 3 November 2026 | USD/MOP 8.0804, USD/HKD 7.8452 | Our bars |
One row needs a flag. The tourism office adds “an acceptable variation up to 10%” to its rate, and the page does not explain that. We read it as rough guidance for changing cash, not as a policy band, but that reading is ours.
Reading USD/MOP on a chart
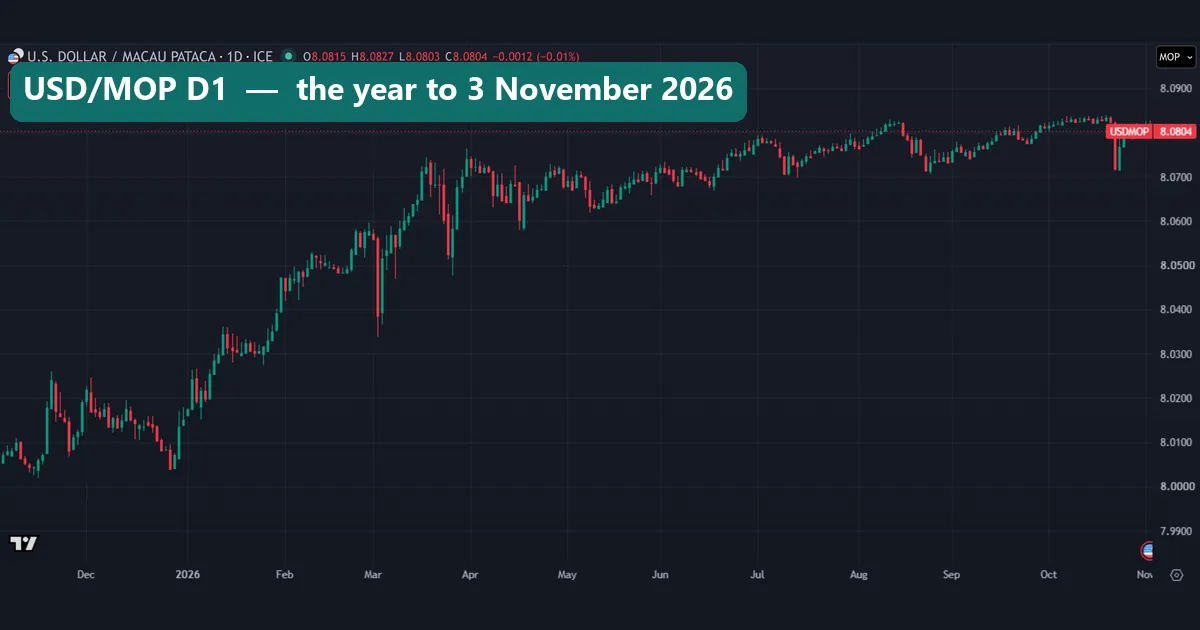
Start with the daily chart at the top of this page. USD/MOP rose from 8.0051 on 3 November 2025 to 8.0804 on 3 November 2026. It looks like a strong trend, but the move is only 0.94%, and the zoomed axis does the rest. Now compare it with USD/HKD.
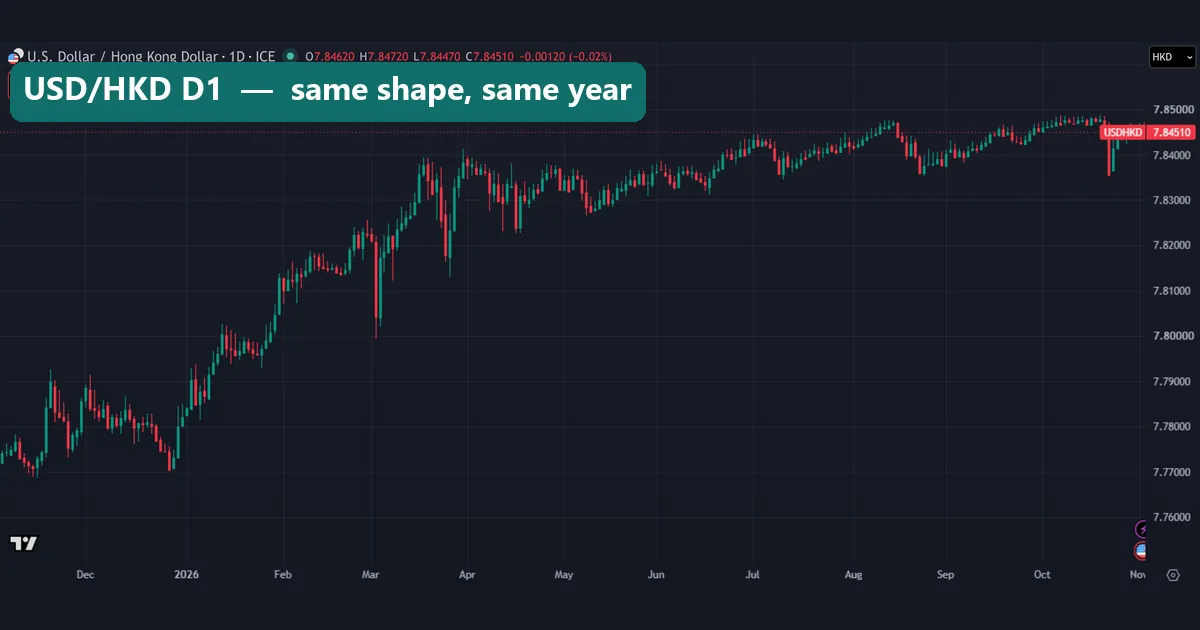
The two shapes match almost bar for bar. USD/HKD rose from 7.7722 to 7.8452, also 0.94%, and the sharp dips line up. On 3 March 2026, USD/MOP closed at 8.0385 and USD/HKD at 7.8042. Then on 22 October 2026, they closed at 8.0719 and 7.8355. Since February 2023, their daily close changes have a correlation of 0.99. So read USD/MOP as a copy of USD/HKD. Our guide on how to read candlestick charts covers the basics.
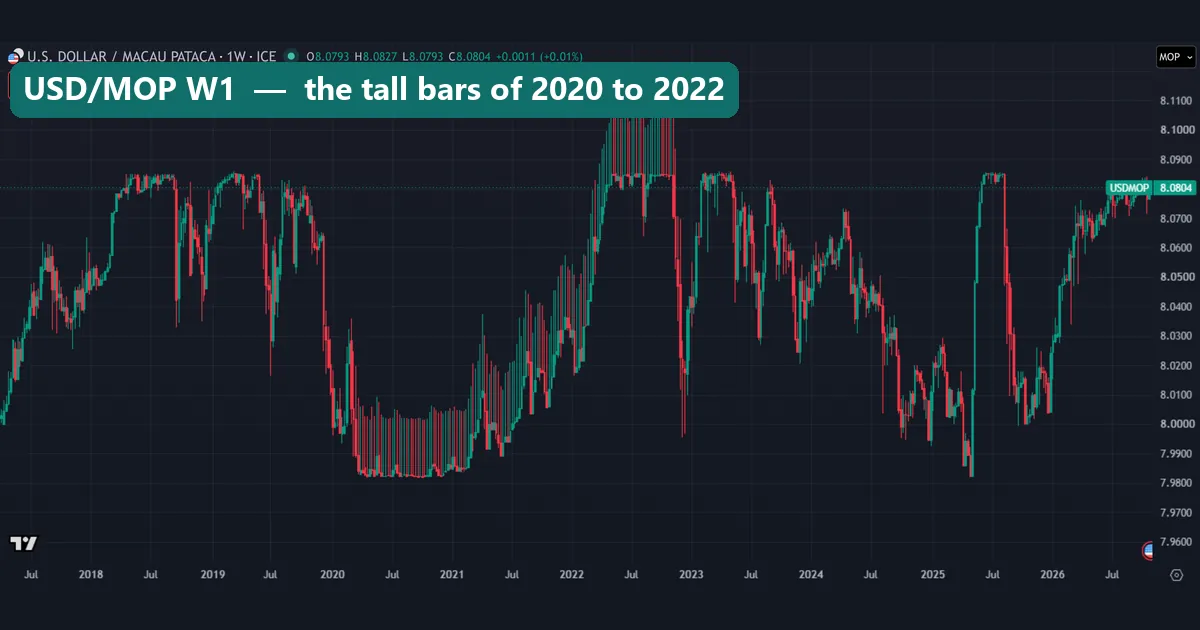
The weekly chart looks different, and it is a trap. From 2020 to late 2022 the bars turn tall and spiky, and in 2022 they reach 8.1051, well above the top of our zone. That looks like a broken link, but it is not.
The tall bars of 2020 to 2022 are a feed artifact
We checked these bars against the daily file, and they behave like a switch. They start on 3 March 2020 and stop on 30 November 2022, as one unbroken stretch. Across those 717 daily bars, the high sat more than 0.012 above the open and close on 89.5% of days. The median gap was 0.0192, and the median gap on the low side was zero. So the bars carry a wick on one side, of nearly the same size, day after day. Real trading rarely looks like that.
Outside that stretch the pattern vanishes. We found it on one of 1,027 bars from March 2016 to the start of March 2020, and on none of 1,024 bars since 1 December 2022. USD/HKD shows nothing similar either. On the same days its median upper wick was 0.00097, about one twentieth the size.
The closes settle it. Take 29 September 2022, the highest bar. USD/MOP printed a high of 8.1051 but closed at 8.0848, while USD/HKD closed at 7.84924. The close ratio is 1.0300, right on the link, but the ratio of the two highs is 1.0325. Through the whole stretch the close ratio stayed between 1.0299 and 1.0303. So this is a quoting artifact in the highs, not a move in the rate. We do not know the cause.
Worked example: rebuilding the pataca from the Hong Kong dollar
Use the closes of 3 November 2026.
- Take USD/HKD at 7.8452.
- Multiply by 1.03, which gives 8.0806.
- Compare that with USD/MOP at 8.0804. The gap is 0.0002, or about 0.002%.
- Now divide the other way: 8.0804 / 7.8452 = 1.02998, which rounds back to 1.03.
Next, turn that into cash. At those quotes, 10,000 patacas come to about US$1,237.56 (10,000 / 8.0804), and to HK$9,708.74 at the middle rate (10,000 / 1.03). At the tourism office figure they make HK$9,689.92, so the choice of rate moves the answer by HK$18.82. These are sums, not prices you would get, since a counter adds its own margin. Our currency converter handles the same kind of sum for other pairs.
What our two data charts show
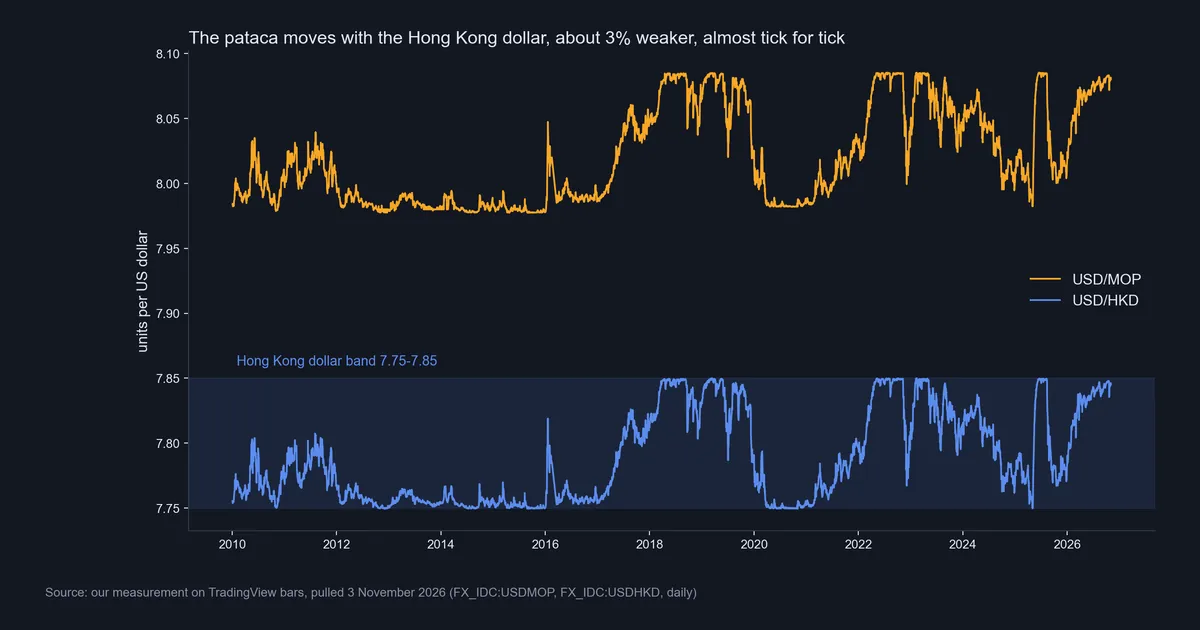
This chart plots both pairs since 2010, with the Hong Kong band shaded. The gap between the lines barely changes, and every swing in blue appears in gold. USD/MOP closes since 2016 span about 1.3% in total. Even the sprint from one edge to the other in 2025 was modest: USD/MOP went from 7.9824 on 2 May to 8.0812 on 5 June, a rise of 1.24%.
One small note on the band. Since 2016, every USD/HKD close sat inside it if you allow 0.001 at each edge. On the exact figures, 78 of 2,827 closes dipped a hair below 7.75, and none went above 7.85.
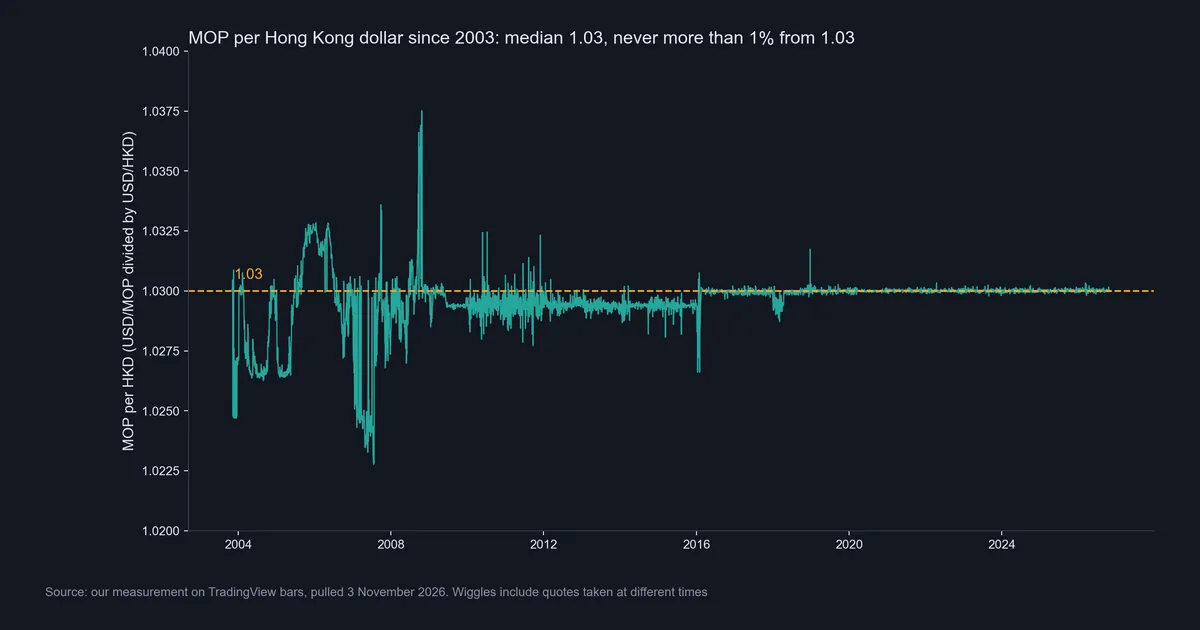
This chart is the ratio since 2003. Its median is 1.03, its range is 1.0228 to 1.0375, and all 5,756 days sit within 1% of 1.03. The early wiggles look alarming, but the scale is tiny, and they include quotes taken at different times. From March 2016 the ratio stays between 1.0287 and 1.0317, and from 2019 between 1.0298 and 1.0303.
We cannot explain one detail. From mid-2009 to early 2016 the ratio sits near 1.0294, and then it steps up to 1.03. We found no official change of rate, so we suspect a change in how the feed quoted it, but that is a guess.
Why there is so little to trade
The median daily range of USD/MOP over the last 750 bars, since 20 December 2023, is 0.044%. At 8.08 that is about 0.0036 of a pataca. Compare that with our list of volatile forex pairs and the gap is obvious. Besides, any view on USD/MOP is really a view on USD/HKD inside its band. A rate trade looks thin too, because rates in Macao follow Hong Kong. Our pages on the carry trade and the interest rate differential explain what you would look for.
A reference quote is also not a price you can trade. The FX_IDC line shows where quotes sat, and nobody has promised to fill an order there. A real deal would run over the counter at a dealer’s price, with a spread that could swallow a day’s range.
Download the complete indicator database
Put these concepts on your charts. One email unlocks the full library of 1,380+ indicators with compiled MT4 and MT5 files, plus my TradingView scripts. No paywall, no spam, unsubscribe any time.
Get free access to my indicator database
One email unlocks 1,380+ free MT4, MT5 and TradingView indicators — the complete library. No single-tool download; you get the whole database.
Where it fails
A peg holds until it does not. We saw no break in our window, but that does not rule one out, and we make no forecast.
- It rests on a decision. The tourism office page says the link exists “by the decision of the Government”. A decision can change.
- The chain has two parts. A change to Hong Kong’s system would pass straight into USD/MOP, even with the 1.03 link intact.
- Quotes are not counter rates. Street and bank rates can differ from the feed.
- The feed has errors. Any test built on USD/MOP highs or lows from March 2020 to November 2022 will go wrong, including range tools and stop tests.
- Our history is short on one side. USD/HKD starts in November 2003, so the ratio cannot test anything earlier.
The long view: weekly Hong Kong dollar, monthly pataca
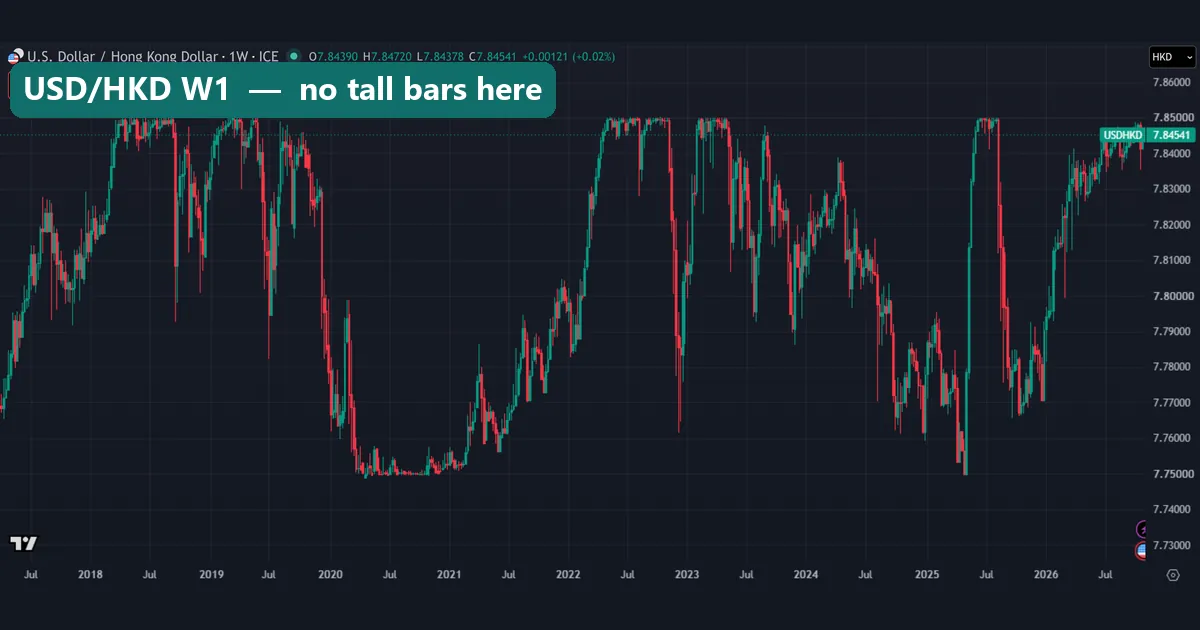
This is USD/HKD on weekly bars over the same years as the USD/MOP weekly chart, and it has no tall bars from 2020 to 2022. From May 2020 to January 2021 it sits flat near 7.75, while USD/MOP shows a row of spikes above closes near 7.98. That side-by-side view is the quickest way to see the artifact.
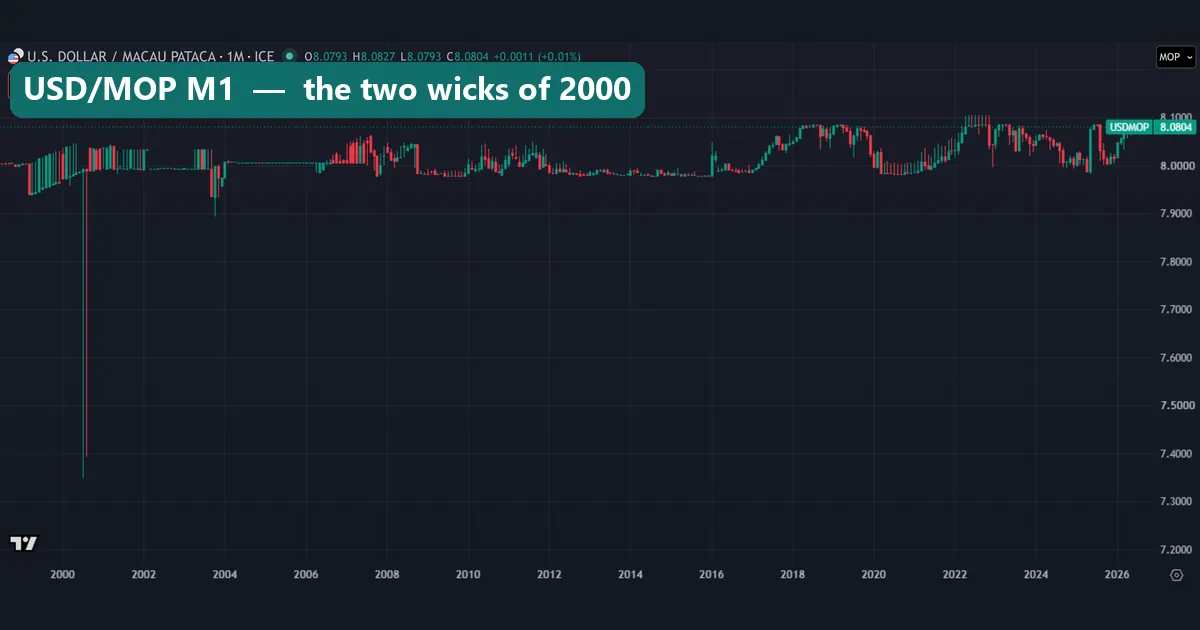
The monthly chart holds the ugliest print. Two long lower wicks hang below the line in mid-2000: July reaches 7.3485 and August reaches 7.394. At face value that is a fall of 7% to 8% and back. The weekly bars say otherwise. The week of 10 July 2000 opened and closed at 7.989, and the week of 21 August 2000 opened at 7.991 and closed at 7.993. Both months closed near 7.99.
So we read these as bad prints in the feed, not as a break. We found no primary source for a break in 2000. The Monetary Authority’s 2025 review calls the link steadfast, although it does not discuss that year. We cannot test further, because our daily bars start in 2002.
The tall bars before 2004 look like the same problem: in April 2003, daily closes flip between 7.993 and 8.033. The dip of autumn 2003 is different, since daily closes reach 7.893 on 3 October and stay low for weeks. Most of it falls before our USD/HKD history starts, so we leave it unexplained.
Common mistakes with Macau patacas
- Reading the 2022 highs as a broken link. Check the closes first: none since 2016 went above 8.0854.
- Treating the 2000 wicks as a crash. Both weeks closed within 0.002 of where they opened.
- Quoting chart boxes as prices. The O/H/L/C row and the SELL and BUY boxes show the live quote on capture day, not the bars on screen. Neither one is a rate you can deal at.
- Trading the zoom. A daily chart can make 0.94% in a year look like a strong trend. Check the axis first, and then check USD/HKD.
Where to go next
Bulgaria’s lev ran a similar fixed link to the euro until the euro replaced it in January 2026, and our BGN currency guide tells that story. For money with no such anchor, see our guide to the weakest currency in the world.
The other end of the chain is the US dollar, so our page on the dollar index in forex helps there. Finally, to judge how far to trust a feed, read our guide to real-time data on TradingView.
FAQ about Macau patacas
What is the currency code for Macau patacas?
The code is MOP, and one pataca splits into 100 avos.
How many patacas are there to a Hong Kong dollar?
The Monetary Authority of Macao gives a middle rate of 1.03, and the tourism office quotes 103.20 per HKD100.
How many patacas are there to a US dollar?
The last close in our data was 8.0804 on 3 November 2026. Since 2016, closes have run from 7.9781 to 8.0854. Check a live source before you change money.
Is the pataca pegged to the US dollar?
Not directly. It links to the Hong Kong dollar, and that links to the US dollar inside a 7.75 to 7.85 band.
Did the link break in 2000 or 2022?
Our bars do not show that. The 2000 wicks closed back near 7.99, and the 2022 highs came with closes near 8.085. We read both as feed problems.
Do shops in Macao take Hong Kong dollars?
We cannot say. The tourism office page does not cover that, so we make no claim. It does say banks and money changers are easy to find.
Is USD/MOP worth trading?
We see little reason. The median daily range is 0.044%, and any view is really a view on USD/HKD. We ran no trade test, so this is a reading of the ranges.
Will the 1.03 link last?
We cannot say, and we make no forecast. It has held in every close we can test, but it rests on policy, and policy can change. Treat our numbers as a record of the past: results are not guaranteed; past performance is not indicative of future results.
Last updated: 3 November 2026.

About the author
Written by Dominic Walsh, a Forex trader and MT4/MT5 indicator, Expert Advisor and script developer. Every tool on forexmt4systems.com is tested on live charts before release and ships with ready-to-use compiled MT4 (.ex4) and MT5 (.ex5) files. Learn more about the trader and developer behind this site.
How we build, test and correct every tool: Editorial & Testing Policy. Trading carries risk; see the disclaimer.