
Sri Lanka rupees lost 98.0% of their dollar value between January 1973 and 3 November 2026. One US dollar bought 6.7114 rupees at the start of that window and 332.583 at the end. The largest single month on our record is November 1977, when the quote jumped 87.6%, from 8.5985 to 16.129. The modern break came in March and April 2022, which took it from 201.05 to 345.48. This guide settles what the rupee is, why its chart lay flat and then broke, how much came back, and which numbers you can trust.
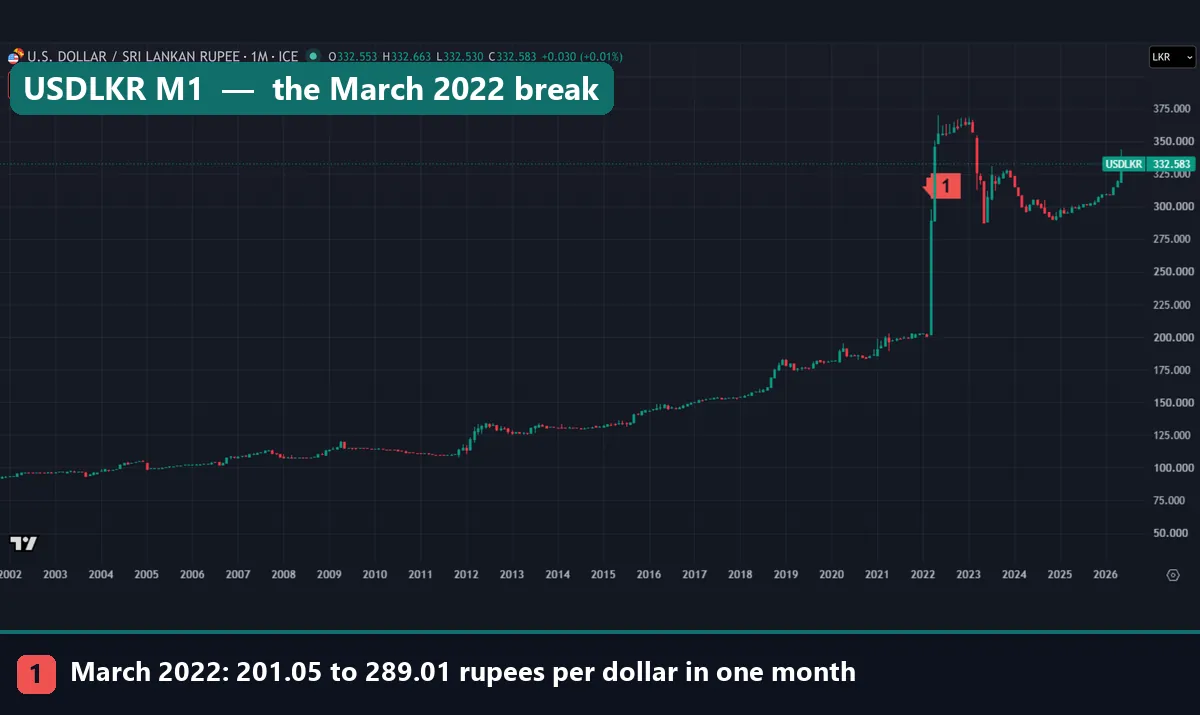
The monthly line creeps up for two decades, then shoots almost straight up. Marker 1 is March 2022, which closed at 289.01 after February’s 201.05. One warning covers every capture here: the top row, the SELL and BUY boxes and the dotted 332.583 line show the quote on capture day, not the bars in view.
What Sri Lanka rupees are
The Sri Lanka rupee is the national money of Sri Lanka. Its code is LKR, its numeric code is 144, and it carries two decimal places. All three come from SIX’s ISO 4217 currency code lists, published by the standard’s maintenance agency.
The name causes mix-ups. India, Pakistan, Nepal, Mauritius and the Seychelles also use rupees, and the same list gives each one its own code. So an LKR rate tells you nothing about the Indian rupee (INR).
Like most modern money, the rupee is a fiat currency: policy and public trust stand behind it, not a claim on metal. It also trades over the counter, between banks and dealers, so no single exchange prints one official last price.
How the USD/LKR quote works
Charts show the pair as USDLKR: the number of rupees one US dollar buys. A rising chart therefore means a weaker rupee, and a falling chart means a stronger one. To see the rupee’s own value, turn the quote over.
US cents per rupee         = 100 / USDLKR
more rupees per dollar (%) = (new quote / old quote - 1) x 100
change in rupee value (%)  = (old quote / new quote - 1) x 100
The last two lines give different answers for one move, and March 2022 shows how far apart they can sit. The quote rose 43.8%, from 201.05 to 289.01. However, one rupee lost 30.4% of its dollar value, falling from 0.497 US cents to 0.346. Both figures are right, since each answers a different question. In this guide, “value” always means the last line.
Why the line stayed flat: a managed rate
A freely floating pair wobbles every day. This one barely moved for months, because the authorities held it. The IMF’s 2023 staff report on Sri Lanka says the rate was “effectively fixed from April 2021”. The Central Bank of Sri Lanka’s Annual Report 2022, chapter 5 names the tools: intervention in the currency market and “moral suasion”. Together they kept the rupee at Rs.200-203 per dollar in early 2022.
Moral suasion means pressure without a formal rule: the central bank leans on dealers, and they fall in line. Our page on whether central banks trade forex covers the general mechanics. Holding a price this way has a cost, though, because a shortage of dollars has to show up somewhere.
In Sri Lanka it showed up twice. First, the IMF says usable reserves fell from $7.6 billion at the end of 2019 to $1.6 billion at the end of 2021, less than one month of imports. Second, the central bank reports a “widening spread” between the official rate and the “grey market rate”. So the flat line never meant calm. It meant a held price with pressure building behind it.
How we tested
We read FX_IDC:USDLKR, an ICE reference series, on the TradingView web chart and pulled the bars on 3 November 2026. Our monthly window runs from January 1973 to November 2026, and daily bars run from 6 January 2003 to 3 November 2026. We also captured weekly charts. If the platform is new to you, our TradingView chart guide covers the basics.
Next we checked the data. Any daily print more than 12% from its 11-day median would count as an error, and none failed. We also checked every price we quote against our stored bars.
Our MetaTrader 4 history (Capital Point Trading, build 1471) holds 23 FX pairs, and none is a rupee pair, so MT4 played no part. We placed no trades either, so every figure is a price change before spread, swap, financing and commission. Our editorial testing policy explains how we report numbers like these.
Measurement settings
| Setting | What we used |
|---|---|
| Data source | FX_IDC (ICE) on the TradingView web chart |
| Symbol | USDLKR: rupees per 1 US dollar |
| Monthly window | January 1973 to November 2026 |
| Daily bars | 6 January 2003 to 3 November 2026 |
| Weekly captures | Ending January 2024 and November 2026 |
| Yearly change | Year-end close to year-end close; 2026 to date |
| Costs | None modelled; no trades placed |
Monthly moves run close to close, so March 2022 starts from February’s 201.05, not March’s first print of 202.25.
Reading the chart: a shelf, a break, a second shelf
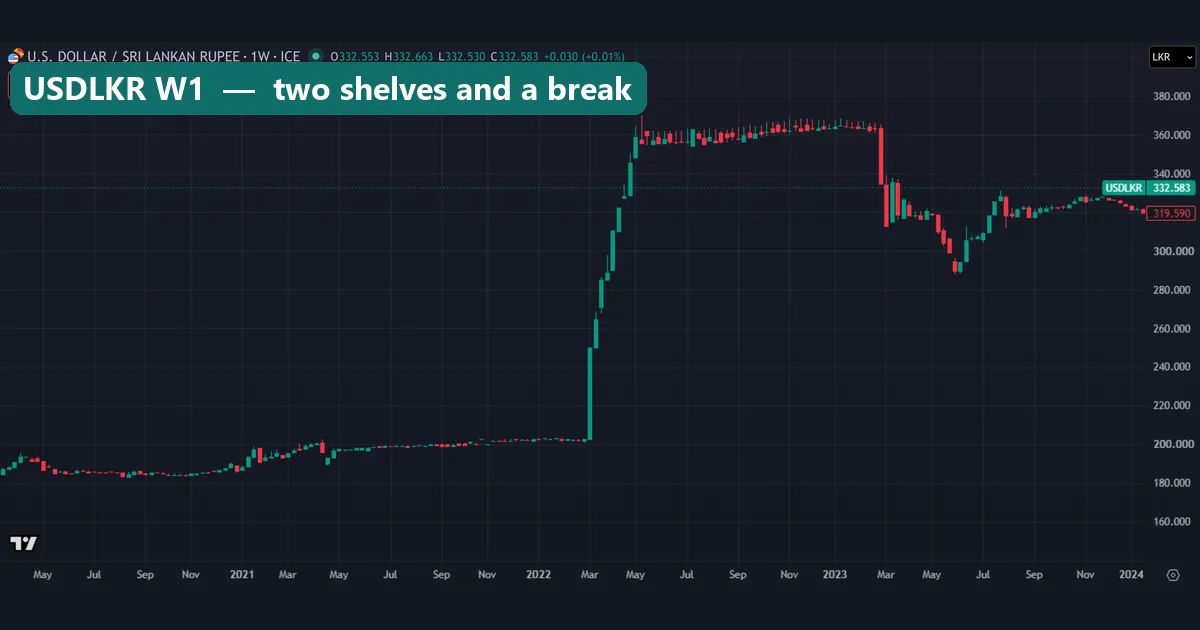
This weekly capture runs from spring 2020 to January 2024. After a jolt in April 2021, the candles shrink to a thin shelf near 200. Our daily closes from May 2021 to 7 March 2022 stayed between 196.79 and 202.96, and the 2022 part sits inside the bank’s Rs.200-203. Then the tall green bars of March and April 2022 appear. After that the chart goes flat again near 360, until a sharp drop in March 2023.
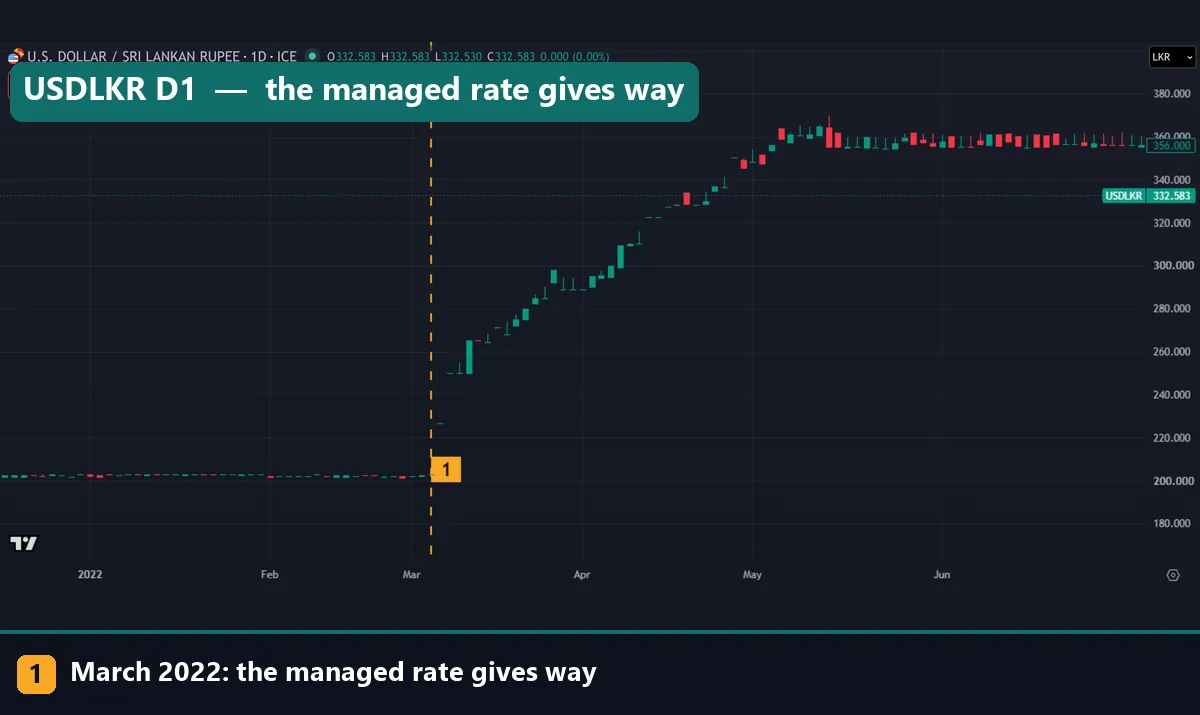
The daily capture shows the break up close. Marker 1 sits on 7 March 2022, when the close was 202.74. The next print came on 9 March at 226.83, a jump of 11.9% in one step, and the next came on 11 March at 250.08. Our bars hold nothing for 8 or 10 March, which is why you see dashes and gaps instead of a smooth climb.
Now find the tallest wick, in mid-May. That is 13 May 2022: high 370.17, close 355.47. On the same day, the central bank began announcing a middle rate with a variation margin on either side. The candles then stay in a narrow band. The weakest daily close, 365.44, came later, on 10 January 2023.
What the official record says about 2022
We take causes only from the central bank and the IMF, and we add no theories of our own.
- 2019 to 2020: income tax and VAT cuts cost more than 2% of GDP in revenue, and Sri Lanka lost access to international capital markets (IMF).
- Early 2022: the war in Ukraine hit hard, given heavy reliance on tourism and energy (IMF).
- Early March 2022: the Monetary Board allowed a “measured adjustment”. A “large overshooting” followed, and the rupee fell 41.4% by the end of April (central bank).
- April and May 2022: liquid reserves fell to “almost zero” (central bank). The authorities suspended external debt service on 12 April, then formally defaulted on international bonds on 18 May (IMF).
- September 2022: inflation peaked at 70% (IMF). Our page on how inflation affects forex covers the general link.
- March 2023: the guidance band ended on 7 March (central bank), and the IMF board approved an arrangement of about $3 billion that month.
Our numbers sit close to theirs. The bank puts the rupee’s 2022 fall at 44.8%, and ours is 44.2%. It gives Rs. 327.29 for the end of March 2023, and our close is 326.49. Different rate sources can produce small gaps like these, so treat any single figure as close, not exact.
Worked example: LKR 100,000 in US dollars
Take a round LKR 100,000 and divide it by the quote on each key date. The sum is our illustration, and no fees are in it.
| Close on | Rupees per dollar | LKR 100,000 in dollars |
|---|---|---|
| 28 February 2022 | 201.05 | $497.39 |
| 31 March 2022 | 289.01 | $346.01 |
| 29 April 2022 | 345.48 | $289.45 |
| 10 January 2023 | 365.44 | $273.64 |
| 31 May 2023 | 287.87 | $347.38 |
| 3 November 2026 | 332.583 | $300.68 |
The same rupees went from $497.39 to $273.64, a 45.0% fall in under a year. Getting back from there takes an 81.8% gain, because a loss and an equal gain do not cancel.
From 365.44 to 287.87 the rupee gained 26.9% in under five months, which sounds like a full recovery. Yet that best close still left it 30.2% below its end-February 2022 value. On 3 November 2026 the gap is 39.5%.
The rupee year by year, and since 1973
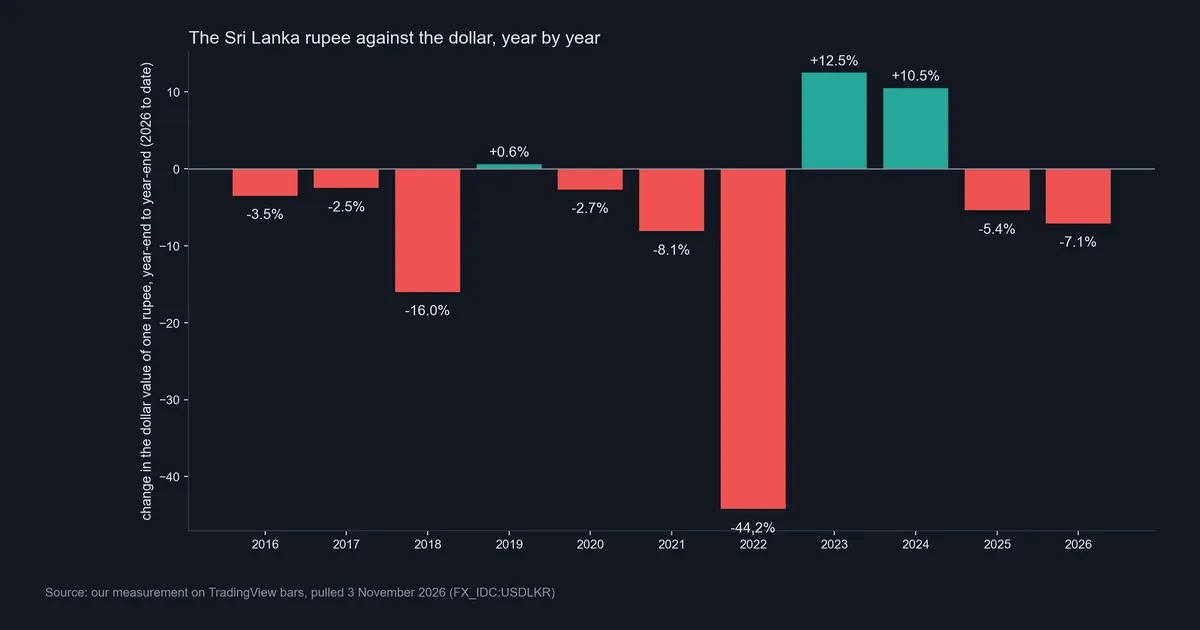
Each bar shows the change in the dollar value of one rupee, from one year-end to the next. Recent years read: 2021 -8.1%, 2022 -44.2%, 2023 +12.5%, 2024 +10.5%, 2025 -5.4%, and 2026 so far -7.1%. Only three of the eleven bars are gains, and one of those is just +0.6% in 2019.
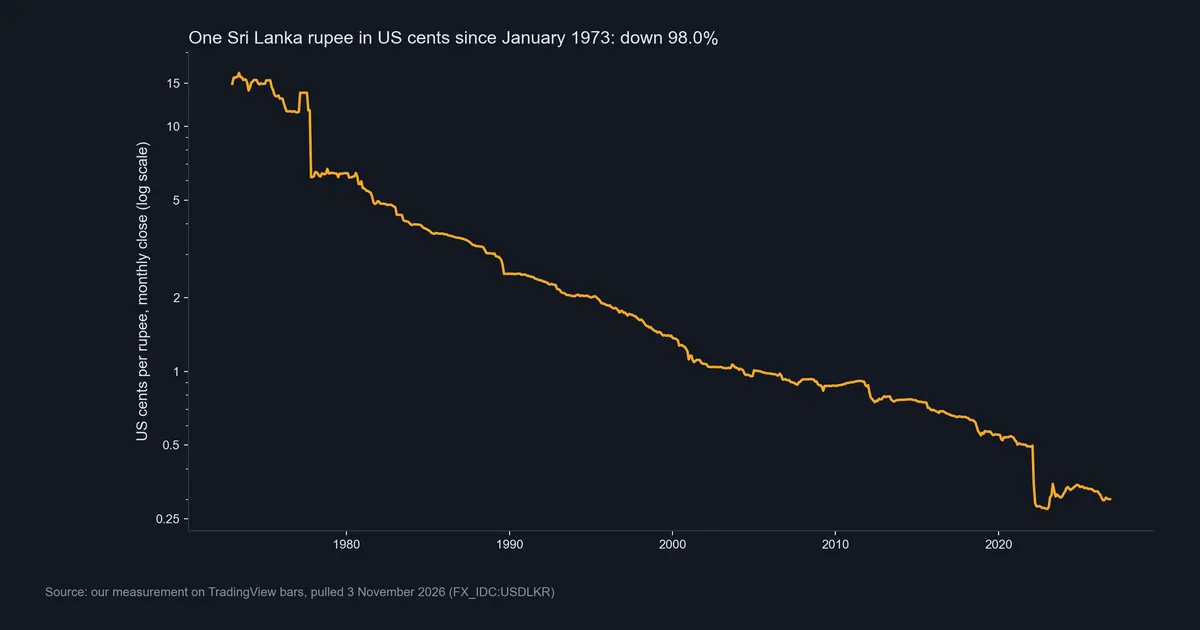
This line shows one rupee in US cents on a log scale, where equal distances mean equal percentage falls. One rupee went from about 14.90 cents in January 1973 to about 0.50 before the 2022 crisis, a fall of 96.7% over 49 years. Two cliffs stand out, yet from November 1977 to February 2022 the quote also slid from 16.129 to 201.05, a further 92.0% loss of value. So the breaks are the famous part, but the long slide covers the most ground on this scale.
November 1977: the largest month on our record
November 1977 is the largest single month in our data, and March 2022 comes second. The quote went from 8.5985 to 16.129, up 87.6%, so one rupee lost 46.7% of its dollar value. A 2017 speech by the central bank’s Senior Deputy Governor, hosted by the BIS, gives the cause. On 15 November 1977, Sri Lanka unified its dual exchange rates at an initial Rs. 16 per dollar, then let the rupee float under a managed regime. It was part of a wider opening of trade and payments, so this was a deliberate reset, not a market panic.
The speech calls it an overnight devaluation of the basic rate by 120 per cent. Our bars show 7.2993 before the September rise, and Rs. 16 from there is about 119%, so the two figures look like different starting points. That figure covers the basic rate only, so deals at the other rate in the dual system saw a different change.
Treat these early bars as rough, because they are monthly reference quotes from one feed. For example, the speech gives Rs. 15.56 for the end of 1977, while our December bar still shows 16.129. We report the smaller March and September 1977 moves as price only.
Download the complete indicator database
Put these concepts on your charts. One email unlocks the full library of 1,380+ indicators with compiled MT4 and MT5 files, plus my TradingView scripts. No paywall, no spam, unsubscribe any time.
Get free access to my indicator database
One email unlocks 1,380+ free MT4, MT5 and TradingView indicators — the complete library. No single-tool download; you get the whole database.
Where it fails: what this chart cannot tell you
It is not a price you can deal at. FX_IDC is a reference series. A bank, a money changer and a transfer firm each quote their own rate, with their own spread. In 2022 the central bank itself reported “large differences” between rates from banks and money changers. So when you budget, use the rate you are actually offered.
A managed stretch hides risk. From May 2021 to March 2022 a volatility tool would have read the bars as quiet, and then one step moved 11.9%. Likewise, closes from June 2022 to February 2023 stayed between 354.77 and 365.44. The IMF calls that rate “effectively pegged”, and the central bank says an “inactive spot market” largely explained the stability. Those bars measure policy and thin trade, not free price discovery.
Thin data can mislead. On 22 May 2026 the series shows a high of 343.96 and a close of 332.05. The bar alone cannot say how much real dealing took place at those levels.
One pair mixes two stories. The central bank shows the 2022 fall at 44.8% against the dollar, but 41.4% against the euro and 36.4% against the yen. So dollar strength explains part of that figure, and our page on the dollar index covers that side.
The causes have gaps. Our linked sources cover November 1977 and the years from 2019 to March 2023. Elsewhere we report price only, and nothing here predicts the next move.
The latest stretch: late 2025 to now
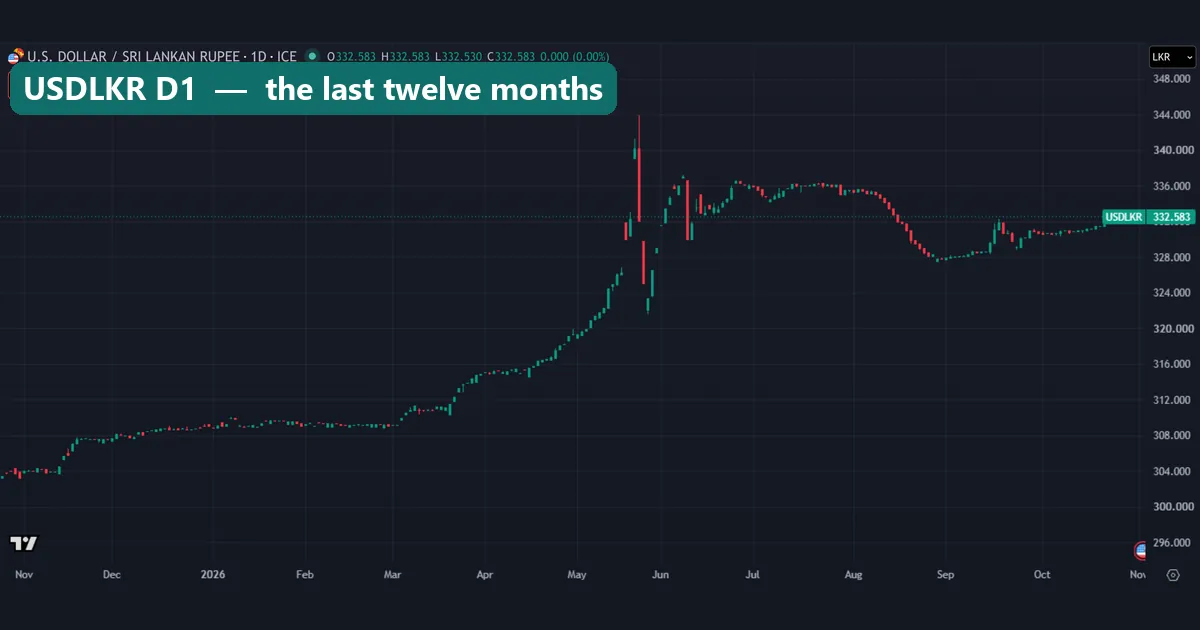
This daily capture covers the last twelve months. The quote climbs gently from about 304 in November 2025 to 309.05 at the end of the year, then rests near 309 until March 2026. May 2026 is the messy part: closes ran from 319.33 on 4 May to 340.18 on 21 May, then back to 323.40 on 26 May. We found no primary source we could link for those days, so we offer no cause. By 31 August the close was 327.73.
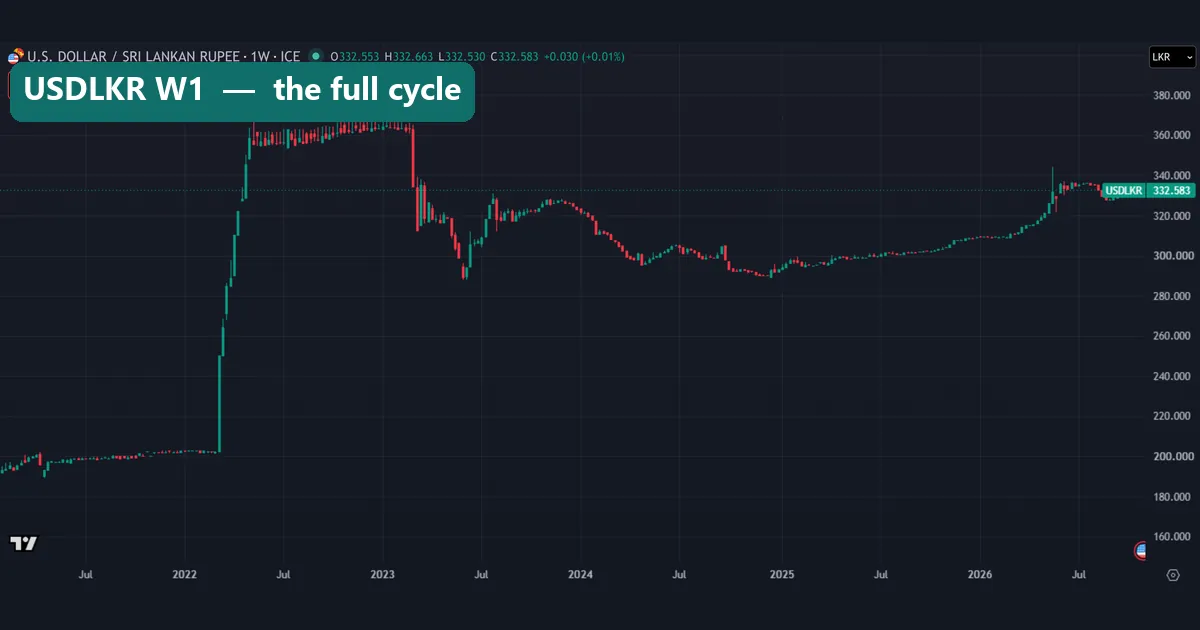
The weekly capture adds context. You can see the shelf near 200, the climb, the shelf near 360, and then two lows near 290: 287.87 on 31 May 2023 and 289.73 on 12 December 2024. We do not call that level support, since two touches on a thin reference series prove little. From the 2023 low to today’s quote the rupee has lost 13.4% of its dollar value. That is a snapshot, not a call.
Common mistakes with rupee quotes
Mistake 1: reading a rising chart as a stronger rupee. USDLKR counts rupees per dollar. When the line rises, each rupee buys less.
Mistake 2: swapping the two percentages. A 43.8% rise in the quote is not a 43.8% fall in the rupee. In March 2022 the rupee’s loss was 30.4%, and the difference grows with the size of the move.
Mistake 3: judging strength by the size of the number. One rupee at 0.30 US cents looks tiny, but unit size alone says little, as our guide to the most valuable currency in the world explains.
Mistake 4: measuring from the wick. The highest daily print is 370.17, yet that day closed at 355.47. The weakest close is 365.44, so a fall measured from the wick comes out too large.
Where to go next
To check the live quote, search for FX_IDC:USDLKR on TradingView, which carries the same reference data.
For other long falls, start with our African currencies guide. Then read our GHC currency guide for a similar slide with a change of unit in it, and the Egyptian pound guide for flat stretches followed by sudden steps. Our BGN currency guide shows a formal peg instead of an informal one. Finally, the guide to the weakest currency in the world takes up low value per unit.
FAQ about Sri Lanka rupees
What is the currency code for Sri Lanka rupees?
The code is LKR, with numeric code 144 and two decimal places, according to the ISO 4217 list.
How many Sri Lanka rupees does one US dollar buy?
On 3 November 2026 one dollar bought 332.583 rupees on FX_IDC. That is a reference quote, so a bank or money changer can differ.
How much is one Sri Lanka rupee worth in US dollars?
About 0.30 US cents on 3 November 2026. So LKR 100,000 came to about $300.68 before any fees.
Is the Sri Lanka rupee the same as the Indian rupee?
No. They share a name only. Sri Lanka’s code is LKR, and India’s is INR.
Why did the rupee fall so fast in 2022?
The IMF and the central bank describe a held rate, depleted reserves and a dollar shortage. When the authorities let the rate move in early March, it overshot.
Has the rupee recovered since 2022?
Partly. It gained 12.5% in 2023 and 10.5% in 2024, then lost 5.4% in 2025 and 7.1% so far in 2026. It now sits 39.5% below its end-February 2022 value.
Is the Sri Lanka rupee still pegged?
The central bank removed its guidance band on 7 March 2023. Our sources do not describe today’s policy in detail, so check with the central bank directly.
Will the Sri Lanka rupee get stronger or weaker?
Our data cannot say, and we make no forecast. It shows a long decline, a crash and a partial rebound. Nothing here is advice, and results are not guaranteed; past performance is not indicative of future results.
Last updated: 3 November 2026.

About the author
Written by Dominic Walsh, a Forex trader and MT4/MT5 indicator, Expert Advisor and script developer. Every tool on forexmt4systems.com is tested on live charts before release and ships with ready-to-use compiled MT4 (.ex4) and MT5 (.ex5) files. Learn more about the trader and developer behind this site.
How we build, test and correct every tool: Editorial & Testing Policy. Trading carries risk; see the disclaimer.