
Typical price is the average of a bar’s high, low and close, written as (H + L + C) / 3. It feeds the CCI, the classic pivot point and VWAP, so many traders use it without ever plotting it. This guide settles what it is, how far it sits from the close, and whether using it changes any result. We measured it on 24 symbols in MetaTrader 4. The short answer: it differs from the close on almost every bar, yet its 20-bar average draws nearly the same line as the close’s.
What typical price actually is
Each bar records four prices: open, high, low and close. Typical price drops the open and gives equal weight to the other three. The result is one number per bar, and it always sits inside the bar’s range. On a daily chart it is a rough centre of the day.
MetaTrader names it PRICE_TYPICAL. The MQL4 reference’s price constants page lists it as value 5, with the formula (high + low + close)/3. MetaTrader 5 uses the same names. TradingView calls the same number hlc3, and you can see that label on every chart here.
Two relatives sit on the same MetaTrader list. Median price, PRICE_MEDIAN, is (H + L) / 2, the midpoint of the bar. Weighted close, PRICE_WEIGHTED, is (H + L + 2C) / 4, so it counts the close twice. So median price ignores the close, typical price gives it a third of the weight, and weighted close gives it half.
Also, it is a calculation, not a quote, and it keeps moving until the bar closes. A line chart works the same way, only from the close alone.
How typical price works, and how far it sits from the close
typical price  = (high + low + close) / 3
median price   = (high + low) / 2
weighted close = (high + low + 2 x close) / 4
gap            = |typical price - close|
A little algebra shows what the gap depends on. Typical price minus close equals (high + low – 2 x close) / 3. So the gap is zero when the close sits at the midpoint of the bar. It peaks when the close sits at the high or the low, and then it equals one third of the range. It can never go past that.
The sign follows the same logic. When the close sits in the lower half of the bar, typical price is above it, and the reverse in the upper half. In short, typical price leans toward the middle of the bar, and the candle’s wicks decide how far.
That is why it pairs well with range-based tools. For example, the CCI takes the latest typical price, subtracts its 20-bar average, then divides by 0.015 times the mean deviation. A pivot point starts from the prior period’s typical price. VWAP weights each bar’s typical price by its volume. Our guide to what the CCI indicator is walks through the CCI side.
How we tested
We read the history files of a Capital Point Trading terminal, MetaTrader 4, build 1471. The daily set covers 23 FX pairs plus gold, 37,958 bars in all. Dates vary by symbol. The six USD majors and EUR/GBP start on 19 May 2020. The oldest crosses start in June or July 2018, eight others in November 2019. AUD/CAD and NZD/CAD start in June 2025, and gold only in December 2025.
That terminal has been offline since late August 2026, so every window ends between late May and late August 2026. The hourly set covers EUR/USD, GBP/USD and USD/JPY from 22 December 2025, plus gold from 1 July 2025. That adds 18,827 bars, ending between 13 and 26 August 2026.
For each bar we measured the gap between typical price and close, then compared a 20-bar simple average of each. We also ran CCI(20) on typical price, and checked whether the next bar’s range contained the prior bar’s typical price. A median “across symbols” is the middle of the per-symbol results.
The chart pictures come from the TradingView web chart with OANDA data, captured on 6 November 2026, when bars dated 6 November were still forming. We checked every price we quote against our stored OANDA bars. All figures come before spread, swap and commission. Our method is in the editorial testing policy.
Typical price settings in MetaTrader and TradingView
Typical price has no period of its own. Instead, the choices sit in the tools that use it.
| Setting | Value | Where it appears |
|---|---|---|
| Typical price | (H + L + C) / 3 | PRICE_TYPICAL in MetaTrader, hlc3 on TradingView |
| Median price | (H + L) / 2 | PRICE_MEDIAN in MetaTrader, hl2 on TradingView |
| Weighted close | (H + L + 2C) / 4 | PRICE_WEIGHTED in MetaTrader |
| Average test | 20-bar simple average of the close, and of typical price | Our average comparison |
| CCI | 20 bars, constant 0.015, on typical price | Our CCI count and chart panes |
| CCI bands | +/-100, then +/-200 | Our “inside” and “beyond” counts |
| Pivot P | Prior period’s typical price | Pivot Points Standard, Traditional |
| Traded through | Next bar’s range contains the prior bar’s typical price | Our level test |
| VWAP source | hlc3 by default | TradingView VWAP, session anchor |
In MetaTrader 4, Typical Price is an entry in the Moving Average’s “Apply to” list. On TradingView, you pick hlc3 in the Source box.
Reading CCI on a chart
You rarely see typical price as a line of its own. Instead, you see what other tools build from it.
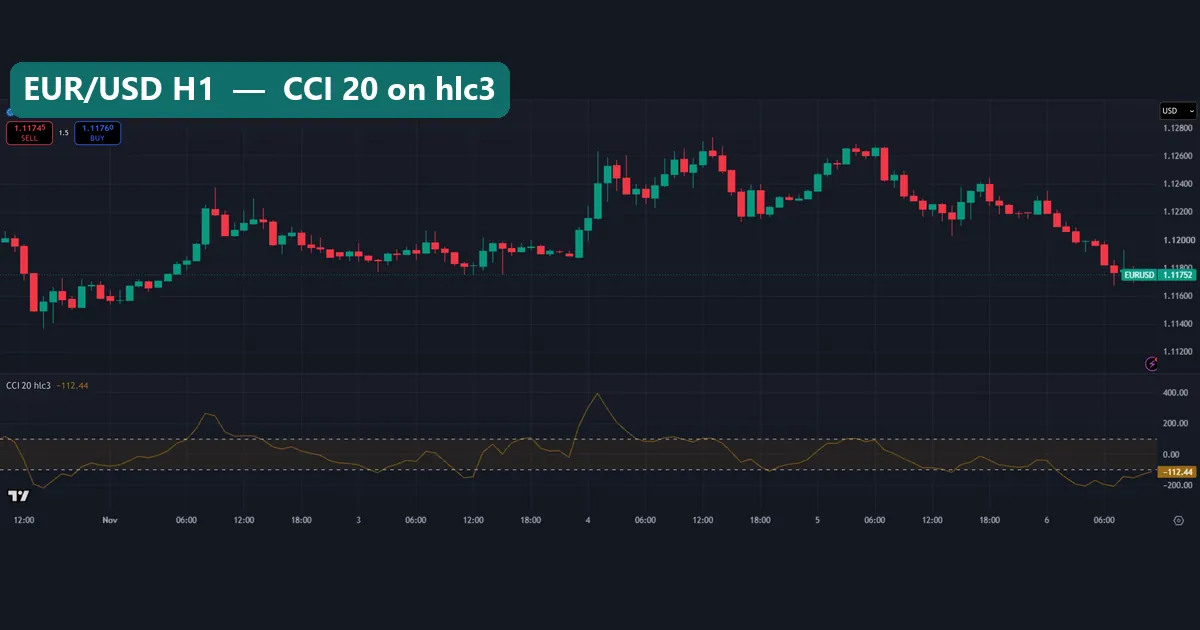
This is EUR/USD on the hourly chart, over the five trading days to 6 November 2026. CCI(20) on hlc3 sits below, and the dashed lines mark +100 and -100. Most of the time the line stays between them or near them. Early on 4 November, though, EUR/USD jumped, and CCI ran up close to +400.
That spike says one thing only: the hour’s typical price sat far above its 20-hour average. It says nothing about whether the move would last, and price gave back part of it later that week. For the trading side, see how to use the CCI indicator.
Reading pivot levels on a chart
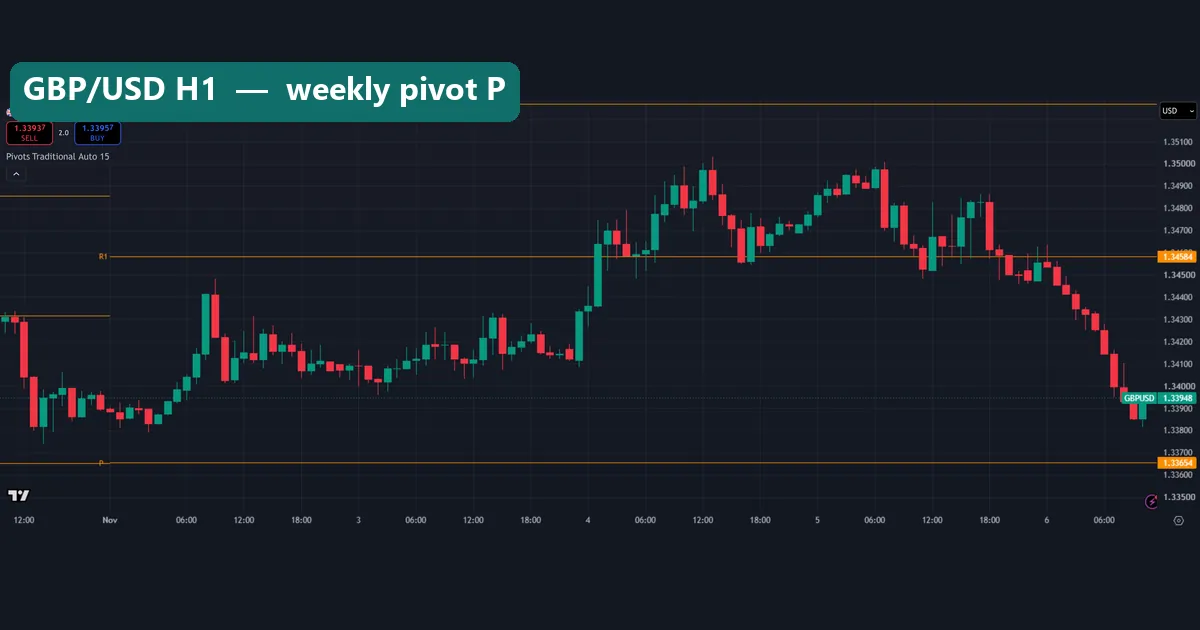
This is GBP/USD hourly with TradingView’s Pivot Points Standard, Traditional type. On an hourly chart its Auto setting drew weekly levels, so P holds one value for the week that began on 2 November. P reads 1.33654 and R1 reads 1.34584. We rebuilt both from OANDA’s hourly bars for 26 to 30 October, and they match to the last digit.
The pivot point entry on Wikipedia gives the most common form as the average of the prior period’s high, low and close. So P is typical price under another name.
Then notice what price did. GBP/USD traded above R1 on 4 and 5 November, yet up to the capture it never came back to P. So the prior week’s typical price acted as a reference, not a wall or a magnet. Our pivot points explainer covers the other levels.
Worked example: two EUR/USD days and a GBP/USD pivot
Start with OANDA’s EUR/USD daily bar for 19 August 2026, the tall up day on our data chart below. It reads high 1.16792, low 1.15702 and close 1.16774.
- Typical price: (1.16792 + 1.15702 + 1.16774) / 3 = 1.16423.
- Median price: (1.16792 + 1.15702) / 2 = 1.16247.
- Weighted close: (1.16792 + 1.15702 + 2 x 1.16774) / 4 = 1.165105.
- Gap to the close: 1.16774 – 1.16423 = 35.1 pips, on a range of 109.0 pips. That is 32.2% of the range, near the one-third ceiling, because the day closed near its high.
Now take 4 November 2026: high 1.12731, low 1.11865, close 1.12289. Typical price is 1.12295, just 0.6 pips from the close, on a range of 86.6 pips. The day was wide, but it closed near the middle. So a big range alone does not make a big gap. Where the close lands decides it.
Last, the GBP/USD pivot. OANDA’s hourly bars for 26 to 30 October give a weekly high of 1.34340, a low of 1.32725 and a close of 1.33898. Their sum is 4.00963, and a third of that is 1.33654, the P line. R1 is 2 x P minus the low, which gives 1.34584, again the value on screen.
What typical price changes in a moving average
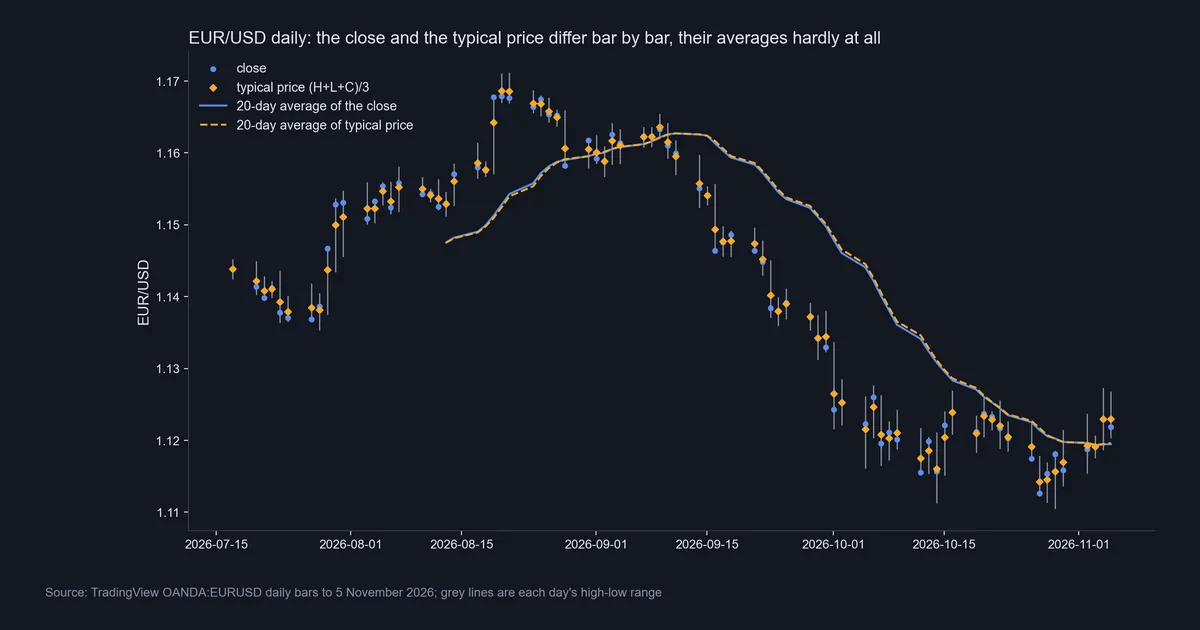
Our data chart shows EUR/USD daily from mid-July to 5 November 2026. Blue dots are closes, orange diamonds are typical prices, and grey lines are each day’s range. On many days the dot and the diamond sit well apart. Yet the two 20-day averages run almost on top of each other.
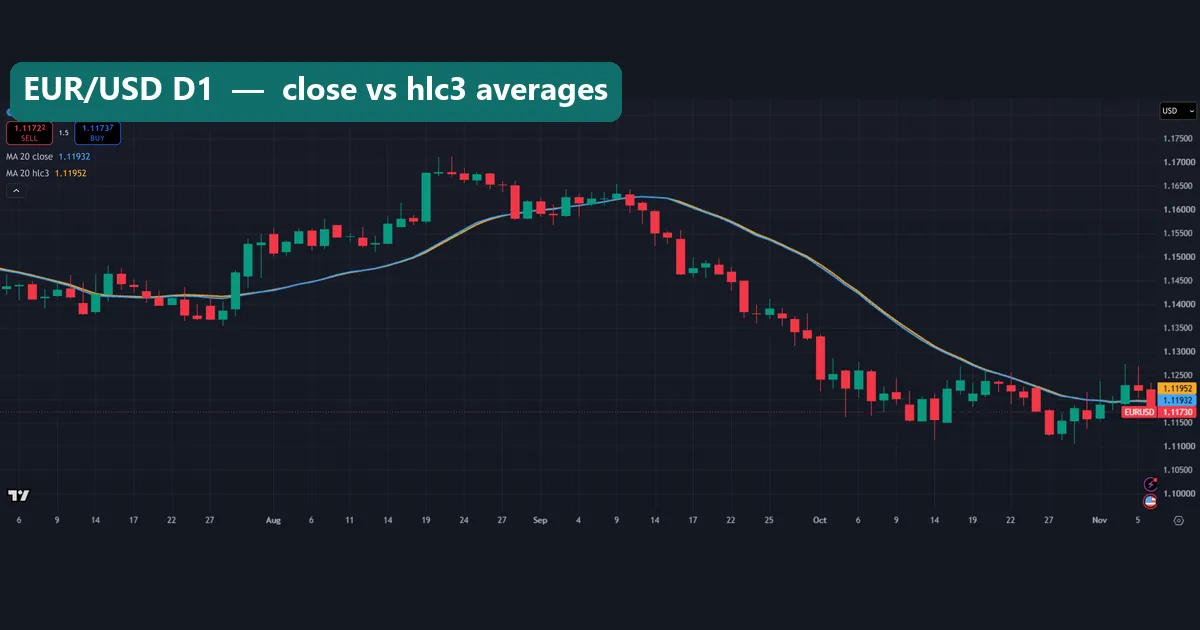
The reason is plain arithmetic. The gap between the two averages equals the average of the daily gaps. Those gaps point up on some days and down on others, so over 20 bars they mostly cancel. On our first chart, with the 6 November bar still forming, the legend read 1.11932 for the close average and 1.11952 for hlc3: 2.0 pips apart.
The MT4 numbers agree. The median gap between the two averages was about 0.03 ATR. On EUR/USD that was 2.34 pips on daily bars and 0.36 pips on hourly bars. The close sat between the two averages on just 0.7% of bars. Only then do they disagree on whether price is above its average. So a crossover rule barely notices the switch: 131.2 crosses per 1,000 daily bars on the close average, 130.6 on the typical price average. Our moving averages explainer covers the averages themselves.
CCI bands and pivot levels: what our counts show
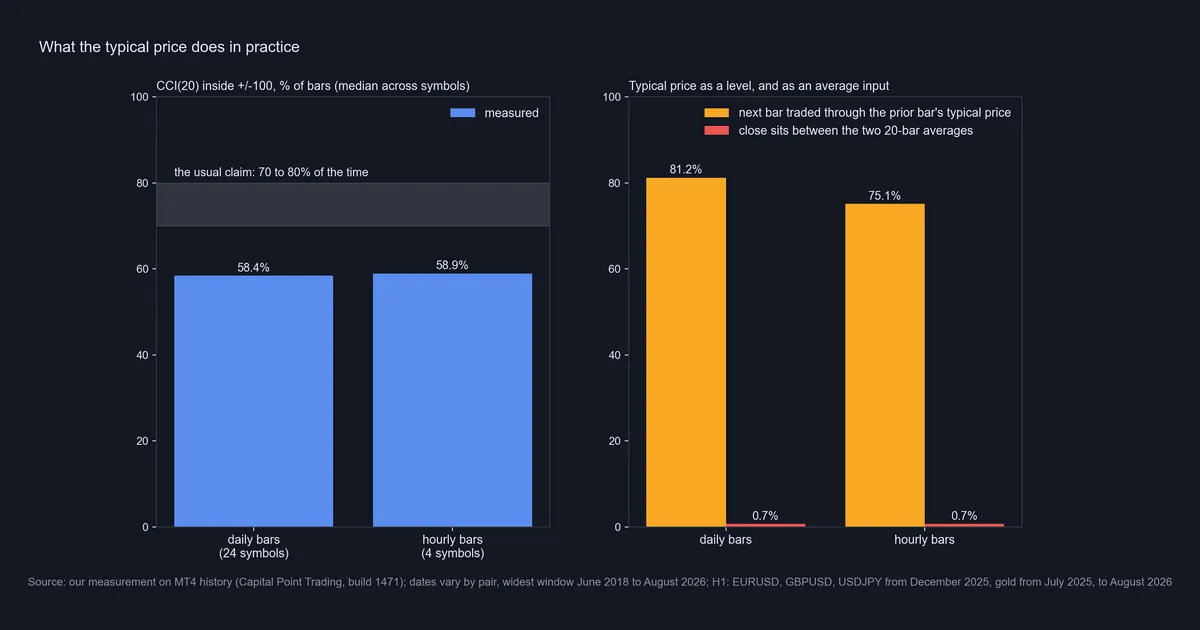
The left panel tests a number many CCI articles repeat. StockCharts ChartSchool’s CCI article says Donald Lambert set the 0.015 constant so that roughly 70 to 80% of values fall between -100 and +100. It dates the indicator to Commodities magazine in 1980, and adds that the share depends on the look-back period.
On our data, CCI(20) stayed inside +/-100 on a median 58.4% of daily bars and 58.9% of hourly bars. EUR/USD daily came in at 56.3%. Only AUD/CAD reached 69.7%, on a short window of 319 bars. Readings beyond +/-200 came on 5.3% of daily bars. Our page on overbought and oversold explains why such labels need care, and CCI vs RSI compares the two.
The right panel turns to pivots. The next bar’s range contained the prior bar’s typical price on 81.2% of daily bars and 75.1% of hourly bars. Across daily symbols it ran from 71.8% on gold to 84.9% on AUD/NZD. So P is a level price usually revisits, not a barrier.
Download the complete indicator database
Put these concepts on your charts. One email unlocks the full library of 1,380+ indicators with compiled MT4 and MT5 files, plus my TradingView scripts. No paywall, no spam, unsubscribe any time.
Get free access to my indicator database
One email unlocks 1,380+ free MT4, MT5 and TradingView indicators — the complete library. No single-tool download; you get the whole database.
Where it fails
- It hides the order of events. Two bars with the same high, low and close get the same value, even if one rallied late and the other sold off late.
- It adds little to averages. If a strategy works on only one of the two averages, suspect curve fitting, not an edge.
- It depends on the feed. Brokers cut the daily bar at different hours, so one day can give two typical prices, and two sets of pivots.
- The current bar keeps moving. A CCI or VWAP value on the forming bar is provisional.
- CCI bands run looser than the textbook. Our 58% inside +/-100 falls well short of the 70 to 80% claim.
- VWAP on FX rests on partial volume. Spot FX has no single exchange, so the volume behind the line comes from one data feed.
- No forecast. Nothing here predicts direction, and every number comes before costs.
Two charts where the limits show
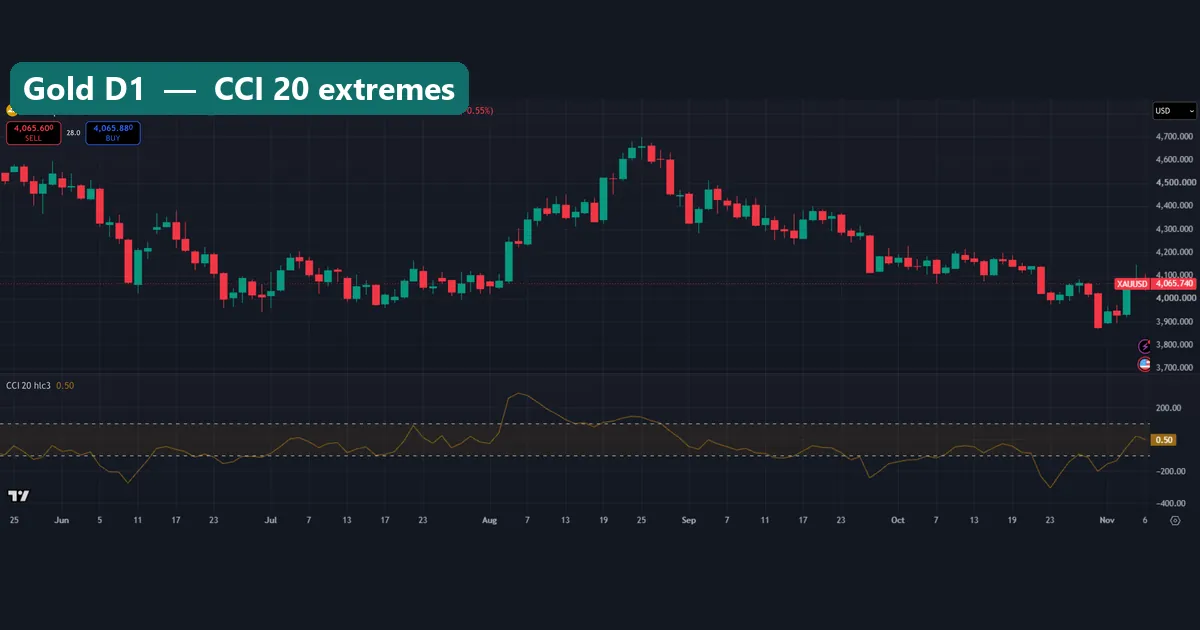
Gold on the daily chart, from late May to 6 November 2026, with CCI(20) on hlc3. The line went far past the bands more than once: about +290 on 6 August, about -275 on 10 June and about -306 on 23 October. In our MT4 count, gold spent 8.38% of daily bars beyond +/-200, the highest of all 24 symbols, on a short window of 210 bars. So fixed CCI levels do not travel well between markets.
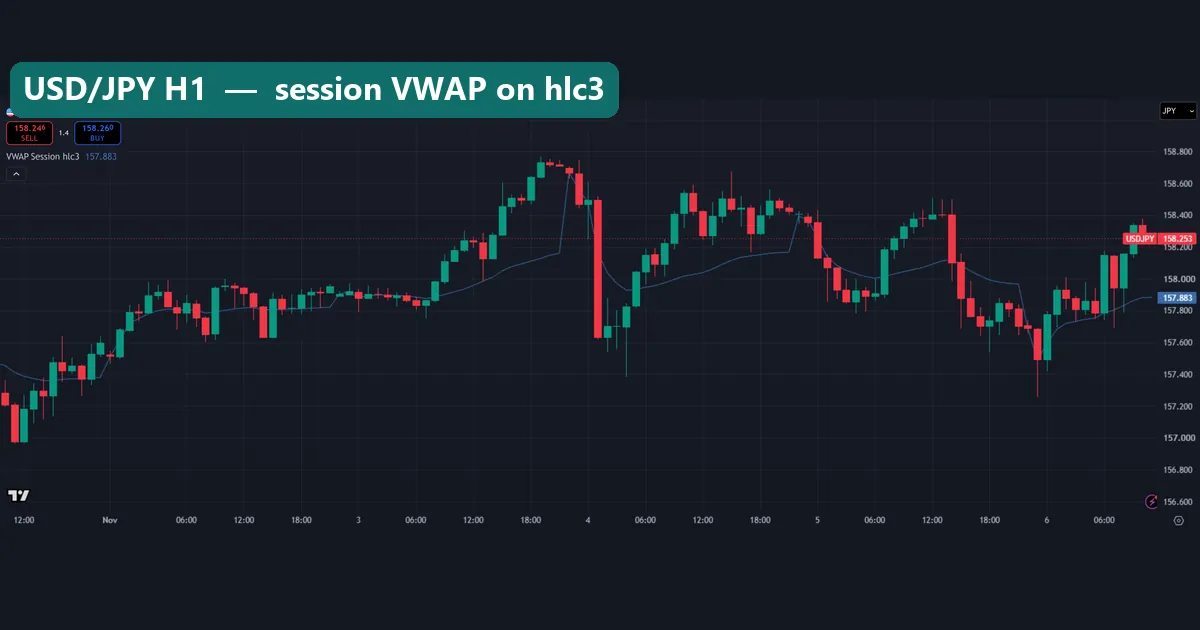
Next, USD/JPY hourly with a session VWAP on hlc3. TradingView’s VWAP help page confirms that hlc3 is the default source, with hl2 as another common option. It also says the Anchor Period sets how often the sum resets. You can see it here: the line restarts near price at each new session, then lags more as the session goes on.
On 4 November one large red hourly candle fell far below the line in a single bar, and the line simply caught up later. For the anchored version, read our anchored VWAP vs VWAP comparison. Our VWAP calculator shows the sums.
Common mistakes with typical price
- Calling it “the average price”. Other tools average all four prices, open included. Name the formula, not just the word.
- Switching to typical price to rescue a strategy. Our averages moved by a median 0.03 ATR, so a result that flips on that change is fragile.
- Reading CCI past 100 as rare. It came on about four bars in ten on our data.
- Treating P as a floor or a ceiling. The next daily bar traded through it 81.2% of the time. Size stops from volatility, for example with ATR.
Where to go next
For the other pivot formulas, read our guide to types of pivot points. If you code your own tools, our note on the difference between MetaTrader 4 and 5 covers what changes between platforms.
FAQ: typical price questions
What is the typical price formula?
It is (high + low + close) / 3 for one bar. MetaTrader calls it PRICE_TYPICAL, and TradingView calls it hlc3.
What is the difference between typical price and median price?
Median price is (high + low) / 2, so it ignores the close. Typical price gives the close a third of the weight, and weighted close gives it half.
How far is typical price from the close?
The median gap was 18.0% of the bar’s range on daily bars and 17.8% on hourly bars, or 11.8 pips on EUR/USD daily. It can never exceed a third of the range.
Is typical price better than the close for a moving average?
It is barely different. The two 20-bar averages sat a median 0.03 ATR apart on our daily data.
Which indicators use typical price?
The CCI uses it, the classic pivot P is the prior period’s typical price, and TradingView’s VWAP uses hlc3 by default.
Does CCI stay inside +/-100 for 70 to 80% of the time?
Not on our data. CCI(20) stayed inside on a median 58.4% of daily bars and 58.9% of hourly bars.
Is the pivot point the same as typical price?
The Traditional P is the prior period’s typical price. On our GBP/USD chart, P of 1.33654 matched the prior week’s high, low and close.
Can I trade typical price on its own?
We would not. It is an input to other tools, it barely changes an average, and our figures come before costs. These numbers describe the past only, so results are not guaranteed; past performance is not indicative of future results.
Last updated: 6 November 2026.

About the author
Written by Dominic Walsh, a Forex trader and MT4/MT5 indicator, Expert Advisor and script developer. Every tool on forexmt4systems.com is tested on live charts before release and ships with ready-to-use compiled MT4 (.ex4) and MT5 (.ex5) files. Learn more about the trader and developer behind this site.
How we build, test and correct every tool: Editorial & Testing Policy. Trading carries risk; see the disclaimer.