
CCI vs RSI is a question about scale, not about which line is smarter. Both are momentum oscillators, and both sit under the price chart. But RSI is locked between 0 and 100, while CCI has no ceiling and no floor. That one difference changes how often each gives an “extreme” reading. On our EURUSD daily test, CCI(20) spent 108 of 259 bars beyond plus or minus 100. RSI(14) spent only 13 bars beyond 70 or 30. This guide settles what each tool measures, how the math works, and which job each one does well.
What CCI and RSI actually measure
RSI stands for Relative Strength Index. J. Welles Wilder published it in 1978. It compares the size of recent up closes with the size of recent down closes. So it answers one question: how one-sided has the recent move been?
CCI stands for Commodity Channel Index. Donald Lambert introduced it in 1980 for commodity futures. It asks a different question: how far is price from its own recent average, measured in units of normal noise? So CCI is a distance gauge. A reading of +150 says price sits well above its 20-bar mean, compared with how far it usually strays.
In short, RSI measures the balance of buying and selling pressure. CCI measures stretch away from an average. For a full primer, see our guide on what the CCI indicator is. If you want the broader idea behind both, read what overbought and oversold really mean.
How RSI works: Wilder’s smoothing
First, RSI splits each bar’s change into a gain or a loss. An up close counts as a gain, and the loss for that bar is zero. A down close works the other way. Next, it averages the gains and the losses over 14 bars.
Wilder used his own smoothing. Each new average keeps 13 parts of the old value and adds 1 part of the new bar:
avg gain = (previous avg gain x 13 + current gain) / 14
The same rule applies to losses. Then the formula divides the two to get RS, the relative strength:
RS = avg gain / avg lossRSI = 100 - 100 / (1 + RS)
That last step is the key to everything that follows. However large RS gets, RSI can only approach 100. It can never pass it. So each extra push in a trend adds less and less. The smoothing also keeps old bars in play, so RSI moves calmly and rarely reaches its bands. TradingView’s RSI reference page shows the same formula.
How CCI works: Lambert’s constant
CCI starts from the typical price of each bar. That is the high, low and close added together and divided by three. Then it takes a 20-bar simple average of that typical price. Next, it finds the mean deviation: the average distance of each bar from that simple average. Finally, it divides the current gap by that deviation:
CCI = (typical price - SMA of typical price) / (0.015 x mean deviation)
The 0.015 is Lambert’s constant. He picked it so that most readings would land between -100 and +100. Most sources quote a target of about 70 to 80 percent of bars inside that band. The constant only sets the scale. It does not cap anything.
That is the real split between the two tools. CCI has no bound at all. After a quiet stretch the divisor is small, so a fast move makes CCI jump. The commodity channel index entry on Wikipedia covers Lambert’s original setup.
One detail matters for our charts. Our TradingView captures ran CCI on the close, while Lambert used the typical price. The shape is close, but the values differ a little.
How we tested
We ran both studies on the TradingView web chart with OANDA price feeds. The main symbol was EURUSD on the daily and 1-hour charts. We added XAUUSD daily and GBPUSD 1-hour as cross-checks. All seven screenshots were captured on 28 September 2026.
For the counts, we pulled EURUSD daily bars from 1 August 2025 to 25 September 2026. That is 299 daily bars. We skipped the first 40 as warm-up and counted over the last 259. For the hourly test, the window ran from 10 September to 28 September 2026, again 299 bars with 259 counted.
Both studies used their stock inputs. RSI ran at length 14 on the close. CCI ran at length 20 on the close. We counted bars above 70 and below 30 for RSI. For CCI, we counted bars beyond plus or minus 100 and plus or minus 200. Our full method is on the editorial testing policy page.
Default settings side by side
The two tools have few inputs, but the defaults and levels differ.
| Parameter | RSI | CCI |
|---|---|---|
| Default length | 14 bars | 20 bars |
| Source in our tests | Close | Close (Lambert used typical price) |
| Smoothing | Wilder’s running average | Simple average plus mean deviation |
| Range | 0 to 100, bounded | No upper or lower limit |
| Standard levels | 70 and 30 | +100 and -100 |
| Extreme levels some traders add | 80 and 20 | +200 and -200 |
| Centre line | 50 | 0 |
| Main job | Pressure and exhaustion | Stretch from the mean, early thrust |
If you trade intraday, our guide to RSI settings for day trading walks through the trade-off. Our page on the best RSI indicator settings covers the longer frames.
Reading CCI vs RSI on a chart
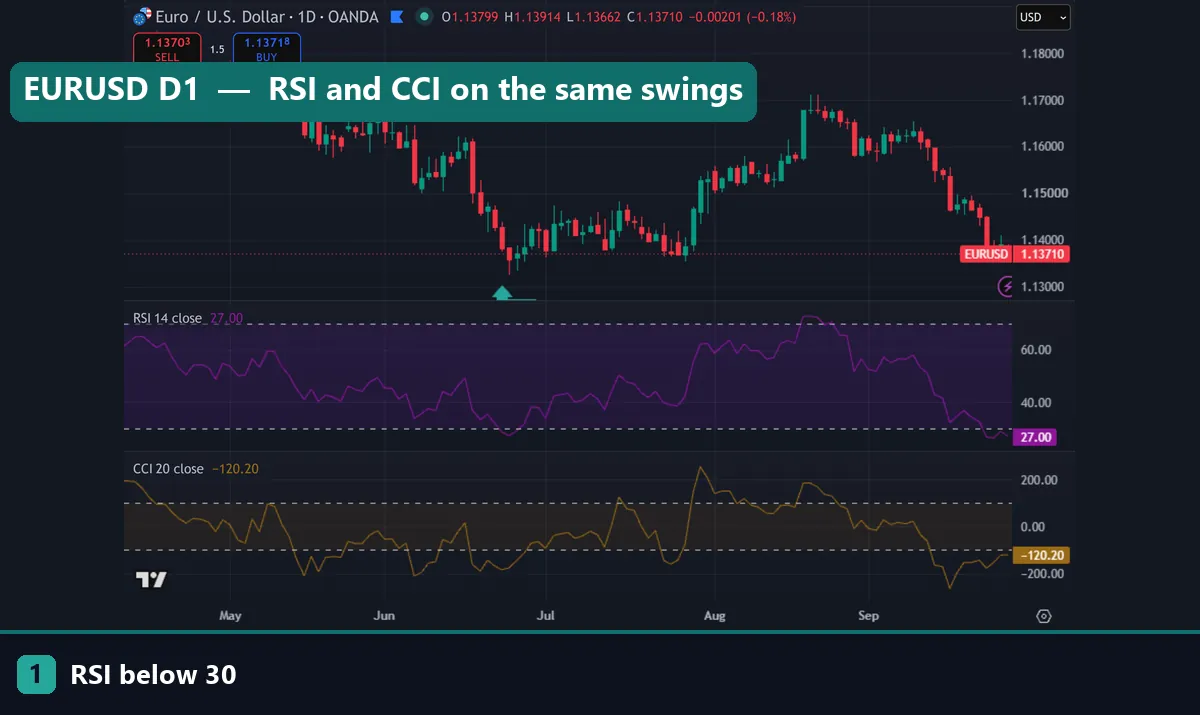
Look at the first chart again. The RSI pane and the CCI pane track the same swings. Still, they tell the story in different voices. In late June, RSI dipped just to its 30 line, which the marker shows. At that same low, CCI had already fallen close to -200. Then, at the start of August, CCI shot above +200. RSI did not cross 70 until the middle of the month.
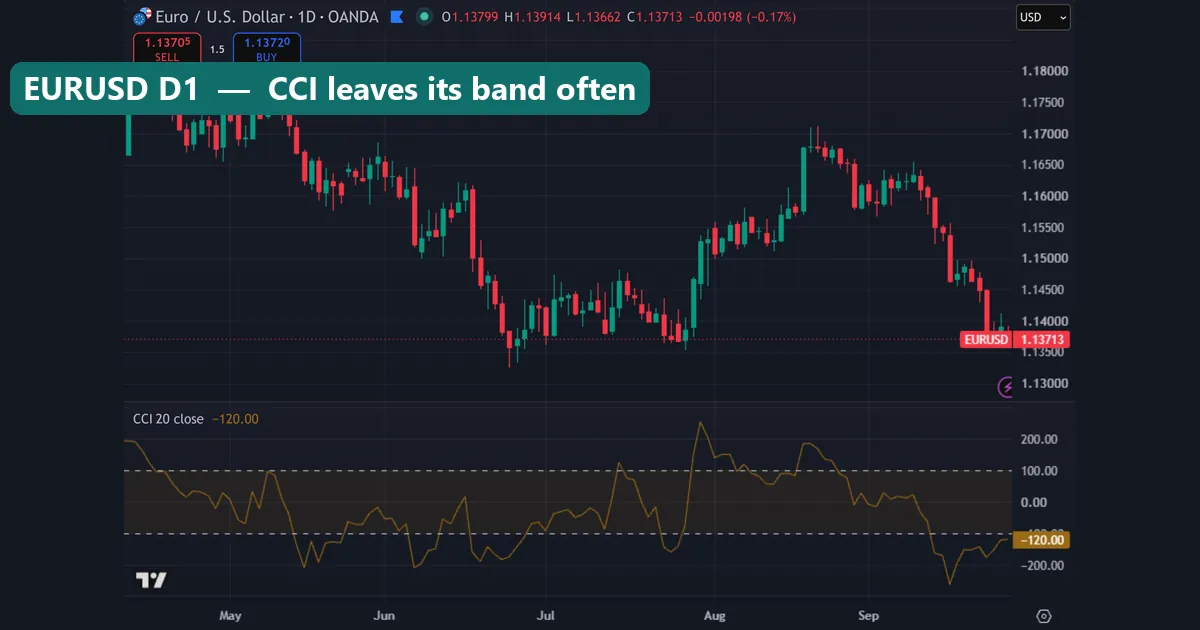
The CCI-only chart makes the pattern plain. Between May and September, the line crosses its dashed bands again and again. It pokes below -100 in May, twice in June, in July and again in September. It tops +100 in early May, mid-July and through much of August. Yet most of those trips were ordinary swings inside a range.
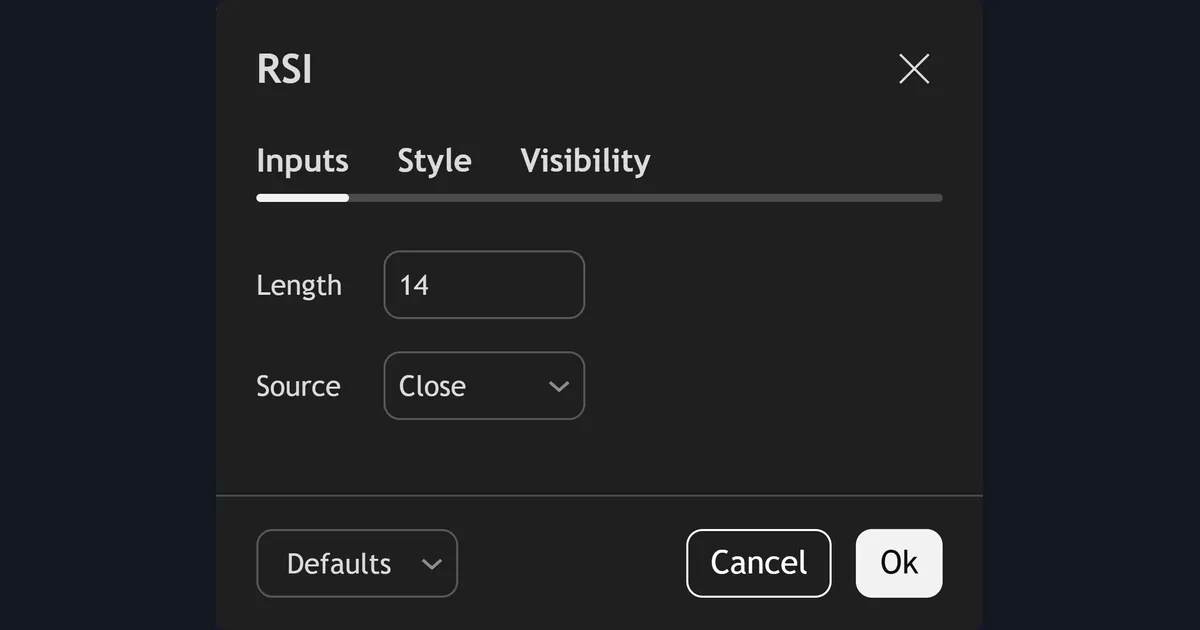
The RSI settings dialog shows how little there is to tune. It has a length, set to 14, and a source, set to Close. The rest is fixed by Wilder’s formula.
CCI vs RSI on EURUSD daily: the worked example
Here are the counts from the 259 daily EURUSD bars we measured.
- RSI(14) closed above 70 on 5 bars and below 30 on 8 bars. That is 13 bars, or about 5 percent of the sample.
- CCI(20) closed above +100 on 40 bars and below -100 on 68 bars. That is 108 bars, or about 42 percent.
- CCI went above +200 on 10 bars and below -200 on 9 bars.
- The CCI high was 291.6 and the low was -294.5.
So in this sample, CCI flagged an “extreme” about eight times as often as RSI did. Put another way, only about 58 percent of CCI readings sat inside the plus or minus 100 band. That is well short of the 70 to 80 percent that Lambert’s constant aims for.
Now the last bar in our data set. On 25 September 2026, RSI read 28.8 and CCI read -130.0. Both called the pair oversold. By the 28 September capture, the chart showed RSI at 27.00 and CCI at -120.20. The two agreed on direction here. However, they reached that agreement from very different starting points. RSI needed a long, steady slide to get under 30. CCI got past -100 early in the drop and stayed there.
So a CCI of -130 is a mild extreme, while an RSI of 28.8 is a rare event. Do not treat them as equal signals.
The hourly test: CCI at -482
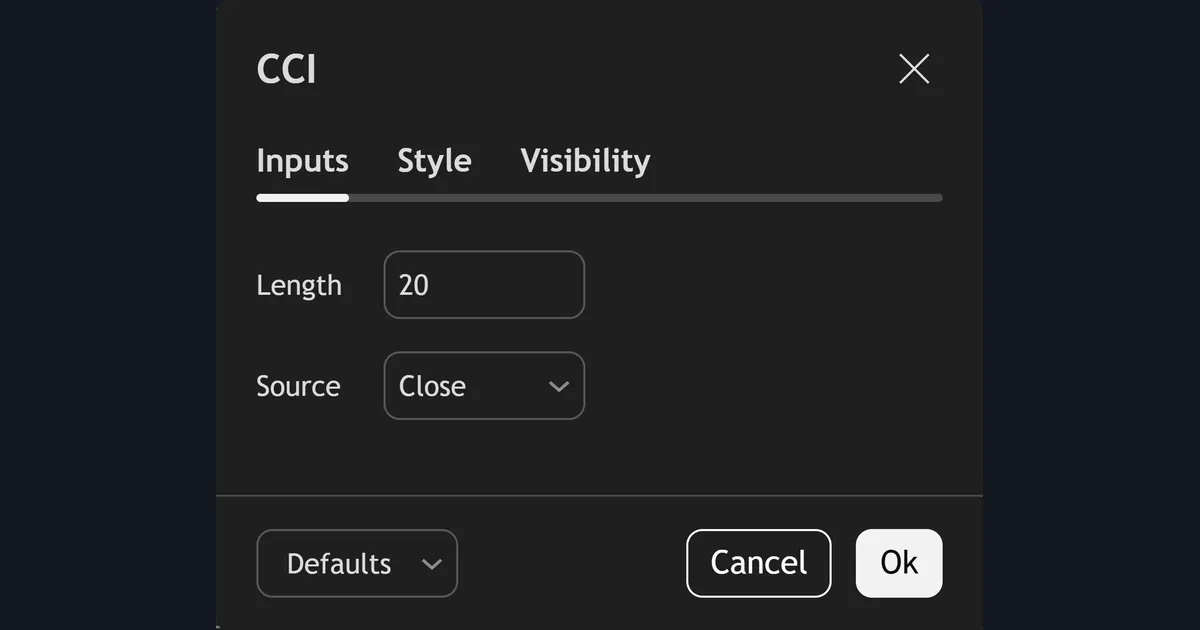
The CCI dialog looks almost the same as the RSI one. It has a length, set to 20, and a source, set to Close. The difference is hidden in the math. Nothing in this dialog puts a limit on the output.
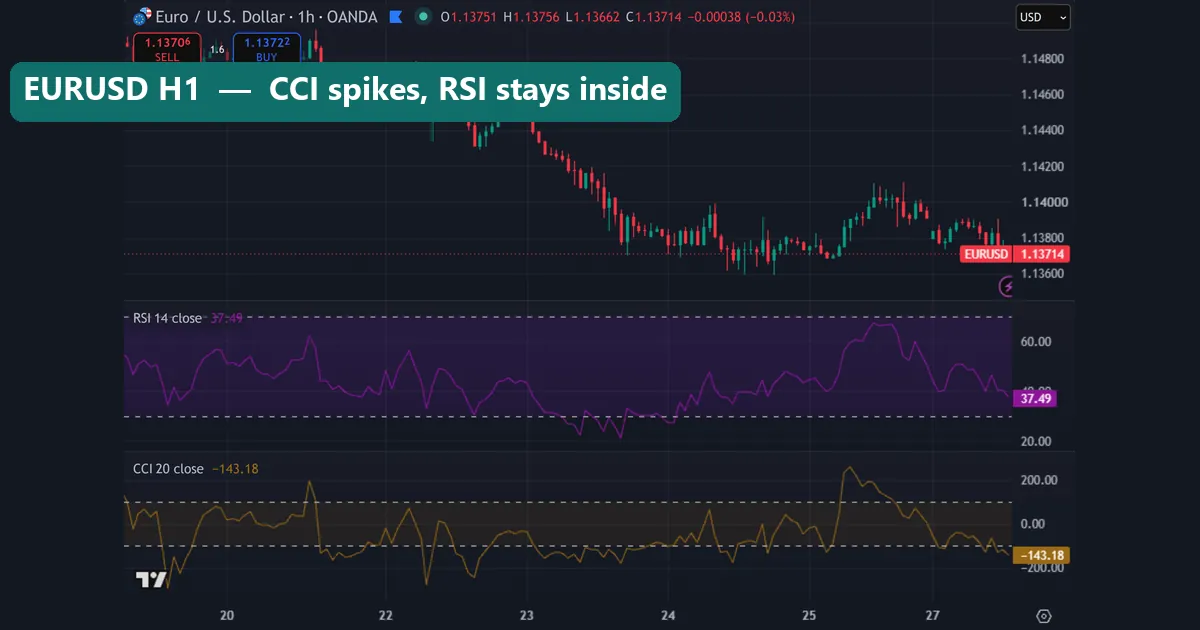
The hourly numbers show that gap even more clearly. Over 259 EURUSD 1-hour bars, RSI never closed above 70. It closed below 30 on 35 bars. Meanwhile CCI closed above +100 on 18 bars and below -100 on 76 bars. It went past -200 on 16 bars. At its lowest, it hit -482.0, and its high was 230.5.
That -482 reading came during the mid-September slide, before the window in the chart above. Still, the chart shows the same habit. On 25 September, CCI spiked above +200. RSI rose too, but it peaked below 70. At the capture, RSI read 37.49 and CCI read -143.18. So RSI called the pair mildly weak. CCI called it stretched.
Download the complete indicator database
Put these concepts on your charts. One email unlocks the full library of 1,380+ indicators with compiled MT4 and MT5 files, plus my TradingView scripts. No paywall, no spam, unsubscribe any time.
Get free access to my indicator database
One email unlocks 1,380+ free MT4, MT5 and TradingView indicators — the complete library. No single-tool download; you get the whole database.
Where it fails: the weak spots of each
RSI fails in strong trends. Because it is bounded, a steady trend pins it near 70 or 30 for weeks. Selling every RSI reading above 70 in a strong uptrend means fading the move again and again. Our guide on RSI false signals shows how often that goes wrong. RSI is also slow, so waiting for 70 or 30 often means missing the turn.
CCI fails in a different way. Because it has no bound, its levels mean less. Plus or minus 100 fires so often that it becomes background noise. In our daily test, CCI sat beyond those lines on 42 percent of bars. Worse, the size of a reading depends on how quiet the past 20 bars were. After a calm stretch, even a modest move sends CCI to -300 or beyond. So a deep reading can reflect a small divisor, not a big move.
Both tools also share one flaw. They are built from past prices, so they lag. Neither one knows about news, spreads, or liquidity. A reading describes the recent past, not the future.
Two more markets: gold and cable
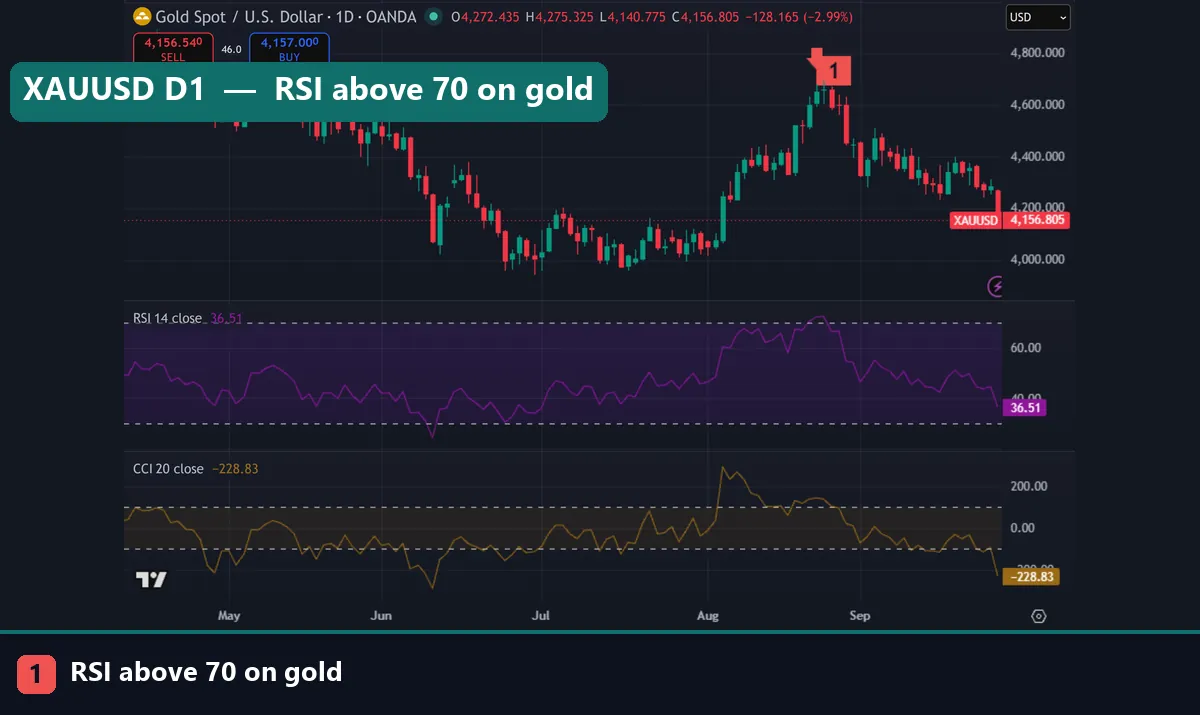
Gold makes the scale problem easy to see. The marker shows the late-August top, where RSI finally crossed 70. But CCI had peaked near +300 in early August, weeks earlier. By the capture on 28 September, gold had dropped to 4,156.805 on the daily close. RSI read 36.51, neither overbought nor oversold. CCI read -228.83, a deep extreme. Our gold RSI chart guide looks at the metal in more detail.
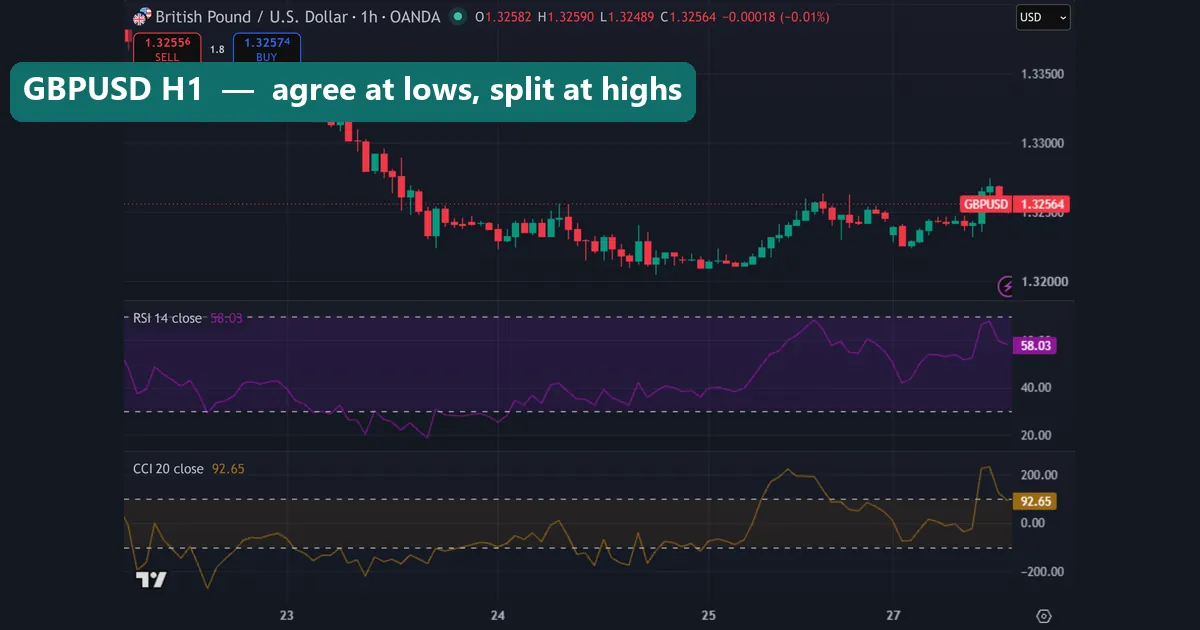
The GBPUSD hourly chart repeats the pattern. On 25 September and again on 27 September, CCI pushed above +200. RSI stayed under 70 both times. Earlier, on 23 September, RSI dipped under 30 and CCI dipped past -200 together. At the capture, RSI read 58.03 and CCI read 92.65. In other words, the two agree on the bottom here but split on the top. RSI needs a long, one-sided run, while CCI only needs a quick move.
Which job suits each tool
Use RSI when you want a rare, filtered signal. Because it is bounded and smooth, its 70 and 30 levels carry weight. It works well as a regime check: above 50 means buyers have the edge, below 50 means sellers do. It also suits divergence work, which our guide to RSI divergence explains.
Use CCI when you want an early warning of thrust. A fast move above +100 often marks the start of a push, not the end. Lambert himself treated moves past +100 as a sign of a new trend. So CCI can serve as a momentum trigger, while RSI serves as an exhaustion filter. Our guide on how to use the CCI indicator shows that approach step by step.
Many traders run both. For example, they take a CCI break above +100 only when RSI is above 50. That pairs a fast trigger with a slower trend check.
Common mistakes when comparing CCI and RSI
- Treating +100 on CCI like 70 on RSI. They are not the same level of rarity. In our daily test, one fired on 42 percent of bars and the other on 5 percent.
- Fading every CCI extreme. CCI often goes past +100 at the start of a trend. Selling there means selling into strength.
- Waiting for RSI 70 or 30 on a fast chart. On our EURUSD hourly sample, RSI never closed above 70 at all. A rule that needs it would not have traded.
- Comparing CCI values across symbols or sources. A -200 on gold and a -200 on EURUSD are scaled by different noise. Also, a close-based CCI and a typical-price CCI give slightly different numbers.
Where to go next
If you want to see how RSI stacks up against other oscillators, read RSI vs stochastic and MACD vs RSI. Williams %R is another bounded tool; see what Williams %R is.
For MetaTrader, we publish a plain CCI indicator for MT4 and MT5 and a matching RSI indicator. There is also a CCI divergence indicator if you want CCI swings marked for you. All downloads are compiled files.
For outside reading, StockCharts ChartSchool’s CCI article gives a worked calculation table. The relative strength index entry at BabyPips gives a short forex view of RSI.
FAQ: CCI vs RSI
Is CCI better than RSI?
No, it does a different job. CCI measures stretch from an average with no limit. RSI measures the balance of gains and losses on a 0 to 100 scale. CCI reacts sooner, while RSI gives rarer extremes.
Why does CCI go above 100 so often?
Lambert’s 0.015 constant only sets the scale, it does not cap the line. In our EURUSD daily test, CCI(20) sat beyond plus or minus 100 on 108 of 259 bars.
Can RSI go above 100 or below 0?
No. The formula divides by one plus RS, so RSI can only approach 100 and 0.
How low can CCI go?
There is no floor. On our EURUSD hourly test, CCI(20) reached -482.0 in mid-September 2026.
What are the default settings for CCI and RSI?
On TradingView, RSI defaults to length 14 on the close. CCI defaults to length 20, and our chart used the close as source. The usual levels are 70 and 30 for RSI and plus or minus 100 for CCI.
Should I use CCI and RSI together?
You can, as long as each one has a job. A common pairing takes a CCI break above +100 only when RSI is above 50.
Which one is better for scalping?
CCI moves faster, so it suits short charts where you want an early trigger. But it also fires more false extremes. On our hourly sample, RSI never closed above 70 at all.
Do CCI or RSI signals work every time?
No. Both lag price, and both give extreme readings that fail in trending or news-driven markets. Test any rule on your own pair and timeframe before trading it with real money, because results are not guaranteed; past performance is not indicative of future results.
Last updated: 28 September 2026.

About the author
Written by Dominic Walsh, a Forex trader and MT4/MT5 indicator, Expert Advisor and script developer. Every tool on forexmt4systems.com is tested on live charts before release and ships with ready-to-use compiled MT4 (.ex4) and MT5 (.ex5) files. Learn more about the trader and developer behind this site.
How we build, test and correct every tool: Editorial & Testing Policy. Trading carries risk; see the disclaimer.