
EURAUD is the exchange rate between the euro and the Australian dollar, the number of Australian dollars that one euro buys. This guide settles four things: what moves the pair, when it is busy, how far it travels in a day, and what one pip is worth. We measured them on eight years of MetaTrader 4 history and on TradingView charts captured on 23 October 2026, when EURAUD stood at 1.59604.
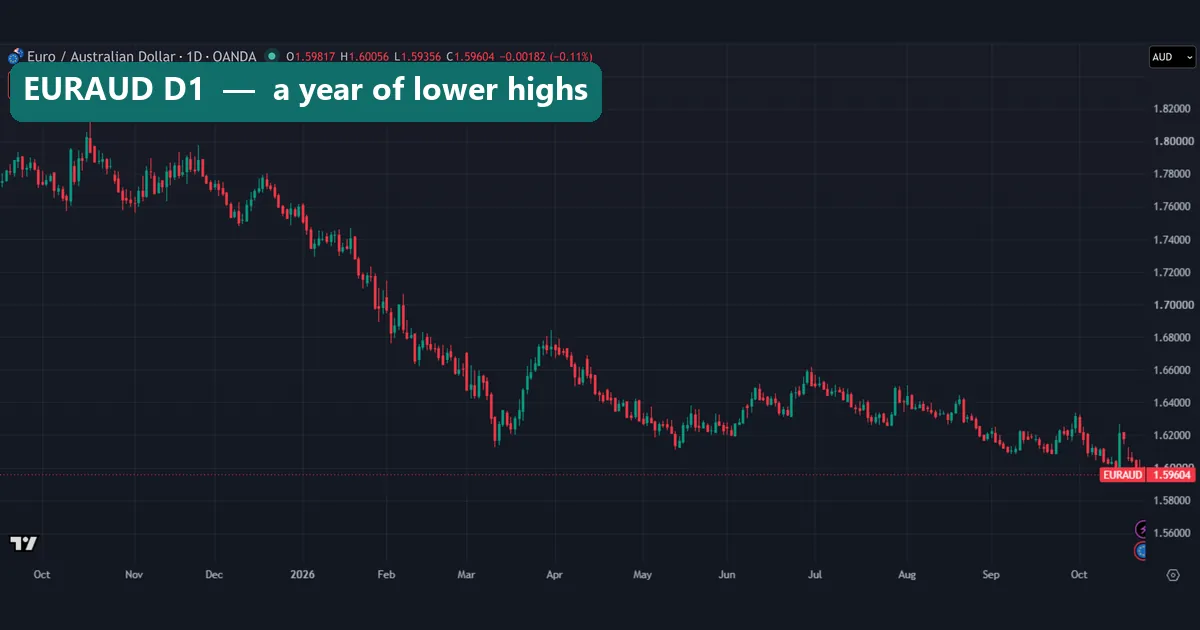
What EURAUD is: the euro priced in Australian dollars
The symbol joins two currency codes. EUR is the euro, the base currency, and AUD is the Australian dollar, the quote currency. So a quote of 1.59604 means one euro costs 1.59604 Australian dollars. When EURAUD rises, the euro gains on the Aussie. When it falls, the Aussie gains.
EURAUD is a cross, not a major. Every major pair includes the US dollar, as our list of major currency pairs shows. Still, both currencies belong to the G10 currencies, so many MT4 and MT5 brokers carry the pair.
Two central banks stand behind it. The European Central Bank sets rates for the euro area, and the ECB’s monetary policy decisions page lists each decision. The Reserve Bank of Australia sets the cash rate, and the Reserve Bank of Australia entry on Wikipedia sums up its inflation and employment goals.
How EURAUD works: a cross built from two dollar pairs
Most currency trading runs through the US dollar. So a cross like EURAUD behaves like a ratio of two dollar pairs:
EURAUD = EURUSD / AUDUSD
Our captures show the link. On 23 October 2026, AUDUSD stood at 0.70178 and EURAUD at 1.59604. Multiply the two and you get about 1.1201, the EURUSD rate those quotes imply. In percent terms the formula turns into a subtraction:
EURAUD % change = EURUSD % change - AUDUSD % change (roughly)
This is the key to the pair. When the US dollar moves, EURUSD and AUDUSD tend to move the same way, so the dollar part cancels out. What is left is euro news set against Aussie news.
The money side is simple. A pip on EURAUD is 0.0001, and the profit or loss lands in Australian dollars:
P&L in AUD = (exit price - entry price) x euros traded
On a standard lot of 100,000 euros, one pip is worth 10 Australian dollars. If your account runs in another currency, the platform converts it. Our guide on how to calculate pip value covers that step.
What moves EURAUD: the Australian dollar side
The Aussie is a commodity currency. In the Australian Bureau of Statistics goods trade release for August 2026, metal ores and minerals made up the largest export line. Other mineral fuels, coal and non-monetary gold came next. So the prices of those goods, and demand from their buyers, feed into the AUD.
The Aussie also tends to drop when markets get scared. Our page on risk-on vs risk-off currencies explains that pattern, and our data fits it. Four of EURAUD’s five biggest daily moves since 2018 were rises, which means the Aussie fell. Three came in March 2020, during the pandemic sell-off. The biggest, +664.7 pips, came on 4 April 2025, in the week of the US tariff shock.
Rates matter too. The gap between ECB and RBA rates sets the overnight swap on a EURAUD position, as our guide to the interest rate differential shows. By contrast, the US Federal Reserve hardly registers. On 62 Fed decision days from 2018 to 2026, EURAUD’s daily range came to 0.96 of its ATR, against 0.95 on other Wednesdays.
How we tested EURAUD
We used two data sources. First, daily bars from MetaTrader 4, build 1471, with history from Capital Point Trading. EURAUD runs from 12 June 2018 to 28 May 2026 there, a total of 2,065 trading days. From these we took each day’s high-to-low range in pips, the median by weekday and by year, and the five largest close-to-close moves. We also correlated EURAUD’s daily log returns with EURUSD and AUDUSD.
Second, we used the TradingView web chart with OANDA data, captured on 23 October 2026. It gave us about 300 daily EURAUD bars from 28 August 2025, plus hourly bars from 6 to 23 October 2026, which we grouped by UTC hour. The chart set also holds OANDA weekly, 15-minute and AUDUSD daily charts, and an FX_IDC monthly chart.
For weekend gaps and Fed days we measure each move in units of the previous day’s ATR(14). These are price measurements, not trades, so spread, swap and commission do not enter them. Our editorial testing policy sets out how we collect and check data like this.
EURAUD key numbers to check before you trade
Here is the pair in one table. The pip value assumes a standard lot of 100,000 euros, so check your broker’s contract size in the MT4 symbol specification first.
| Measure | Value | Source |
|---|---|---|
| Pip size | 0.0001 | Quote convention |
| Pip value, 1.00 lot | 10 AUD, about 7.02 USD at AUDUSD 0.70178 | Arithmetic on our capture |
| Median daily range | 107.5 pips | MT4, June 2018 to May 2026 |
| Median daily range, last year | 89.3 pips | OANDA, August 2025 to October 2026 |
| One day in ten wider than | 191.9 pips | MT4 |
| Widest and quietest weekday | Thursday 117.2 pips, Monday 96.7 pips | MT4 |
| Correlation with AUDUSD | -0.70 | MT4 daily returns |
| Correlation with EURUSD | 0.08 | MT4 daily returns |
| Lowest and highest price | 1.42833 and 1.97984 | MT4 |
| Weekend gaps over 0.25 ATR | 15.0% of 420 weekends | MT4 |
| Quote gap on our captures | 3.3 to 3.7 pips | OANDA, 23 October 2026 |
Two of these numbers need care. The quote gap is a single snapshot on one feed, and your broker’s will differ. Also, the two range figures differ because the last year ran quieter than the eight-year average.
Reading EURAUD on the weekly and hourly charts
The weekly chart gives the backdrop. In 2022 EURAUD bottomed near 1.43, close to the MT4 low of 1.42833. It climbed back to about 1.70 by mid-2023, then spent 2024 mostly between about 1.60 and 1.68. In April 2025 one weekly candle shot up to near 1.85. The pair then held between about 1.74 and 1.81 for most of the year, before it slid below 1.60 by October 2026.
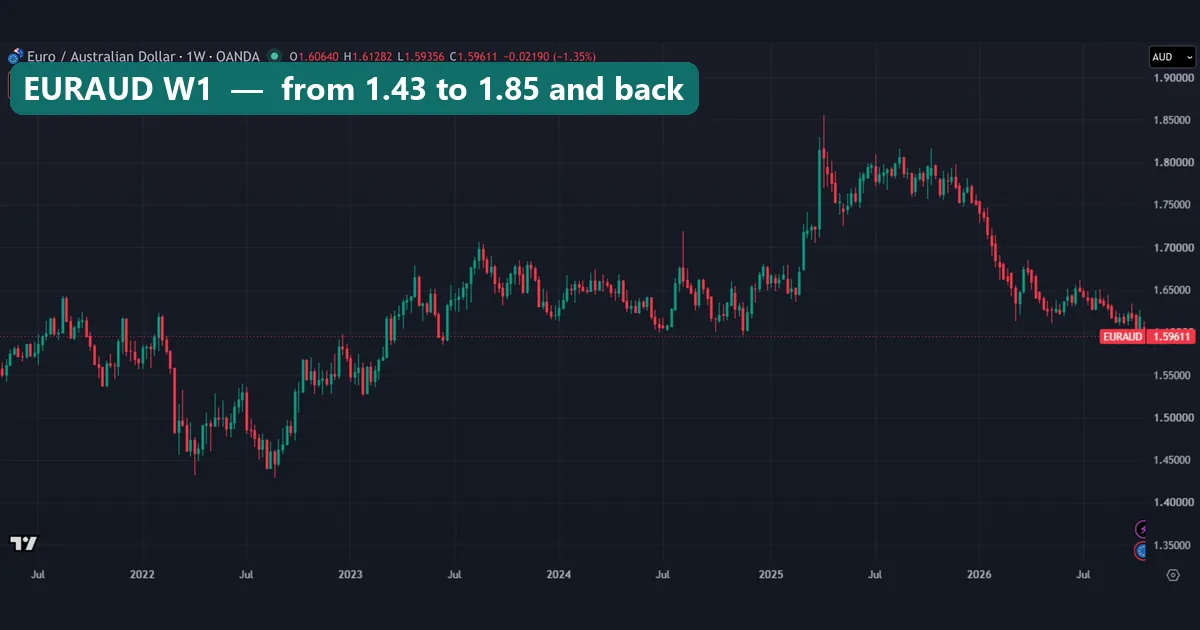
The hourly chart zooms in on the last two weeks. On 15 October the pair climbed from below 1.600 to above 1.625 in about a day. That is more than 250 pips, over twice a median day. Next it drifted lower. The new week then opened with a clear gap down from the Friday close, and by 23 October the price sat at 1.59610.
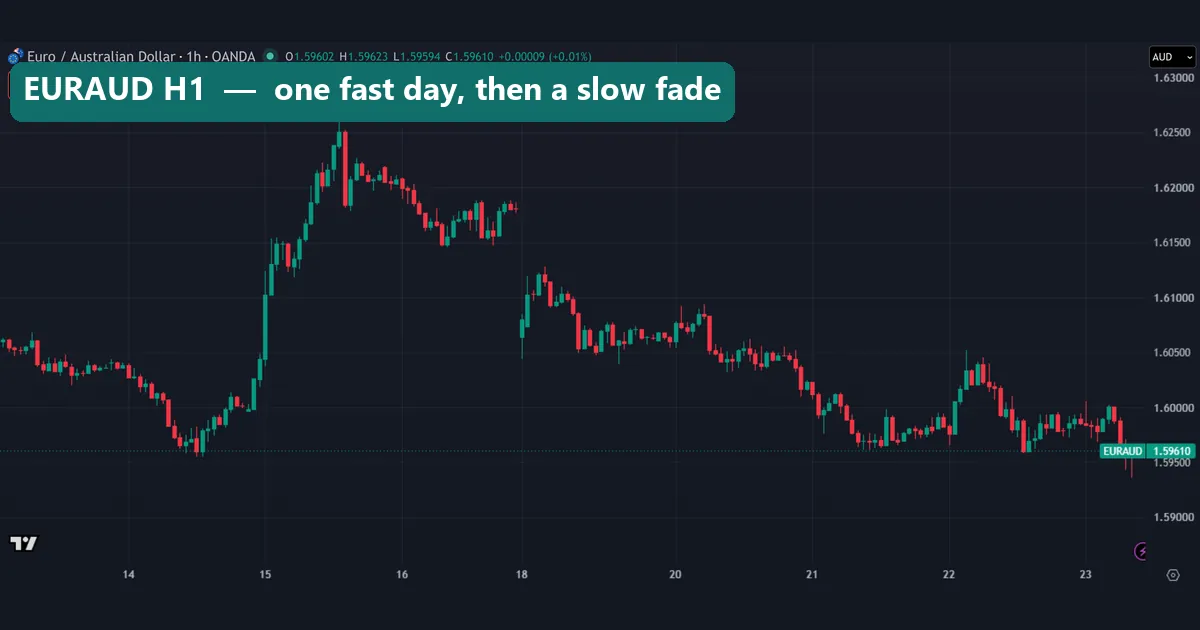
The lesson is scale. Read the weekly chart for the trend, which has pointed lower since late 2025. Then read the hourly chart for the day’s swing, because that swing can run against the trend for a full session.
Worked example: what a EURAUD day means in money
Here is how our measured numbers turn into money. We use a US dollar account and the AUDUSD price of 0.70178 from our capture.
Step 1, pip value. One pip on 1.00 lot is 10 AUD. At 0.70178, that comes to 10 x 0.70178 = 7.02 USD.
Step 2, a normal day. The MT4 median day was 107.5 pips. On 1.00 lot that equals 1,075 AUD, or about 754 USD. The recent OANDA median of 89.3 pips comes to 893 AUD, or about 627 USD.
Step 3, a wide day. One day in ten ran wider than 191.9 pips, about 1,919 AUD or 1,347 USD per lot. The record move of 664.7 pips on 4 April 2025 equals 6,647 AUD, more than six median days in one session.
Step 4, the cost to get in. Our OANDA captures showed a quote gap of 3.3 to 3.7 pips on EURAUD, against 1.2 pips on AUDUSD. So the cross cost about three times as much to enter. At 3.7 pips, the spread also eats about 4% of a recent median day (3.7 / 89.3).
Step 5, a stop that fits. A stop one median day away, 107.5 pips, risks 107.5 AUD on 0.10 lot. That is about 75 USD. If your plan allows less, cut the lot size rather than the stop. Our pip value calculator runs the same sums for any pair.
When EURAUD is active: hours and weekdays
Our data chart shows when the pair moves. On the left, the hourly medians from October 2026 peak at 07:00 UTC, with 21.0 pips, and at 13:00 UTC, with 21.1 pips. In October, 07:00 UTC is the London open, and 13:00 UTC covers 09:00 to 10:00 in New York while London still trades. The quietest hour was 20:00 UTC, at 7.2 pips.
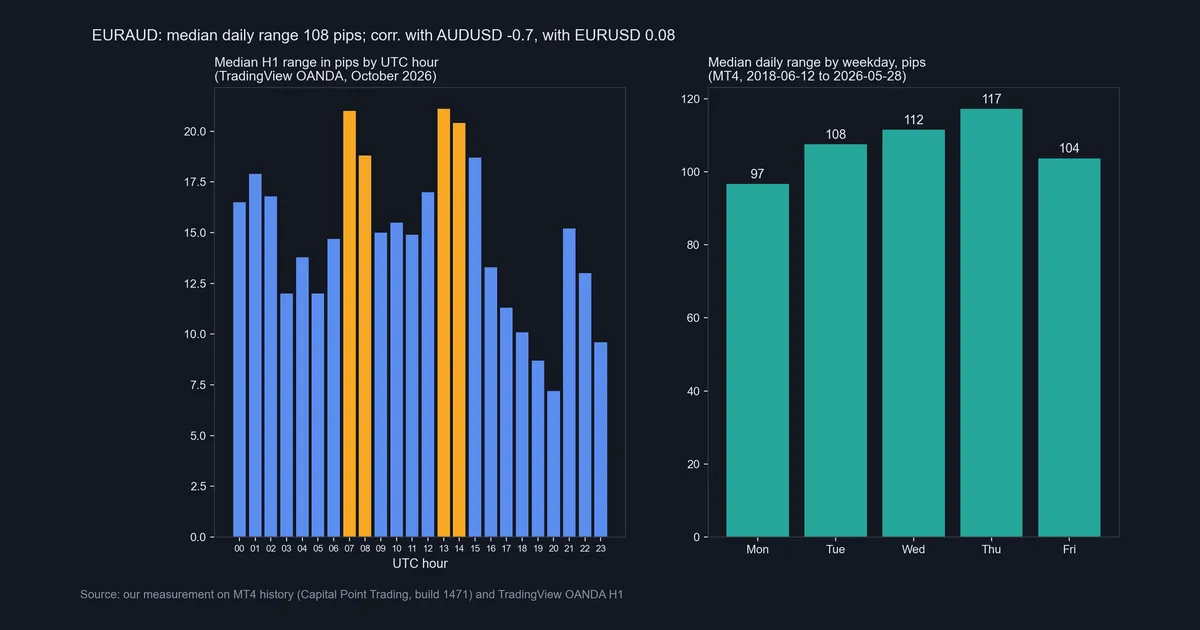
The Asian morning is far from dead. From 00:00 to 02:00 UTC the medians ran 16.5 to 17.9 pips, which fits a pair with one Asia-Pacific currency. A smaller bump at 21:00 UTC, 15.2 pips, lines up with the New York 17:00 rollover and the start of the Sydney business day.
On the right, the MT4 weekday medians rise from Monday’s 96.7 pips to Thursday’s 117.2, then ease to 103.7 on Friday. The chart rounds the eight-year median to 108 pips. Our page on forex trading sessions maps these hours to the world’s market opens.
EURAUD since 2003: the long view
The monthly chart uses TradingView’s FX_IDC feed, which labels its source ICE on the chart. It puts today’s price in context. In late 2008 EURAUD spiked above 2.10. By 2012 it had sunk under 1.20. Since 2014 most months have sat roughly between 1.40 and 1.80, with spikes near 1.98 in March 2020 and near 1.85 in 2025.
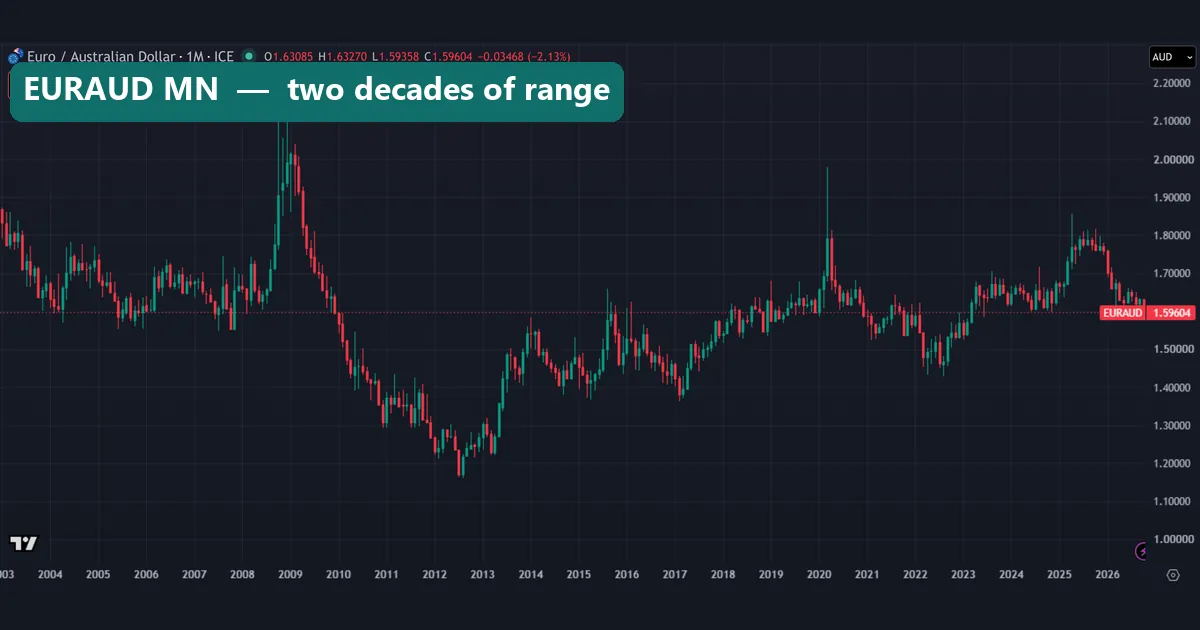
Look at what the spikes share. Each one is a sharp jump up, which means a fast fall in the Aussie, and each one later gave back most of its gain. Two of them, in 2008 and 2020, came during global sell-offs. At 1.59604 the pair now sits inside its post-2014 band, so the long chart offers no clear cheap or dear level.
Download the complete indicator database
Put these concepts on your charts. One email unlocks the full library of 1,380+ indicators with compiled MT4 and MT5 files, plus my TradingView scripts. No paywall, no spam, unsubscribe any time.
Get free access to my indicator database
One email unlocks 1,380+ free MT4, MT5 and TradingView indicators — the complete library. No single-tool download; you get the whole database.
Where it fails: what these EURAUD numbers cannot tell you
First, a correlation of -0.70 is strong but loose. Square it and you get about 0.49. So AUDUSD lines up with roughly half of EURAUD’s daily swings, and the rest belongs to the euro and to noise. You cannot trade EURAUD off an AUDUSD chart alone.
Second, the range has no fixed size. The median day was 87.6 pips in 2019 and 143.2 pips in 2022. So a stop built on one year can be far too tight in the next. Use a rolling measure such as ATR instead, as our guide to ATR stop loss distance shows.
Third, the hourly profile rests on a short window, 6 to 23 October 2026. That shows the shape of a day, but it cannot rank hours with confidence. Also, the clock changes in late October and early November move the London and New York opens one hour later in UTC.
Fourth, weekend gaps here run smaller than on many crosses, yet they happen. Only 15.0% of 420 EURAUD weekends gapped more than a quarter of a day’s ATR, against 23.7% across our 23 pairs. Even so, our hourly chart shows a clear gap at the 18 October open. Our page on the weekend gap in forex covers that risk.
Finally, OANDA’s prices and our broker’s MT4 history are not your feed, so ranges, spreads and gaps will differ.
AUDUSD next to EURAUD, and the 15-minute view
Set the AUDUSD daily chart beside the first EURAUD chart and the mirror shows. AUDUSD bottomed near 0.643 in late November 2025, then surged in January 2026. Over the same weeks EURAUD dropped from about 1.76 to about 1.66. Later, when AUDUSD peaked near 0.728 in May, EURAUD sat near its spring lows.
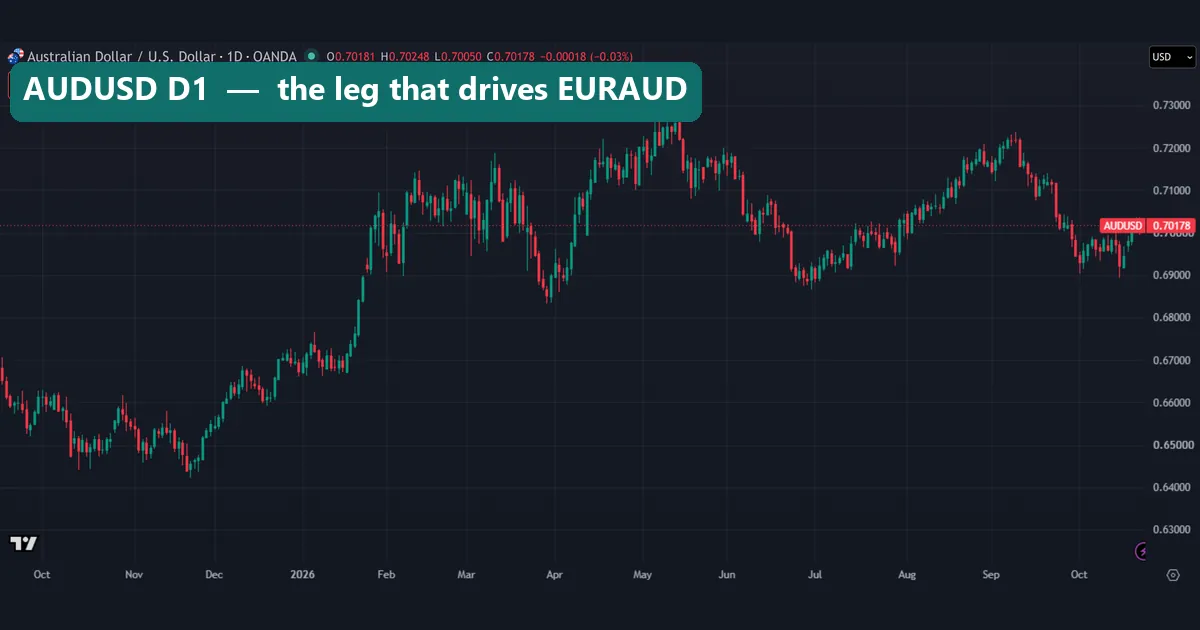
The mirror is not exact, though. On days when euro news moves the market, EURAUD and AUDUSD can part ways.
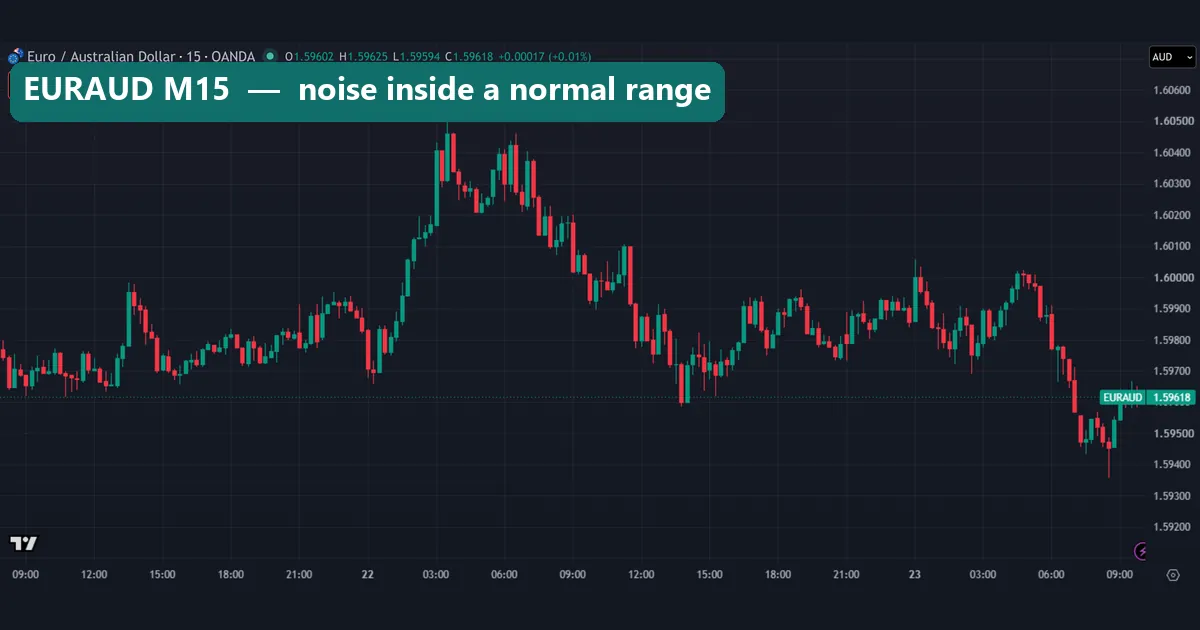
The 15-minute chart shows the noise inside a normal range. On 22 October EURAUD jumped to about 1.605, then gave it all back the same day. On 23 October it dipped near 1.594 before a small bounce. Each swing stayed under the 107.5-pip median day, so this was ordinary movement for the pair.
Common mistakes with EURAUD
1. Treating it like EURUSD. The name starts with the euro, but the euro is the quieter leg. With a 0.08 correlation to EURUSD, a EURUSD view tells you almost nothing about EURAUD. Watch AUDUSD and Australian news instead.
2. Copying a stop from another pair. Pip counts do not travel between pairs. A EURAUD pip was worth about 7.02 USD per lot at our capture, while a EURUSD pip is worth 10 USD. So set the stop from EURAUD’s own range, then size the lot to fit your risk.
3. Forgetting the swap. Holding past the daily rollover adds a swap charge or credit. The gap between ECB and RBA rates drives it, and your broker sets the final figure. Check it before you hold for weeks, as our page on swap in forex explains.
4. Fading a run because it must turn. In our MT4 data, EURAUD once closed in the same direction 13 days in a row. A streak alone gives no reason to bet on a reversal.
Where to go next
To see how EURAUD lines up with other pairs right now, open our forex correlation matrix. Our guide to currency correlation in forex explains how to read the numbers. For the math behind the -1 to +1 scale, see StockCharts ChartSchool’s guide to correlation.
For the rate side, check current policy rates on our interest rate tracker. Then read the ECB and RBA pages linked above when either bank meets.
FAQ about EURAUD
What does EURAUD mean?
It is the price of one euro in Australian dollars. EUR is the base currency and AUD the quote currency. At our 23 October 2026 capture, one euro cost 1.59604 Australian dollars.
Is EURAUD a major pair?
No. It is a cross, because it does not include the US dollar. Both currencies are G10 currencies, though, so many brokers carry it.
How many pips does EURAUD move in a day?
The median daily range was 107.5 pips in our MT4 data from June 2018 to May 2026, and 89.3 pips over the last year of OANDA data. One day in ten ran wider than 191.9 pips.
What is one EURAUD pip worth?
On a standard lot of 100,000 euros, one pip is 10 Australian dollars. At an AUDUSD rate of 0.70178, that came to about 7.02 US dollars.
When is EURAUD most active?
In our October 2026 hourly data, the busiest hours were 07:00 and 13:00 UTC, and the quietest was 20:00 UTC. By weekday, Thursday had the widest median range and Monday the narrowest.
Why does EURAUD move opposite to AUDUSD?
Because the Aussie sits on opposite sides of the two pairs. It is the base currency in AUDUSD and the quote in EURAUD. So a stronger Aussie lifts AUDUSD and lowers EURAUD. Our daily correlation came to -0.70.
Does the Federal Reserve move EURAUD?
Hardly. Across 62 Fed decision days from 2018 to 2026, EURAUD’s daily range was 1.01 times a normal Wednesday’s. The dollar cancels out in the cross, as the formula EURAUD = EURUSD / AUDUSD shows.
Will EURAUD keep falling?
We do not forecast prices. The pair has made lower highs since late 2025, but trends can end without warning, and the monthly chart shows sharp spikes in 2020 and 2025. Size every trade for the pair’s own range, and keep in mind that results are not guaranteed; past performance is not indicative of future results.
Last updated: 23 October 2026.

About the author
Written by Dominic Walsh, a Forex trader and MT4/MT5 indicator, Expert Advisor and script developer. Every tool on forexmt4systems.com is tested on live charts before release and ships with ready-to-use compiled MT4 (.ex4) and MT5 (.ex5) files. Learn more about the trader and developer behind this site.
How we build, test and correct every tool: Editorial & Testing Policy. Trading carries risk; see the disclaimer.