
German money before euro cash arrived was the Deutsche Mark, born in the West German reform of 20 June 1948. This guide settles three things. First, what the mark was and how it ended, from the Bundesbank’s own account. Second, what its dollar rate did while it traded, measured on 28 years of daily closes. Third, what “the mark today” means on a chart, since the line runs on after 1998 but is no longer a market.
German money before euro adoption: the Deutsche Mark
The Deutsche Mark, or DM, came out of a currency reform. The Bundesbank’s March 2002 Monthly Report on the circulation of the Deutsche Mark tells the story. The reform of 20 June 1948 made the mark “the new and sole legal tender of West Germany”. It replaced the Reichsmark, which became invalid on 21 June 1948. Each person got DM40 at first and then DM20 more.
The report adds two details. First, the mark had no cover or redemption rule, so it was paper money from the start. That makes it a fiat currency, like most money today. Second, it did not reach the whole west at once. It became sole legal tender in West Berlin on 20 March 1949, and in the Saarland only in July 1959.
East Germany had its own money. The Soviet zone began a new currency on 24 June 1948. The report traces its names, ending with Mark der Deutschen Demokratischen Republik from 1968. That money ended on 1 July 1990, when the Deutsche Mark became sole legal tender in the East. In principle, assets converted at 2:1, while wages and salaries converted at 1:1.
The end of the mark came in two steps. On 1 January 1999 its euro rate became fixed, as the next section shows. Then on 1 January 2002 euro cash arrived, and the mark lost its status as legal tender. Still, banks and shops agreed to take mark cash until 28 February 2002. By the end of that month, mark notes and coins “vanished completely from payments”.
How the mark’s dollar rate worked
A chart of German money shows one number. USD/DEM is the count of marks that one US dollar would buy. So the line runs the opposite way to the mark itself. When the line falls, the mark gains. When it rises, the dollar gains.
Three short sums turn the quote into something useful:
one mark in US cents   = 100 / USDDEM
change in mark's value = (old USDDEM / new USDDEM) - 1
mark rate after 1998   = 1.95583 / EURUSD
The two sides of a move never match, because the base changes. For example, a 4.06% fall in the dollar means a 4.23% rise in the mark. In this guide we give the mark’s side unless we say otherwise.
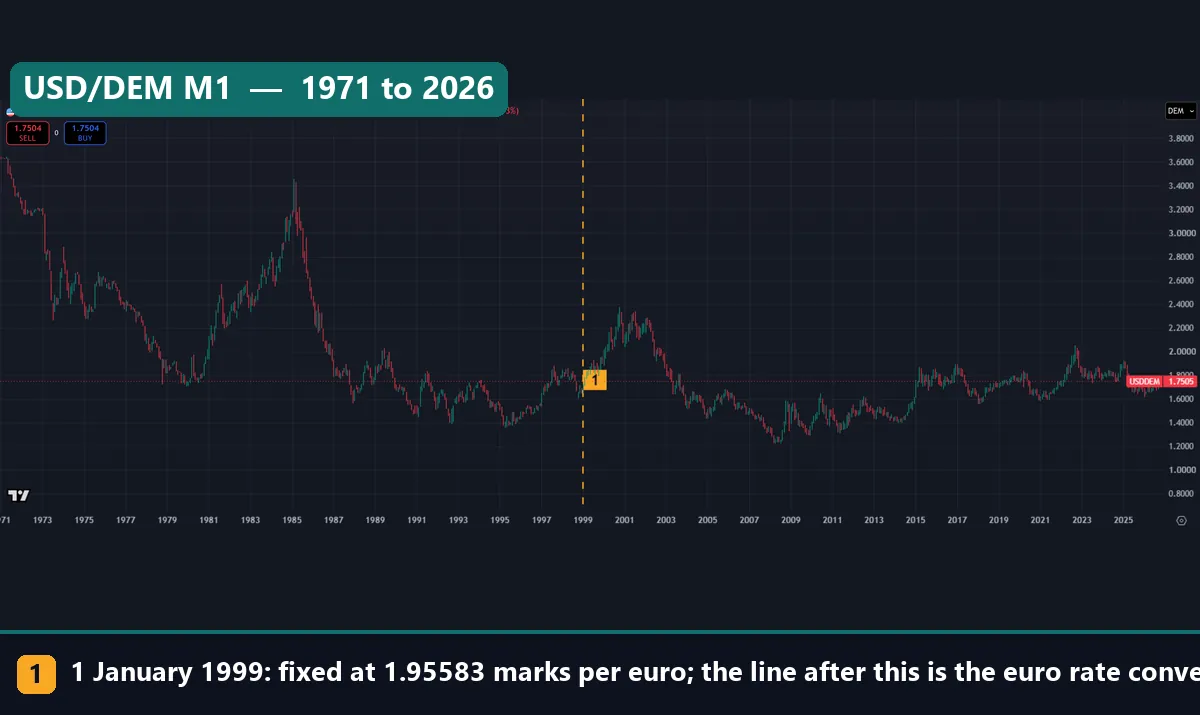
The third line explains the chart after 1998. From 1 January 1999 the mark had no price of its own. The ECB’s press release of 31 December 1998 on the euro conversion rates gives the figure. The EU Council fixed it at 1.95583 marks per euro, from 0.00 local time on 1 January 1999. So any USD/DEM quote after that is just 1.95583 divided by EUR/USD. Our guide on whether the euro is stronger than the dollar covers that pair.
How we tested
We pulled FX_IDC:USDDEM daily bars on the TradingView web chart on 6 November 2026. The chart header names ICE as the source, and two of our captures use monthly bars. Bars dated 6 November were still forming, so we dropped them, and our last day is 5 November 2026. The traded window runs from 4 January 1971 to 31 December 1998. Our series has nothing before 1971, so we make no claim about earlier rates.
We checked the feed in three ways. First, every daily bar before 18 August 1997 is a single print, so this is a record of closes. Second, we dropped one bad close: 2.2624 on 6 July 1973. Third, we tested the years after 1998. On 300 days, USD/DEM times EUR/USD gave a median of 1.95577. Every day sat within 0.13% of the fixed 1.95583, so the modern line is a conversion.
We ran no trade test. So every figure here comes before spread, swap, financing and commission. Our editorial testing policy explains how we treat reference data like this. The two data charts below are our own measurement on these bars.
The mark in numbers
| Parameter | Value | Where it comes from |
|---|---|---|
| Currency reform, West Germany | 20 June 1948 | Bundesbank report |
| Fixed euro rate | 1.95583 marks per euro, from 1 January 1999 | ECB press release |
| End of legal tender | 1 January 2002 | Bundesbank report |
| Cash taken by banks and shops until | 28 February 2002 | Bundesbank report |
| First close in our data | 3.6434 (4 January 1971) | Our bars |
| Dollar peak of the 1980s | 3.4525 (25 February 1985) | Our bars |
| Strongest mark | 1.3565 (19 April 1995) | Our bars |
| Last traded close | 1.6654 (31 December 1998) | Our bars |
| Mark’s gain, 1971 to 1998 | +118.8% | Our bars |
| Median absolute daily move | 0.31% (EUR/USD since 2002: 0.31%) | Our bars |
| Implied range since 1999 | 2.3646 (25 October 2000) to 1.2225 (22 April 2008) | Our bars |
| Implied rate, 5 November 2026 | 1.7437 marks per dollar | Our bars |
One row surprised us. The traded mark moved a median 0.31% a day, the same as EUR/USD since 2002. So the old mark was no calmer than the euro, at least close to close. The weakest mark sits just after the first close, at 3.645 on 5 January 1971.
Reading USD/DEM on a chart: the Plaza week
Start with the long view at the top of this page. Left of the dashed line, the mark traded. Right of it, the line only tracks the euro. The two halves look alike, and that is the trap.
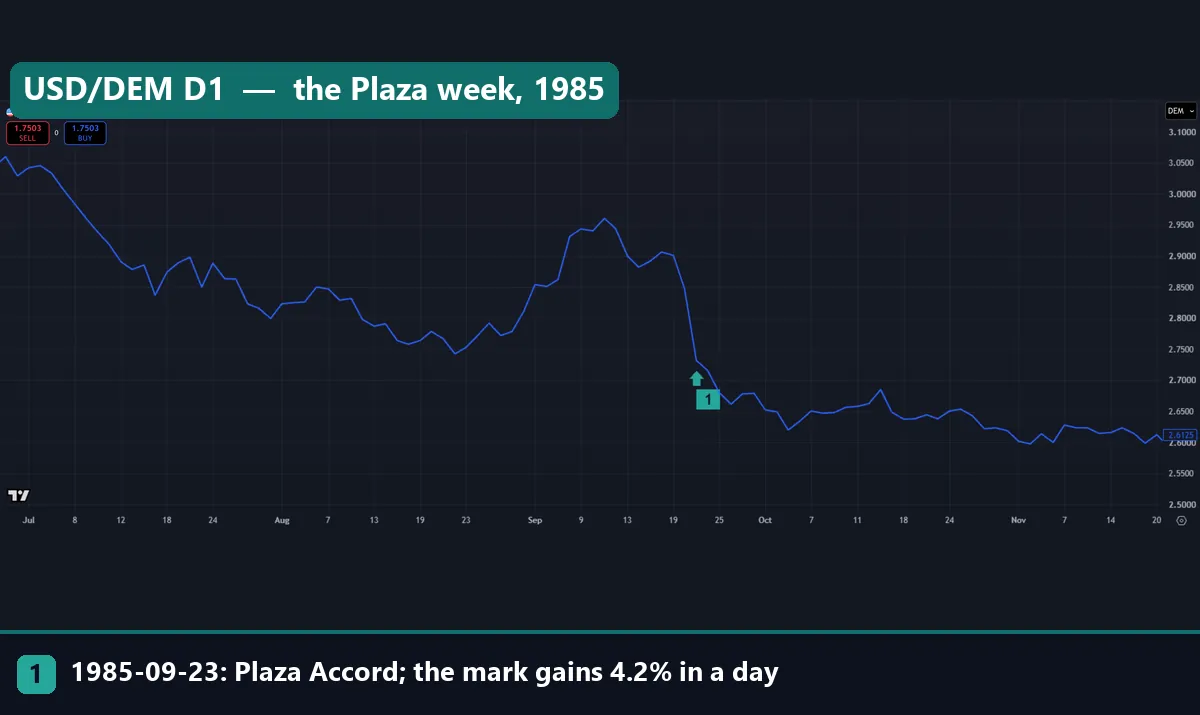
This daily line runs from the start of July to 20 November 1985. The dollar starts above 3.0 marks and is already sliding. It bounces to 2.9605 on 11 September, then breaks lower. Marker 1 sits on Monday 23 September. The close fell from 2.8475 on the Friday to 2.732. So the dollar lost 4.06%, and the mark gained 4.23%.
The weekend explains the gap. On Sunday 22 September 1985, finance ministers and central bankers of five countries met, West Germany among them. The Plaza Accord text at the University of Toronto’s G7 Research Group records what they said. In their words, “some further orderly appreciation of the main non-dollar currencies against the dollar is desirable”. They also stood ready to cooperate to encourage it.
Read one more thing from this chart. From its peak of 3.4525 on 25 February 1985, the dollar had already lost 17.5% by that Friday. So the Plaza day sped up a fall that was under way. It did not start it.
The strongest mark: April 1995
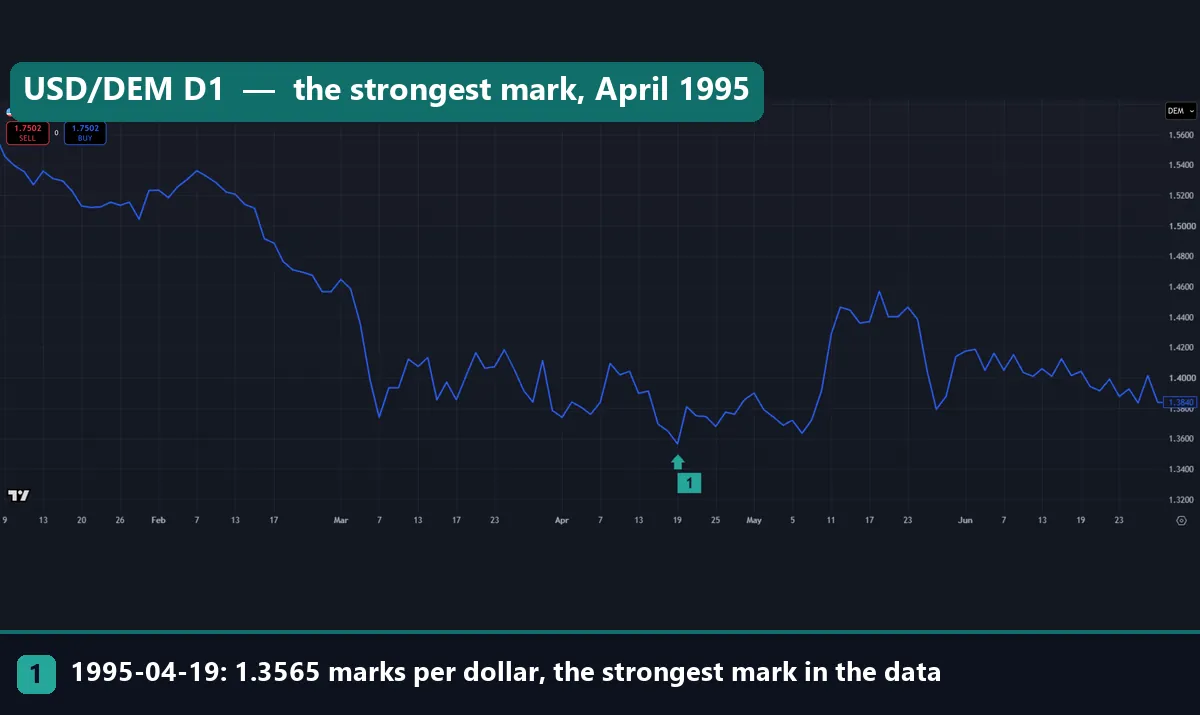
This line covers early January to 29 June 1995. It opens near 1.55 and slides to marker 1, the close of 1.3565 on 19 April. That is the strongest mark in our 28 traded years: one mark bought about 73.7 US cents. The sharpest drop came in early March, from 1.4647 on 1 March to 1.374 on 7 March.
After the low, the line rebounds to 1.457 on 18 May. It ends the window at 1.384. We know of no single event behind the April low, so we do not assign one. In short, the chart shows a slow grind, not a shock.
Worked example: what a mark was worth, then and now
- Start in January 1971. The first close is 3.6434, so one mark is worth 100 / 3.6434 = 27.45 US cents.
- Move to the last traded close, 1.6654 on 31 December 1998. One mark is now 100 / 1.6654 = 60.05 cents.
- Compare the two: 60.05 / 27.45 – 1 = 118.8%. Seen from the other side, the dollar lost 54.3%.
- Now take 500 marks found in a drawer. At the fixed rate they come to 500 / 1.95583 = 255.65 euro.
- For dollars, use the implied 1.7437 of 5 November 2026: 500 / 1.7437 = 286.75 dollars.
Step five hides the key point. Since 1999, a mark’s dollar value depends only on EUR/USD, which sits at 1.95583 / 1.7437 = 1.1217 here. So the mark shows 57.35 cents now, against 60.05 cents at the end of 1998. That is a loss of 4.5%, yet no mark changed hands to cause it.
These are sums, not dealing prices. A bank would add its own margin on the dollar step. Our currency converter does the same kind of sum for live pairs.
Our measurement: the mark’s long path
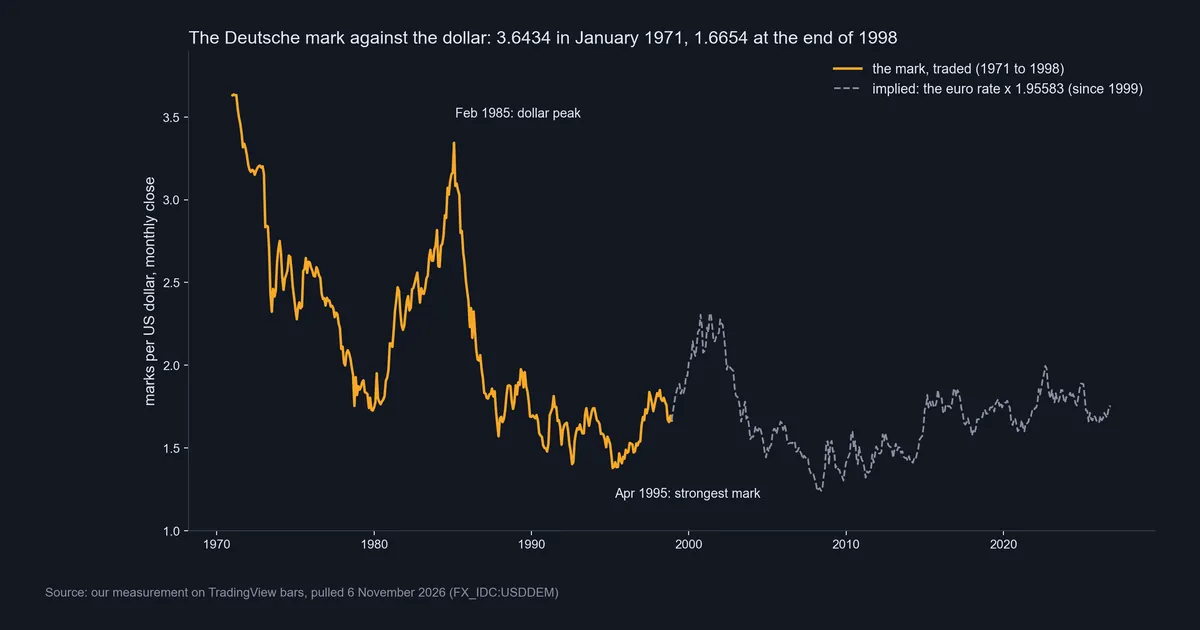
This chart draws the whole history as monthly closes. The gold line shows the traded mark, from 3.6434 in January 1971 to 1.6654 at the end of 1998. The dashed grey line shows the implied rate since 1999. Two big waves stand out. First the dollar climbs to its February 1985 peak, and then it slides to the April 1995 low.
After 1998 the dashed line swings almost as far. It reaches 2.3646 on 25 October 2000 and 1.2225 on 22 April 2008. Those swings belong to the euro, not to the mark.
Our measurement: the mark year by year
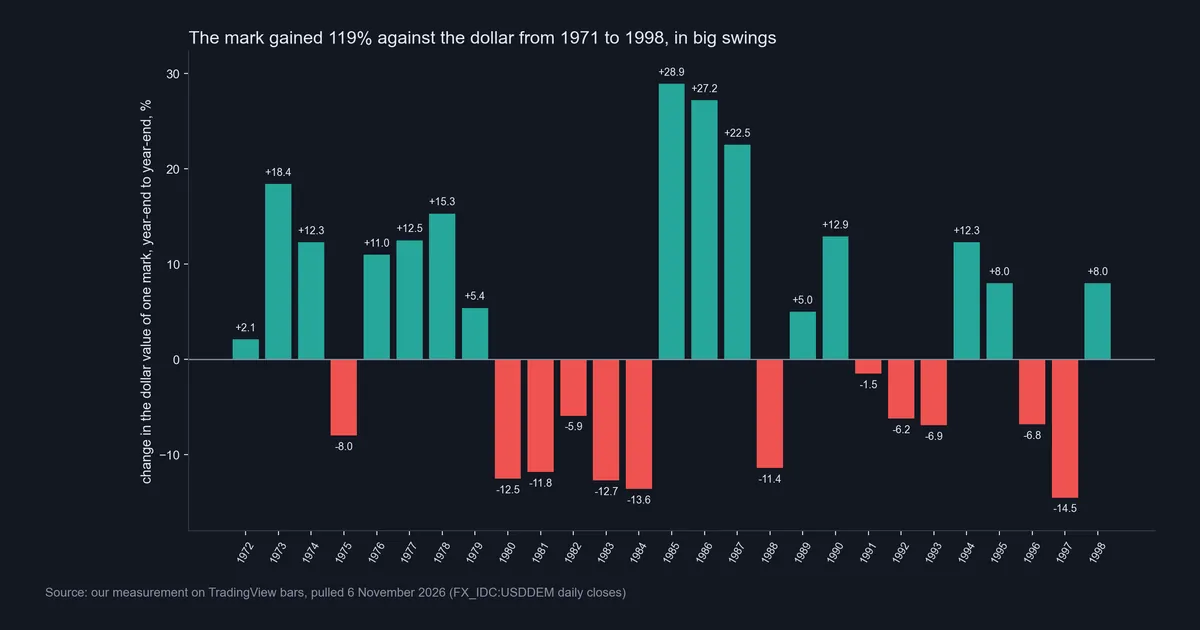
This chart gives the change in a mark’s dollar value for each year from 1972 to 1998. The mark rose in 15 years and fell in 12. Also, 16 of the 27 years moved 10% or more. The best run came from 1985 to 1987, at +28.9%, +27.2% and +22.5%. That roughly doubled the mark’s dollar value. The worst years were 1997 at -14.5% and 1984 at -13.6%.
The Bundesbank’s report saw these swings from another angle. It tied faster growth in mark cash in 1977 to 1978, 1985 to 1987 and 1994 to 1995 to a rising mark. On our bars, each of those was an up year for the mark.
Download the complete indicator database
Put these concepts on your charts. One email unlocks the full library of 1,380+ indicators with compiled MT4 and MT5 files, plus my TradingView scripts. No paywall, no spam, unsubscribe any time.
Get free access to my indicator database
One email unlocks 1,380+ free MT4, MT5 and TradingView indicators — the complete library. No single-tool download; you get the whole database.
Where it fails
The mark’s history is clear, but a chart of it has real limits. We found no way around these.
- Closes only until 1997. Daily bars before 18 August 1997 are single prints, so ranges and ATR tests on them mean nothing.
- A reference quote, not a trade. FX_IDC shows where quotes sat. Nobody stood ready to fill an order there, and the feed gives no time of day.
- Sources disagree on detail. For 1 November 1978, the memo below gives a fixing of 1.74 the day before and 1.85 by mid-morning. Our closes read 1.754 and 1.86.
- The line after 1998 is not a market. A signal on USD/DEM since 1999 is a signal on EUR/USD.
- Gaps in the record. Our data has no close for Monday 12 February 1973, so the 13 February move covers more than one session.
- No cause in the data. A big move gives size and date, not a reason. We name a cause only where a primary source does.
- Cash terms can change. Our exchange quote comes from a 2002 report, so check the Bundesbank’s current pages first.
The 1978 rescue and the monthly record
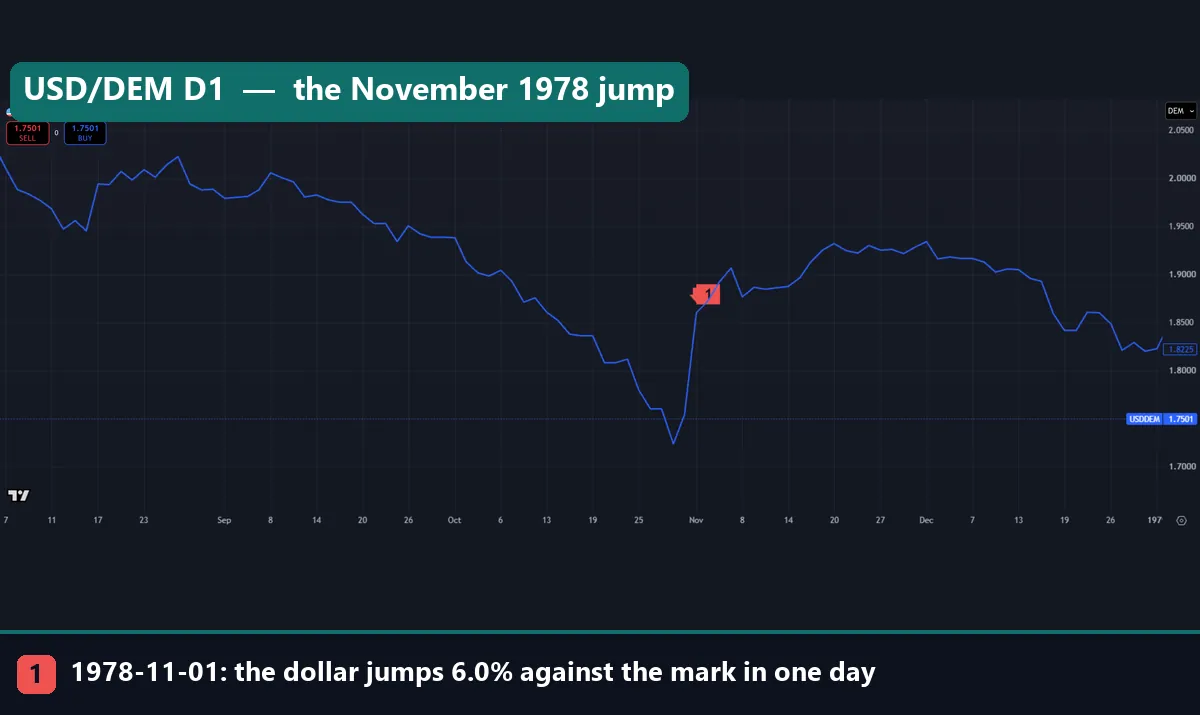
This daily line runs from early August 1978 to 2 January 1979. The dollar sinks from 2.0224 on 28 August to 1.7235 on 30 October, a fall of 14.8%. Then marker 1 shows the jump. The close went from 1.754 on 31 October to 1.86 on 1 November, or +6.04%. That is the dollar’s biggest daily rise in our traded data.
The cause is on record. A State Department memo of 1 November 1978 at the Office of the Historian lists the measures. They included a discount rate rise from 8.5% to 9.5% and $30 billion of facilities. The US, West Germany, Japan and Switzerland also agreed to intervene together. Our page on whether central banks trade forex covers this kind of action.
Even so, the jump did not turn the year. The mark still ended 1978 up 15.3% against the dollar.
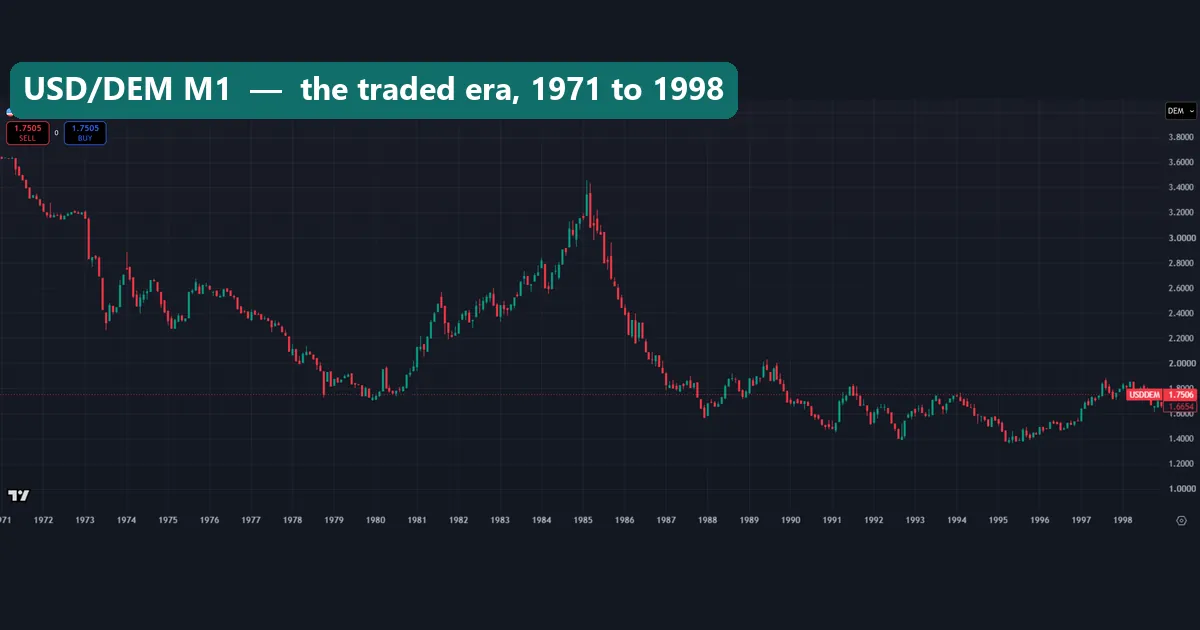
The last chart shows monthly bars from 1971 to 1998 only. Its last close is 1.6654, while the red tag above it shows a live quote from capture day. The shape tells the story: a dollar fall into late 1979, a climb to 1985, then a slide into 1995.
The steepest early step is February 1973. On 13 February the dollar fell 6.01% from the 9 February close, then 3.62% more the next day. The Bundesbank’s report says the mark’s value “fluctuated wildly” against the dollar after rates floated in 1973.
Common mistakes with old German money
- Reading the line after 1998 as the mark. Since 1 January 1999 it is EUR/USD in another form. A “record” on it is a euro record.
- Mixing up the direction. A falling USD/DEM line means a rising mark. Check which currency sits first before you call a move.
- Quoting chart boxes as prices. The O/H/L/C row and the SELL and BUY boxes show the live quote on capture day, about 1.75. They do not belong to the bars in view.
- Treating 1.95583 as a market rate. It is a legal conversion factor. The ECB’s release calls it irrevocable.
Where to go next
To see where the euro and the dollar sit among today’s big currencies, read our guide to the G10 currencies. For the dollar side of every chart here, see the dollar index in forex. The 1978 rescue leaned on a rate rise, and our page on how interest rates affect forex explains that link.
The number 1.95583 also turns up in Bulgaria. Our BGN currency guide explains why, with its own sources. For sterling’s 1992 crisis, see our Black Wednesday guide. And for money that lost value instead, see the weakest currency in the world.
Today a view on the mark’s dollar rate is a view on EUR/USD, one of the major currency pairs. Finally, before you trust a long chart, read our note on TradingView data and its feeds.
FAQ about German money before the euro
What did Germans use before the euro?
They used the Deutsche Mark, or DM, from the West German reform of 20 June 1948. East Germany kept its own mark until 1 July 1990.
How many Deutsche Marks were in one euro?
The EU Council fixed the rate at 1.95583 marks per euro, with effect from 1 January 1999.
When did Germany stop using the Deutsche Mark?
The mark lost its legal tender status on 1 January 2002, when euro cash arrived. Banks and shops still took it until 28 February 2002.
Can I still exchange Deutsche Marks?
The Bundesbank’s 2002 report said it would exchange mark notes and federal coins for euro indefinitely and free of charge. Check its current pages before you send any.
What was the mark worth against the dollar?
In our data, one mark bought 27.45 US cents in January 1971. By the end of 1998 it bought 60.05 cents.
What is a Deutsche Mark worth today?
Only a converted value exists. At the implied 1.7437 of 5 November 2026, a mark equals 57.35 US cents. At the fixed rate, 500 marks make 255.65 euro.
What were the mark’s biggest one-day moves?
The dollar rose 6.04% on 1 November 1978 and fell 6.01% on 13 February 1973. It also fell 4.06% on 23 September 1985, after the Plaza Accord.
Will the Deutsche Mark come back?
We cannot say, and we make no forecast. Our charts record the past, and the ECB’s 1998 release calls the fixed rate irrevocable. Treat every number here as history: results are not guaranteed; past performance is not indicative of future results.
Last updated: 6 November 2026.

About the author
Written by Dominic Walsh, a Forex trader and MT4/MT5 indicator, Expert Advisor and script developer. Every tool on forexmt4systems.com is tested on live charts before release and ships with ready-to-use compiled MT4 (.ex4) and MT5 (.ex5) files. Learn more about the trader and developer behind this site.
How we build, test and correct every tool: Editorial & Testing Policy. Trading carries risk; see the disclaimer.