
Black Wednesday was 16 September 1992, the day the UK took the pound out of the European Exchange Rate Mechanism (ERM) after a failed defence. The Bank of England set its lending rate at 12%, announced 15% and bought pounds on a huge scale, yet sterling stayed at its floor. This guide settles three things. First, what happened hour by hour, from the Bank’s own record. Second, what it cost and who profited. Third, how the pound’s later crashes compare, using our count of 300 monthly GBP/USD closes since November 2001.
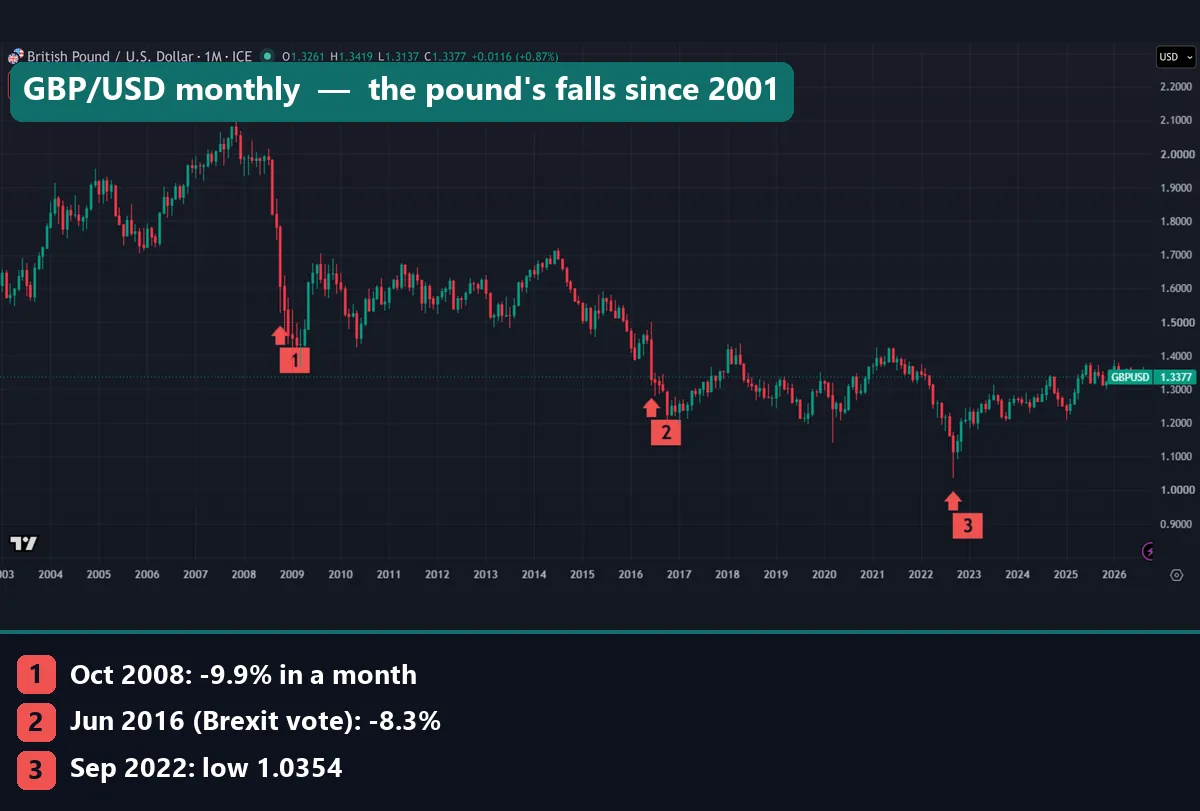
Our long chart shows those later falls. Marker 1 is October 2008, the worst month in our data at -9.9%. Next comes June 2016, the month of the Brexit vote, at -8.3% (marker 2). Marker 3 is the lowest point since 2001, a September 2022 wick at 1.0354.
What Black Wednesday was
The ERM tied a group of European currencies together. Each member had to keep its currency inside a band around agreed central rates, and defend it at the edge. For the pound, the edge that mattered was the floor against the Deutsche Mark: DM 2.7780, according to the Bank of England’s November 1992 Quarterly Bulletin.
Membership helped at first. In its first eighteen months, the bulletin says, the ERM let UK base rates fall from 15% to 10%. Then the strain grew. German rates stayed high after reunification, while the UK economy needed cheaper money. A French vote on the Maastricht Treaty, due on 20 September 1992, also gave the market a date to aim at.
By the evening of Wednesday 16 September the defence had failed, and the government suspended sterling’s ERM membership. Rate changes that day came hours apart, which is rare. Our page on central bank rate decisions shows how scheduled decisions normally reach the market.
What happened on 16 September 1992, hour by hour
The Bank’s bulletin gives an exact record of the day, and the times below are the ones it reports.
- 8.00 am. Sterling had fallen to DM 2.7794, a hair above its floor. The Bank then bought pounds heavily, with help from the Bundesbank and the Banque de France.
- 11.00 am. The Bank set its minimum lending rate (MLR) at 12%, two points above the 10% base rate. The clearing banks matched it soon after.
- 2.15 pm. The Bank announced a rise in MLR to 15%, due the next day. The clearing banks waited, and none moved to 15%.
- Close of EMS trading. Sterling still sat at its floor.
- Just after 7.30 pm. The Chancellor announced the suspension from the ERM and dropped the 15% plan.
- 17 September, 9.30 am. MLR went back to 10%.
The money market went haywire too: rates agreed that Wednesday for weekend money hit 180%. On 18 September sterling closed at DM 2.6100, 6% below its old floor. Against the dollar it closed at $1.7435, so it stood 5.6% lower than on 16 September. On 22 September the Bank cut rates again, to 9%.
How a currency peg breaks: the mechanism
A central bank has two tools to hold a peg. It can sell foreign reserves to buy its own currency, which dealers call intervention; our page on whether central banks trade forex explains it. It can also raise rates so that holding the currency pays more, as our guide to how interest rates affect forex shows.
Both tools have limits. Reserves run out. Rate rises fail on arithmetic, because a rate runs per year while a devaluation is a one-off jump. The cost of holding a short position for a few days is roughly:
carry cost = position × annual rate × days ÷ 365
At 15% for two days that is about 0.08% of the position. Even 100% for one night comes to about 0.27%. Now set that against a 6% fall below the floor within two days. The payoff side is the plain percentage move:
change % = (new rate ÷ old rate - 1) × 100
The shape of the bet helped the sellers too. If the peg held, a seller lost little; if it broke, the drop could be large and fast. Our page on the interest rate differential covers how rate gaps move currencies in calmer times.
George Soros and the cost to the Treasury
The best-known seller was George Soros. Britannica’s biography of George Soros says his Quantum group sold billions of pounds in the days before the devaluation, much of it with borrowed money. He then bought pounds back, repaid the loans and made about $1 billion. Hence the nickname “the man who broke the Bank of England”. Britannica adds that others profited too, on a far smaller scale.
The cost to the UK depends on how you count. The best primary source is HM Treasury’s 1997 minute on the cost of Black Wednesday, at the Margaret Thatcher Foundation archive. It came out under the Freedom of Information Act on 9 February 2005. It says the UK sold some $28bn of reserves on Black Wednesday itself, and nearly $40bn across August and September 1992. Its cost figures vary with the method:
- about £800m lost on reserve operations in August and September 1992, relative to sterling;
- an opportunity cost of about £2.4bn, measured to the start of October 1992;
- £1.9bn to £4bn in total, depending on the period and the counterfactual.
Its own pick: “The most sensible assumptions give a loss of £3.3bn measured at February 1994.” That is an estimate, not an audited bill. Also, a big open bet differs from rigging a price, as our guide to market manipulation in forex shows.
How we tested
Our data cannot reach 1992, so every 1992 figure above comes from the Bank of England, Treasury and Britannica sources we link. Every figure below comes from bars we pulled on 23 October 2026 on a TradingView web chart.
The main series is FX_IDC:GBPUSD monthly, from November 2001 to October 2026: 300 bars and 299 month-to-month changes. FX_IDC is TradingView’s feed of ICE exchange-rate quotes. For the 2022 mini-budget we added OANDA:GBPUSD weekly. Changes run close to close, and the October 2026 bar had not closed on capture day.
We did not use MetaTrader 4 here. Our MetaTrader 4 history (build 1471, Capital Point Trading) starts in June 2018, so it misses both 2008 and 2016. The editorial testing policy explains how we pick data and report limits.
The settings and numbers behind this guide
There are no indicator inputs here. Three choices drive every number: the source, the timeframe and the counting rule.
| Setting or measure | Value |
|---|---|
| Symbol and timeframe | FX_IDC:GBPUSD, monthly |
| Window | November 2001 to October 2026 (300 bars) |
| Counting rule | Close to close, in percent |
| Worst month | -9.9% (October 2008) |
| Highest monthly high | 2.1161 (November 2007) |
| Lowest monthly low | 1.0354 (September 2022) |
| Monthly closes above 1.00 | 300 of 300 |
| Latest monthly close | 1.3382 (October 2026, bar still open) |
| Costs | All moves before spread, swap and commission |
Read the highs and lows as wicks, not closes. That detail matters for 2022.
Reading the pound’s crashes on a chart
On a GBP/USD chart, a falling line means each pound buys fewer dollars. Traders call the pair cable, one of the terms in our trading slang guide. Each candle here covers one month, and a red body closed below its open.
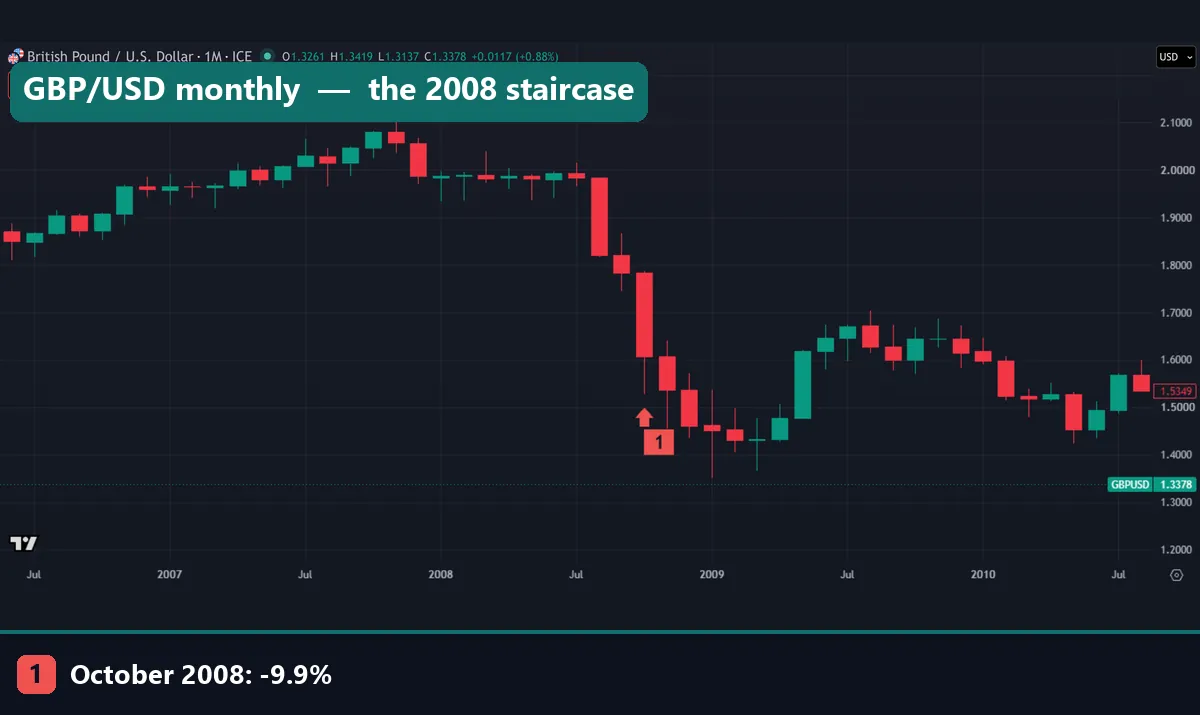
The 2008 close-up runs from mid-2006 to mid-2010. After the November 2007 peak at 2.1161, the pound drifted near 2.00 into mid-2008. Then the chart turns into a red staircase: August to December 2008 all closed lower than the month before. Marker 1 sits under October, the longest body. A January 2009 wick reached below 1.40, and by mid-2009 the rate stood back above 1.60.
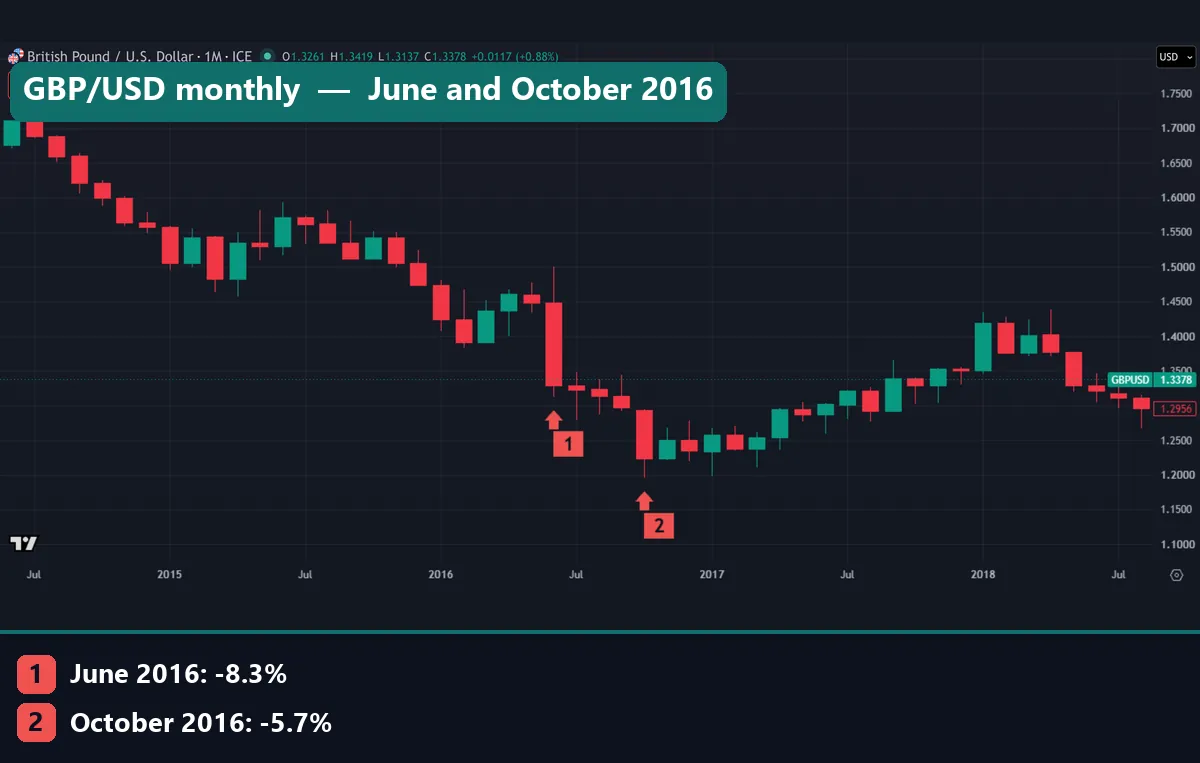
The 2016 close-up covers mid-2014 to mid-2018, and the slide began well before the vote, from about 1.71 to below 1.40. Marker 1 is June 2016: a tall upper wick near 1.50, then a close at 1.3286. Next, marker 2 is October 2016, at -5.7%, with a wick just under 1.20. The pound then climbed through 2017 and topped above 1.40 in early 2018.
Worked example: what the 2008 and 2016 falls did to 10,000 pounds
Here is what the two worst months meant in plain money, using our monthly closes before any spread.
October 2008. At the September close of 1.7830, 10,000 pounds bought 17,830 dollars. At the October close of 1.6068 they bought 16,068, or 1,762 dollars less: a move of 1,762 pips.
June 2016. At May’s close of 1.4482, 10,000 pounds bought 14,482 dollars. At June’s close of 1.3286 they bought 13,286, or 1,196 less.
The whole 2008 run. From the July close of 1.9832 to the December close of 1.4616, the pound lost 26.3% in five months.
The 1992 comparison. The Bank’s figures show sterling at a peak of $2.0090 on 2 September 1992 and at $1.7770 on 30 September, about 11.5% lower by our arithmetic. That runs from a peak to a month-end, not close to close, so it is not like for like. Still, it sits in the same league as our worst months.
The six worst months and the 2022 mini-budget
Our first data chart ranks the six worst months since 2001. Three fall in 2008 (August, October and December) and two in 2016 (June and October). We did not tie the sixth, May 2012 at -5.1%, to any single event.
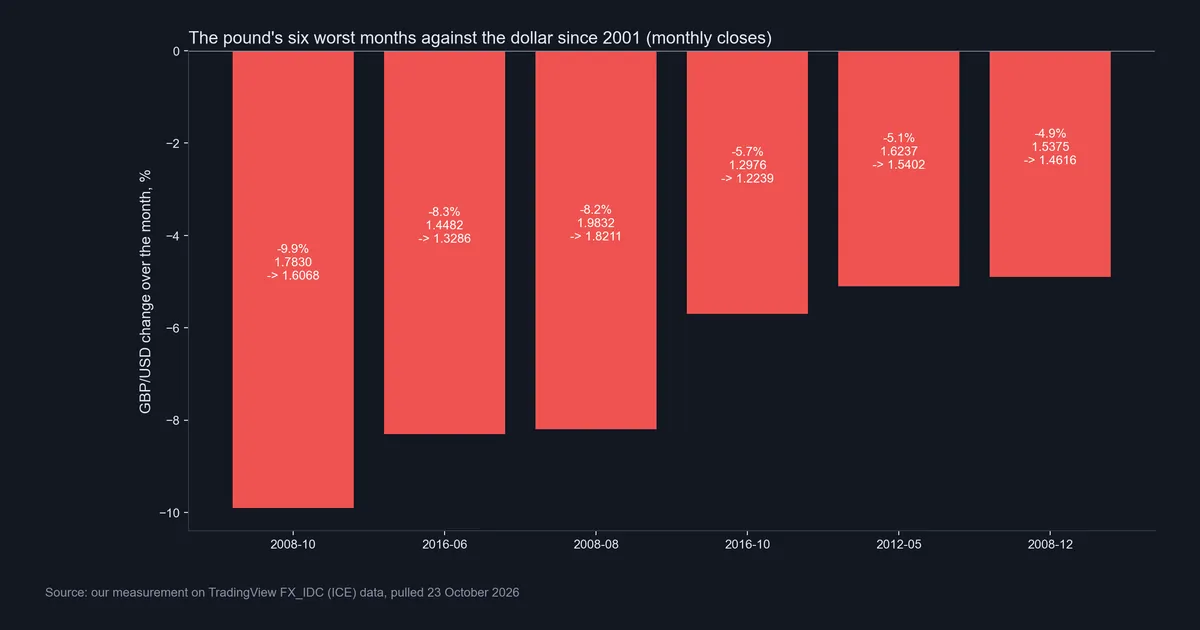
September 2022 is missing. Its low of 1.0354 came as a wick inside the month, and the month still closed above 1.10. So a monthly close smooths over a crash that lasts only days.
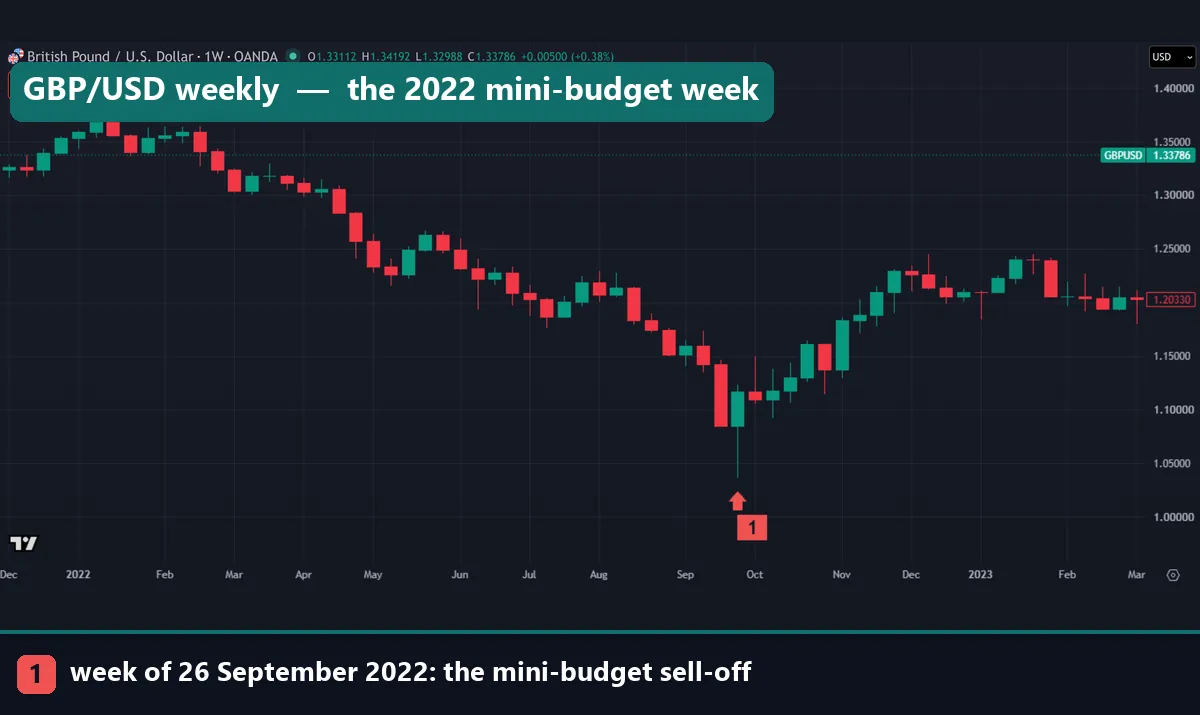
The OANDA weekly chart zooms in. HM Treasury’s Growth Plan 2022 on GOV.UK, the “mini-budget”, came out on Friday 23 September 2022, and the tall red candle before the marker is that week. The marked week of 26 September plunged, with a wick below 1.05, yet closed green above 1.10. Our page on bond yields in forex explains why borrowing plans can move a currency.
Download the complete indicator database
Put these concepts on your charts. One email unlocks the full library of 1,380+ indicators with compiled MT4 and MT5 files, plus my TradingView scripts. No paywall, no spam, unsubscribe any time.
Get free access to my indicator database
One email unlocks 1,380+ free MT4, MT5 and TradingView indicators — the complete library. No single-tool download; you get the whole database.
Where it fails: what our data cannot show about Black Wednesday
It cannot see 1992. FX_IDC’s GBP/USD data starts in November 2001, so every 1992 number here comes from the cited papers.
Monthly bars hide speed. Black Wednesday played out in hours. A close-to-close month can also miss a crash that reverses inside it, as September 2022 shows.
The peg ran against the mark. Sterling’s floor was DM 2.7780, so the mark rate is the cleaner measure of the break. A GBP/USD series also mixes pound news with dollar news.
Sources differ. FX_IDC and OANDA print slightly different highs and lows, and the Bank’s 1992 table uses London close-of-business rates.
The cost is an estimate. The Treasury minute spans £1.9bn to £4bn before it picks £3.3bn.
History does not time the next crash. Our counts describe past months, not the next one. Fast moves can jump past a stop order, as our page on how to use a stop loss explains. Borrowed money makes them worse, which our page on leverage risk covers.
September 2022 and the spread of all 299 months
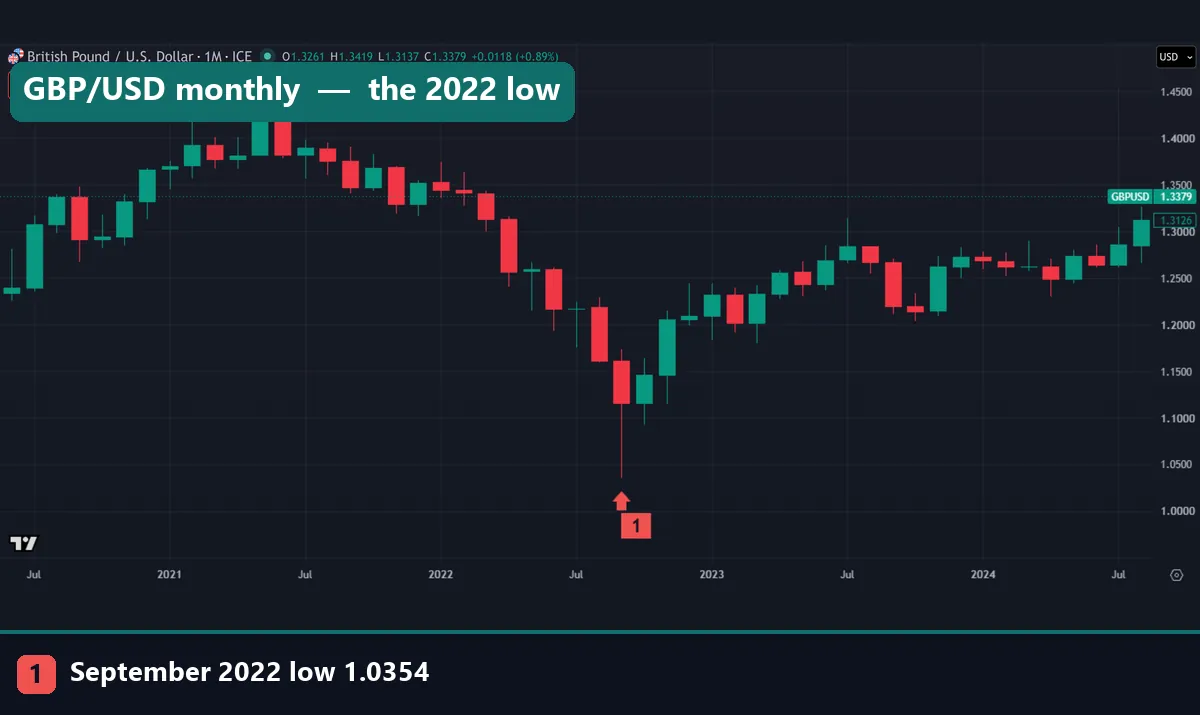
Our mid-2020 to mid-2024 close-up puts the 2022 low in context. The pound topped near 1.42 in 2021 and slid for most of 2022, down to the September wick at 1.0354 (marker 1). The next two months closed green, and by mid-2023 the rate stood near 1.30.
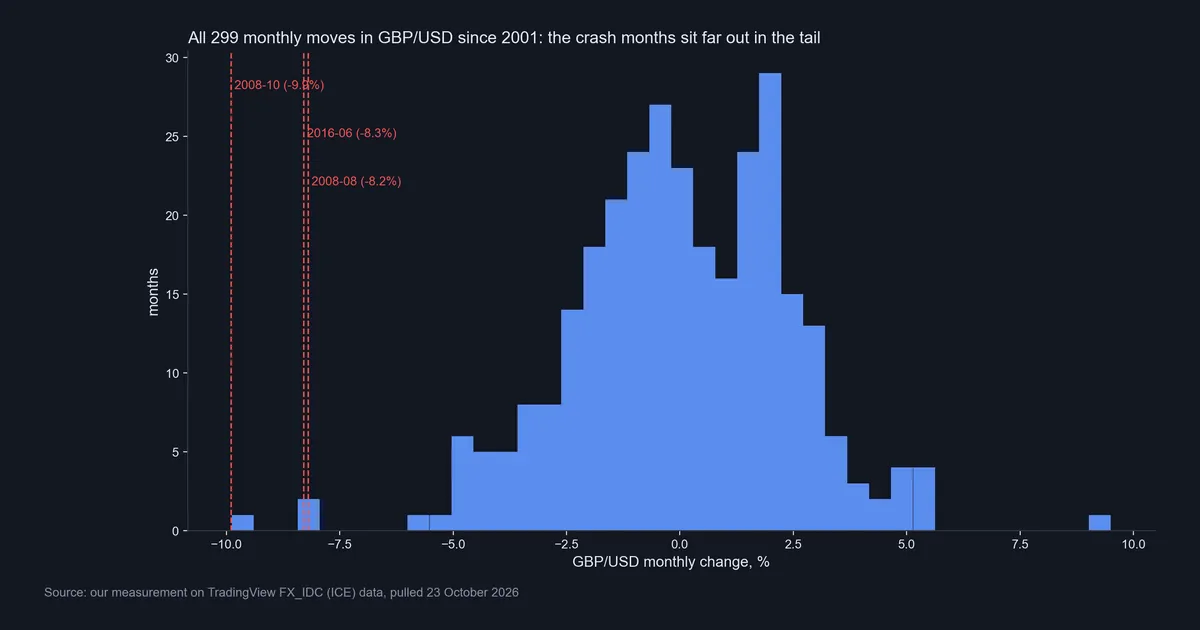
Our second data chart sorts all 299 monthly changes. Most land between about -2.5% and +2.5%. The crash months stand alone at the far left: October 2008 near -10%, then June 2016 and August 2008 near -8%. The next worst, October 2016 at -5.7%, sits 2.5 points closer to zero. On the right, one month gained more than 9%, so big moves run both ways.
Common mistakes when reading Black Wednesday
1. Calling it a stock market crash. It was a currency crisis. The Bank’s bulletin records the FTSE 100 closing 8.3 points up on the day, after a fall of 78 points at its worst.
2. Assuming higher rates always save a currency. The Bank set 12% and announced 15% in one day, and sterling never left its floor. Our interest rate tracker shows where policy rates sit today.
3. Comparing numbers built different ways. A peak-to-month-end fall, a close-to-close month and an intramonth wick measure different things. Check the rule and the source before you rank crashes.
4. Blaming one trader. The Bank’s account starts with German rates, a weak UK recovery and the French vote, and Britannica notes that others profited too. The policy conflict came first, and the selling followed.
Where to go next
For how big announcements hit prices, see our page on high-impact news in forex. To compare the pound’s peers per unit, read whether the euro is stronger than the dollar. For the idea that markets price news fast, see the efficient market hypothesis. For the primary record, check any retelling, ours included, against the Bank of England bulletin and the Treasury minute above.
FAQ: Black Wednesday
What was Black Wednesday?
It was 16 September 1992, when the UK suspended the pound’s ERM membership after a 12% lending rate, a planned 15% and heavy buying failed to lift it off its DM 2.7780 floor.
Why do people call it Black Wednesday?
Because 16 September 1992 fell on a Wednesday, and the day ended in a forced exit and a sharp fall in the pound.
How high did UK interest rates go on Black Wednesday?
The Bank set its minimum lending rate at 12% at 11.00 that morning and announced 15% at 2.15 pm, due the next day. The 15% never took effect, and the rate went back to 10% on 17 September.
How much did Black Wednesday cost the UK?
HM Treasury’s 1997 minute gives £1.9bn to £4bn, depending on the assumptions, and prefers a loss of £3.3bn measured at February 1994.
How much did George Soros make from Black Wednesday?
About $1 billion, according to Britannica. His Quantum group sold billions of pounds before the exit, much of it with borrowed money, then bought pounds back.
Was Black Wednesday the pound’s worst fall?
We cannot rank it exactly, because our data starts in 2001. Since then the worst month was October 2008, at -9.9%. The Bank’s figures put September 1992 at about 11.5% from peak to month-end, which is a different measure.
Has the pound ever fallen below one dollar?
Not in our data. All 300 monthly closes since November 2001 sat above 1.00, and the lowest point was a September 2022 wick at 1.0354.
Could another Black Wednesday happen?
Not in the same form, since a forced exit needs a fixed rate to break, and the pound has no ERM-style band today. Sharp falls still happen, as 2008, 2016 and 2022 show. We make no forecast and give no trading advice; results are not guaranteed; past performance is not indicative of future results.
Last updated: 23 October 2026.

About the author
Written by Dominic Walsh, a Forex trader and MT4/MT5 indicator, Expert Advisor and script developer. Every tool on forexmt4systems.com is tested on live charts before release and ships with ready-to-use compiled MT4 (.ex4) and MT5 (.ex5) files. Learn more about the trader and developer behind this site.
How we build, test and correct every tool: Editorial & Testing Policy. Trading carries risk; see the disclaimer.