
The efficient market hypothesis says that prices already reflect the information traders have. If that holds, yesterday’s moves cannot tell you where price goes next. This guide explains the idea, its three forms and the tests behind it. Then it settles one question for forex traders: does daily FX move like a random walk? We ran the standard tests on 23 currency pairs from 2018 to 2026. The short answer: almost, but not quite, and the gaps are small.
What the efficient market hypothesis says
The modern version of the idea comes from Eugene Fama of the University of Chicago. In 1970 he published a review in the Journal of Finance, “Efficient Capital Markets: A Review of Theory and Empirical Work”. In it, he called a market efficient when its prices “fully reflect” the information available.
Suppose a cheap signal predicted tomorrow’s price. Traders would act on it today, and their orders would push the price until the signal stopped working. So prices move only on new information. And because news arrives at random, price changes look random too.
That is where the random walk comes in: a path where each step has no link to the last, like coin flips. Strictly, efficiency asks for less, since returns only need to be unpredictable once you allow for risk. Still, most studies test the random walk, and so did we.
Fama shared the 2013 economics prize with Lars Peter Hansen and Robert Shiller. Shiller is one of the theory’s best-known critics. NobelPrize.org’s popular summary of the 2013 prize sums up their work on stocks and bonds. Days and weeks are hard to call, it says, but the broad course over three to five years is easier to foresee.
The three forms: weak, semi-strong and strong
Fama sorted the tests by the information they use:
- Weak form: prices reflect all past prices. Rules built only on price history cannot earn excess returns after costs.
- Semi-strong form: prices reflect all public information, such as rate decisions and data releases. Acting on news after it comes out is too late.
- Strong form: prices reflect even private information. Fama treated this one as a benchmark rather than a literal claim.
Each form includes the one before it, so a market can pass the weak-form test and still fail the others. The weak form is the one that matters for chart traders. Our page on fundamental vs technical analysis compares the two schools.
In forex, the semi-strong form shows up around news. Prices adjust fast after central bank rate decisions. Our guide to the forex news spike shows how sharp that can be. This article tests only the weak form.
How the tests work: autocorrelation, variance ratios and runs
All the tests use log returns: r = ln(close / previous close). Each one checks a prediction of the random walk.
1. No memory from one day to the next. The lag-1 autocorrelation measures how today’s return lines up with yesterday’s. A random walk gives zero, plus noise. With n returns, the 95% noise band is about ±2/√n, so ±0.0497 for 1,619 daily returns.
2. Variance grows in step with time. For a random walk, a 5-day return has five times the variance of a 1-day return. The variance ratio checks that: VR(q) = Var(q-day return) / (q × Var(1-day return)). A random walk gives 1. Below 1, moves tend to reverse. Above 1, they tend to carry on.
In effect, VR(q) is 1 plus a weighted sum of the autocorrelations at lags 1 to q-1. So it catches small effects that a lag-1 test misses. Andrew Lo and Craig MacKinlay set out the test in their 1987 working paper at NBER, “Stock Market Prices Do Not Follow Random Walks”. Their plain z assumes steady volatility, while the adjusted z* allows for volatility that clusters, as it does in FX.
3. Ups and downs arrive like coin flips. The runs test counts streaks of same-sign returns and compares the count with a coin. Too few runs means trends; too many means chop. NIST’s statistics handbook page on the runs test sets out the math.
How we tested the efficient market hypothesis on forex
We ran the tests on price history from MetaTrader 4, build 1471, on the Capital Point Trading server.
- Markets: 23 currency pairs, from majors such as EURUSD to crosses such as EURGBP and CADCHF.
- Daily window: closes from 12 June 2018 to 24 August 2026. Usable length varies by pair, from 296 daily returns for NZDCAD to 2,064 for AUDJPY and EURAUD.
- Hourly check: EURUSD, GBPUSD, USDJPY and gold (XAUUSD), with 3,963 to 6,716 hourly returns each.
- Chance level: with 23 pairs and a 5% threshold, luck alone would flag about 1.2 pairs per test.
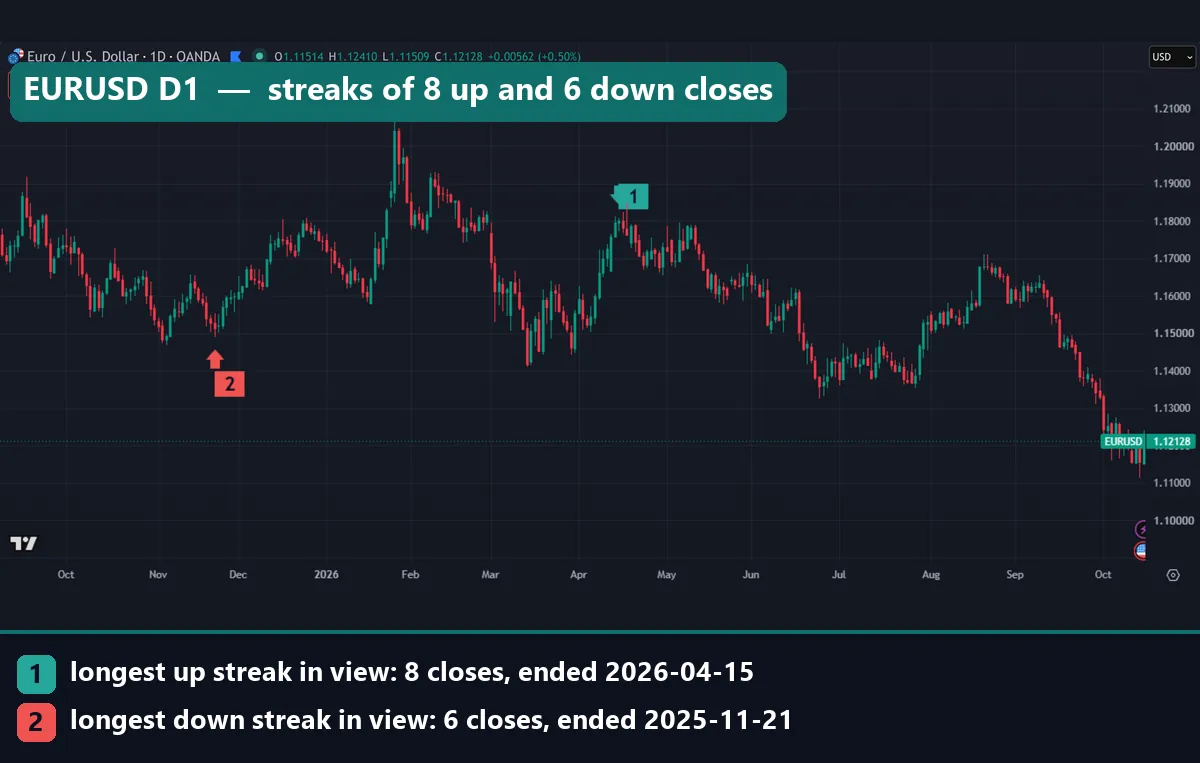
The streak charts come from the TradingView web chart with OANDA daily data, captured on 15 October 2026. Each covers a little over a year and marks the longest runs of higher and lower closes in view. They illustrate the idea but are not part of the statistics. Our editorial testing policy explains how we choose data and report results.
Test settings and thresholds
| Test | What it measures | Random walk | Our setting |
|---|---|---|---|
| Lag-1 autocorrelation | Link between one return and the next | 0 | 95% band ±2/√n (±0.044 to ±0.116 here) |
| Variance ratio VR(5) | 5-bar variance vs 5 × 1-bar variance | 1 | q = 5, one trading week |
| Variance ratio VR(20) | 20-bar variance vs 20 × 1-bar variance | 1 | q = 20, about one month |
| Plain z | VR test with steady volatility | 0 | Flag beyond ±1.96 |
| Adjusted z* | VR test that allows volatility clusters | 0 | Flag beyond ±1.96 |
| Runs test z | Up and down runs vs a coin | 0 | Flag beyond ±1.96 |
The band depends on sample size. AUDCAD and NZDCAD have only about 300 returns each, so their bands sit near ±0.11. Our guide to backtest sample size explains why small samples mislead.
Reading a random walk on a chart
You cannot see efficiency on a chart. You can see streaks, and random walks produce plenty of them.
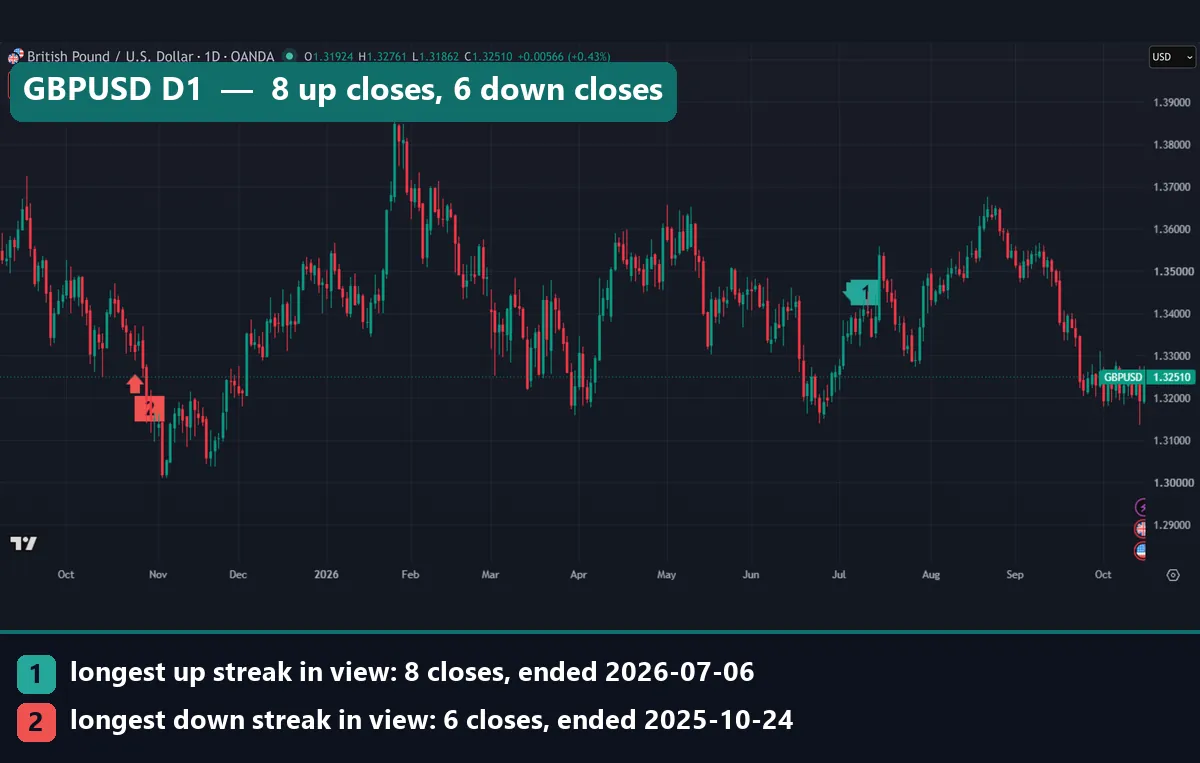
On GBPUSD, the pound closed higher eight days running, from 1.31681 on 24 June 2026 to 1.33897 on 6 July (marker 1). The longest down run was six closes, ending at 1.33108 on 24 October 2025 (marker 2). Yet over our full window, GBPUSD’s lag-1 autocorrelation was 0.0101, and its 5-day z* was -0.81. That is close to a textbook random walk, streaks and all.
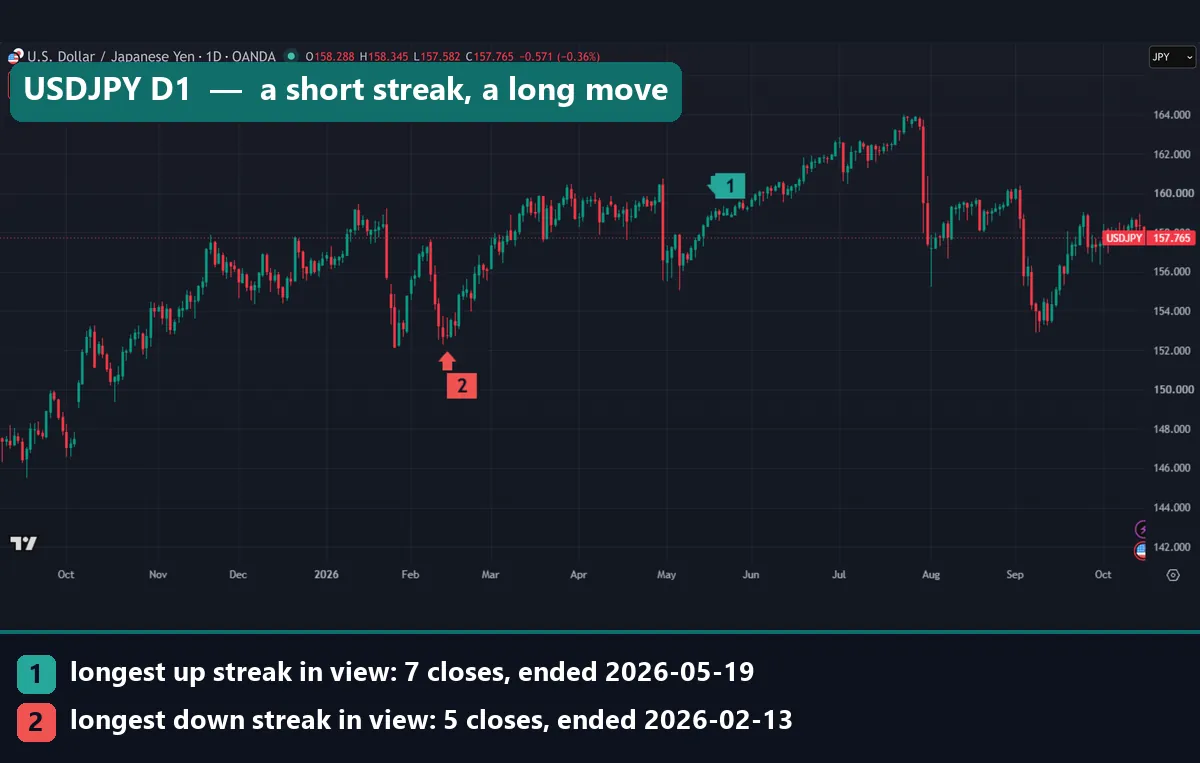
USDJPY makes a second point. Its seven-close up run in May 2026, from 156.686 to 159.08, gained 239 pips (marker 1). But its five-close down run in February, from 157.24 to 152.711, covered 453 pips (marker 2). So a streak’s length says little about its size. Also, USDJPY’s lag-1 autocorrelation was -0.0008, about as close to zero as it gets.
Worked example: EURUSD’s eight-day streak in numbers
Take the opening EURUSD chart. EURUSD closed at 1.15222 on 3 April 2026, then closed higher eight days in a row, ending at 1.17994 on 15 April (marker 1). That run added 277 pips.
First, the coin math. With a fair coin, a given stretch of eight days comes up all heads once in 256 tries. But a year of daily bars gives the coin hundreds of starting points, so a run of eight somewhere in it is ordinary. Our five charts show longest up runs of seven to nine closes, which is what coin flips tend to produce.
Next, the test. Across 1,619 daily returns, EURUSD’s lag-1 autocorrelation was 0.0057, far inside its band of ±0.0497. Its variance ratios were 0.957 at 5 days and 0.908 at 20 days, with z* of -0.65 and -0.64. So EURUSD’s history gave no sign that eight up days made a ninth more or less likely.
Now compare EURGBP. Its lag-1 value was only -0.0254, inside its band. Yet its 20-day variance ratio was 0.575, with z* at -2.83. So 20-day moves had 57.5% of the variance a random walk would give. In standard-deviation terms that is about 76%, so EURGBP’s monthly swings ran about a quarter smaller than its daily moves imply. Many tiny reversals added up over weeks.
What the tests found on 23 pairs
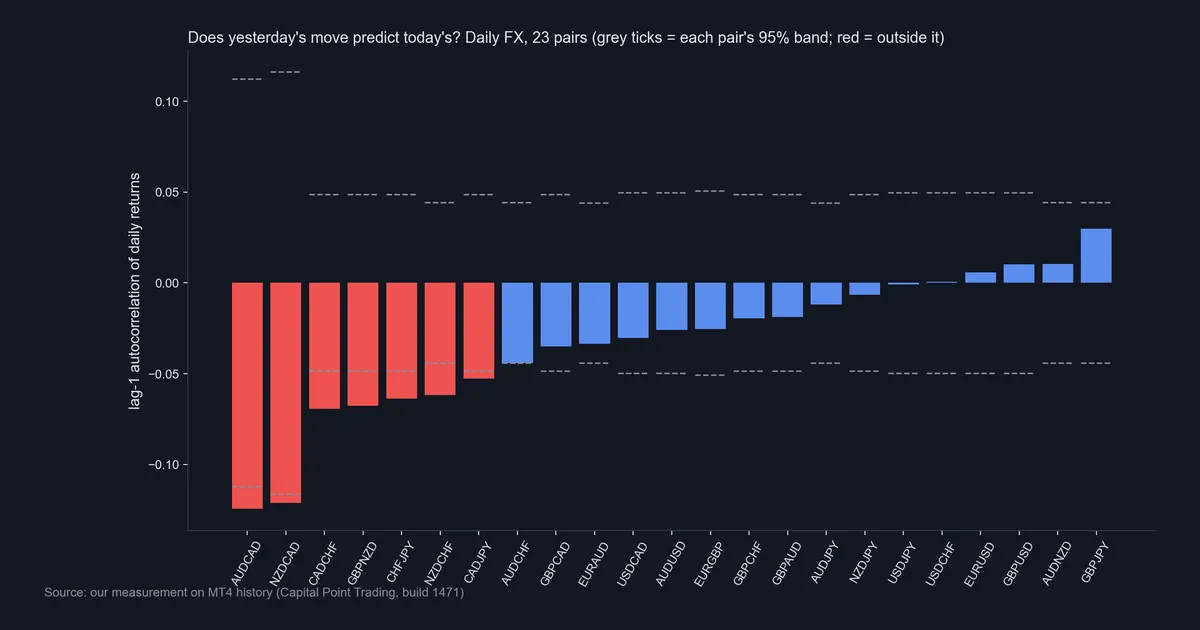
The autocorrelation chart is our measurement. Of the 23 pairs, 18 had negative lag-1 autocorrelation, a mild lean toward reversal. Seven sat outside their band, all on the negative side. AUDCAD and NZDCAD had the largest values, -0.1244 and -0.1211, but also the shortest samples. Meanwhile, EURUSD, GBPUSD, USDJPY and USDCHF all landed within 0.011 of zero. All seven flagged pairs are crosses with CAD, CHF or NZD on one side.
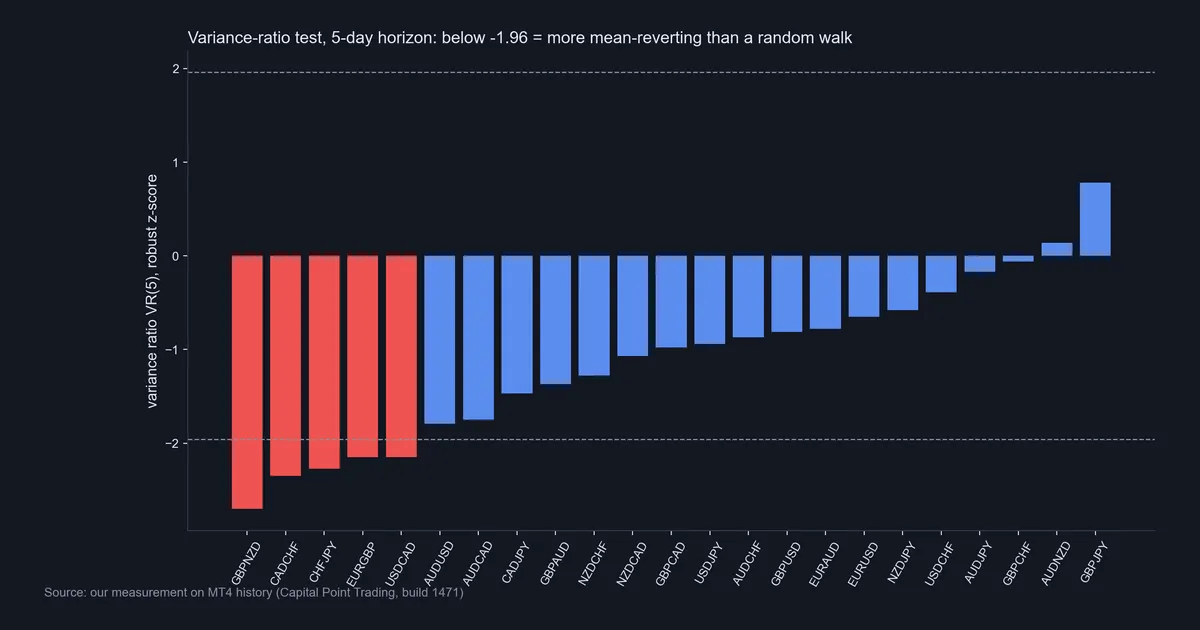
The variance-ratio chart tells the same story with a stricter test. At 5 days, z* flagged five pairs: GBPNZD, CADCHF, CHFJPY, EURGBP and USDCAD. Chance alone would flag about 1.2. The plain z flagged eight, but AUDCAD, AUDUSD and CADJPY dropped out once z* allowed for volatility clusters. Finally, the runs test flagged six pairs, and every one had more sign changes than a coin, never fewer. Again, that points to chop, not trends.
Hourly bars: the same tests on H1
On hourly closes, all four symbols had negative lag-1 autocorrelation, but only gold sat outside its band, at -0.0312 against ±0.0244. Gold’s plain 5-bar z of -2.64 also looked significant. Yet z* put it at -1.09, because gold’s hourly volatility comes in bursts. Here is the full scorecard.
| Result | Daily, 23 FX pairs | Hourly, 4 symbols |
|---|---|---|
| Negative lag-1 autocorrelation | 18 | 4 |
| Outside the 95% band | 7 | 1 |
| VR(5) flagged, plain z / z* | 8 / 5 | 1 / 0 |
| VR(20) flagged, plain z / z* | 4 / 2 | 0 / 0 |
| Runs test flagged | 6 | 2 |
| Flags expected by chance, per test | About 1.2 | About 0.2 |
Download the complete indicator database
Put these concepts on your charts. One email unlocks the full library of 1,380+ indicators with compiled MT4 and MT5 files, plus my TradingView scripts. No paywall, no spam, unsubscribe any time.
Get free access to my indicator database
One email unlocks 1,380+ free MT4, MT5 and TradingView indicators — the complete library. No single-tool download; you get the whole database.
Where it fails
Start with the hypothesis. Daily FX in our sample was not a perfect random walk. Five pairs failed the adjusted 5-day test, against about 1.2 expected by chance. So the strict random-walk version fails on part of the market.
But a statistical flag is not a trading edge. An autocorrelation of -0.07 means yesterday’s return explains under half of one percent of the variance of the next day’s return. We also tested a direct way to use it: fading a two-standard-deviation stretch from the 20-day average. On daily FX, 1,636 trades gave +0.091 ATR per trade before costs, and 57.0% closed in profit. On hourly bars the rule lost 0.055 ATR per trade over 852 trades, because the losers were bigger. Spread and swap could erase the daily edge, as our guide to backtesting transaction costs shows.
Our earlier rule tests point the same way. For example, the core rules in our turtle trading strategy test lost money on the same 23 pairs before costs.
Then there are the test’s own limits. It covers only the weak form, only 2018 to 2026, and only one broker feed. Pairs also share currencies, so 23 pairs are not 23 independent tests. In short, this is the weak-form debate, not proof either way.
Two more streak charts: AUDUSD and GBPJPY
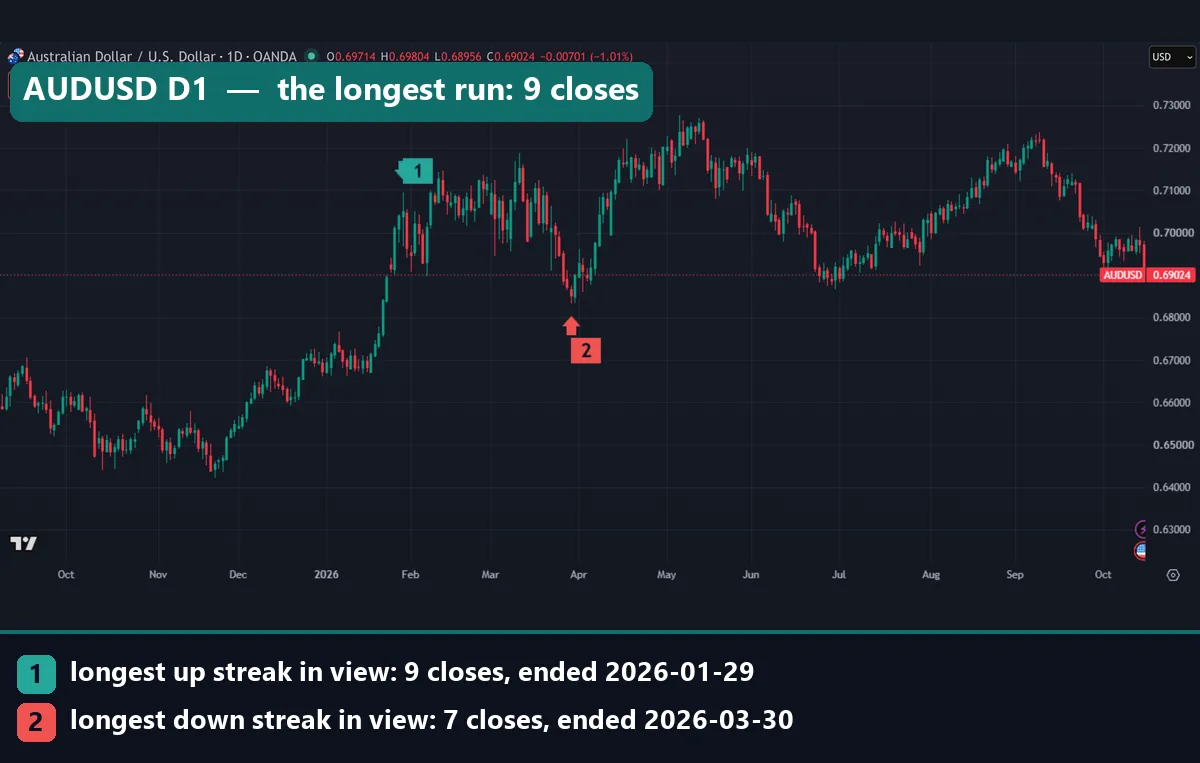
AUDUSD gives the longest run in our charts: nine higher closes, from 0.66836 on 16 January 2026 to 0.705 on 29 January (marker 1). Its longest down run was seven closes, ending on 30 March (marker 2). Statistically, AUDUSD came close to the line: its 5-day z* was -1.79, just short of -1.96.
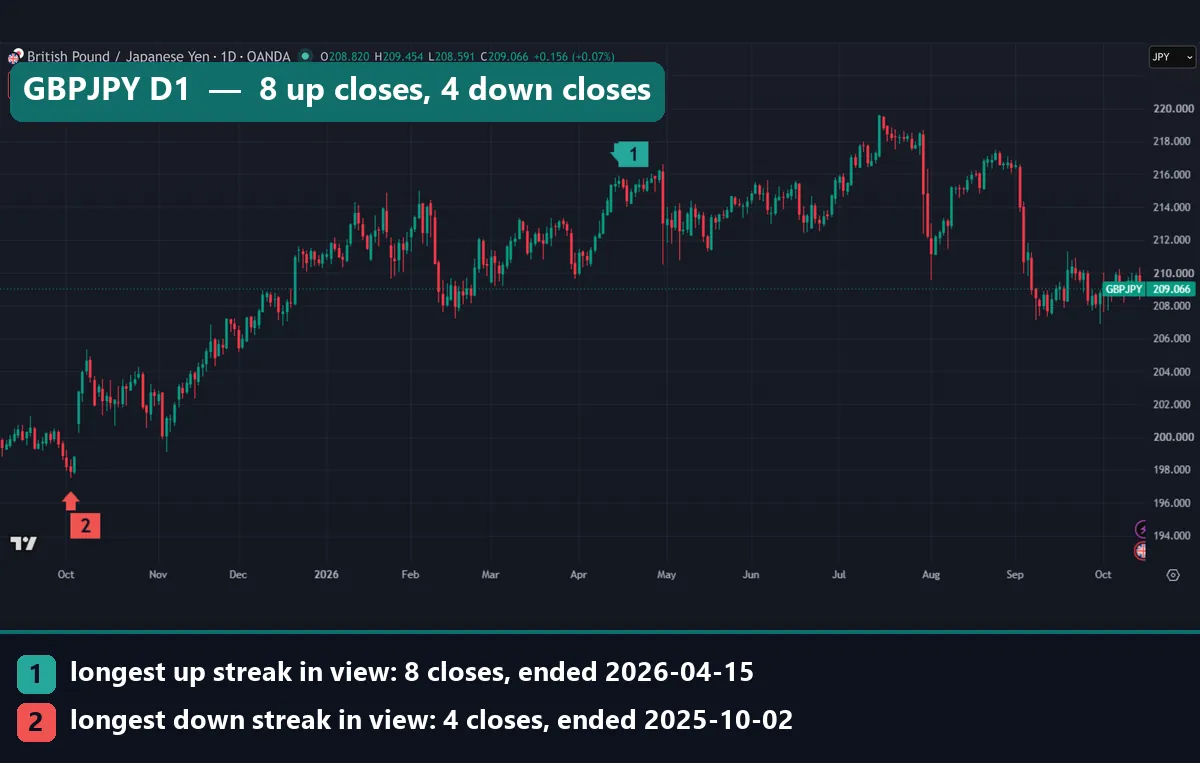
GBPJPY’s longest up run was eight closes, from 3 April to 15 April 2026 (marker 1). That matches EURUSD’s run to the day, though the two pairs share no currency. So pairs can move together, as our guide to currency correlation in forex explains. GBPJPY also had the highest lag-1 value in the set, +0.0299, the strongest hint of trending, yet it stayed inside its band.
Common mistakes with the efficient market hypothesis
- Reading a streak as a signal. Eight up closes feel like momentum, but random walks produce runs like that every year. Our guide to losing streaks in trading shows the same math from the account side.
- Treating “significant” as “profitable”. A z* of -2.70 says an effect is probably real. It says nothing about whether it beats spread and swap.
- Testing many settings and keeping the best. In our split test of moving-average crosses on these pairs, the best in-sample setting (SMA 30/150, +0.44 ATR per trade) lost 0.87 ATR per trade out of sample. Our guide to curve fitting in trading explains why.
- Using the plain z-score on FX. Volatility comes in clusters, so the plain z flagged eight pairs where z* flagged five.
Where to go next
- Walk-forward analysis tests a rule on data it has not seen.
- Trend following trading works best when variance ratios sit above 1, which no pair showed at a significant level.
- Bollinger Bands explained covers the band behind the fade test.
- Cognitive biases in trading explains why streaks feel meaningful.
For outside reading, the efficient-market hypothesis entry on Wikipedia covers the history and the critiques.
FAQ about the efficient market hypothesis
What is the efficient market hypothesis in simple terms?
It is the idea that prices already reflect what traders can find out, so nobody beats the market after costs and risk with information it already has.
Who created the efficient market hypothesis?
Eugene Fama set it out in a 1970 review in the Journal of Finance. He later shared the 2013 economics prize with Lars Peter Hansen and Robert Shiller.
What are the three forms of market efficiency?
The weak form covers past prices, the semi-strong form covers all public information, and the strong form adds private information.
Is the forex market efficient?
Nearly, in our weak-form test. On daily data, five of 23 pairs failed the adjusted 5-day variance-ratio test, against about 1.2 expected by chance, and every effect was small.
Does the efficient market hypothesis mean technical analysis is useless?
Not quite. The weak form says past prices alone cannot earn excess returns after costs. Our rule tests mostly found no edge before costs, so test any claimed edge first.
What is a random walk in trading?
It is a price path where each move has no link to the last one, like coin flips. It still produces trends and streaks, so a streak alone proves nothing.
Does a failed test prove the market is inefficient?
No. Fama called this the joint-hypothesis problem: every test of efficiency also tests a model of normal returns. So a flag can mean the model is wrong, not the market.
Can I trade the mean reversion you found?
Our daily fade of two-standard-deviation stretches made +0.091 ATR per trade over 1,636 trades before costs, and the hourly version lost money. Spread and swap could erase that edge; results are not guaranteed; past performance is not indicative of future results.
Last updated: 15 October 2026.

About the author
Written by Dominic Walsh, a Forex trader and MT4/MT5 indicator, Expert Advisor and script developer. Every tool on forexmt4systems.com is tested on live charts before release and ships with ready-to-use compiled MT4 (.ex4) and MT5 (.ex5) files. Learn more about the trader and developer behind this site.
How we build, test and correct every tool: Editorial & Testing Policy. Trading carries risk; see the disclaimer.