
The turtle trading strategy is a breakout system with fixed rules for entries, exits, stops and position size. It buys when price breaks the highest high of the last 20 or 55 days and sells short below the matching low. This guide explains the rules, then settles one question: do they still work on forex? We ran both Turtle systems on 23 currency pairs from 2018 to 2026. Before costs, both lost money.
What the turtle trading strategy is
The rules come from a famous bet. In 1983, the Chicago trader Richard Dennis argued with his friend William Eckhardt about whether trading could be taught. Dennis said yes. To settle it, he hired a small group of beginners, trained them and gave them money to trade. He called them his Turtles. The Richard Dennis entry on Wikipedia covers the story.
The Turtles traded futures until the program ended in 1988. Their method was trend following in its plainest form: buy strength and sell weakness. Our guide to trend following trading covers the wider family.
Curtis Faith, one of the Turtles, later wrote “Way of the Turtle”. The full rules are now free to read on the Original Turtle Rules page at Trading Blox. They describe two systems:
- System 1: enter on a 20-day breakout, exit on a 10-day breakout the other way.
- System 2: enter on a 55-day breakout, exit on a 20-day breakout the other way.
System 1 had one twist. If its last breakout in a market would have made money, the trader skipped the next one.
How the Turtle rules work: N, the 2N stop and units
Everything hangs on one number, N. It is the 20-day average true range, so it measures how far the market moves on a normal day. True range is the largest of three gaps: high to low, high to the previous close, and previous close to low. The Turtles smoothed it like an exponential average:
N = (19 × previous N + today's true range) / 20
The average true range article at StockCharts ChartSchool walks through the math. Our guide to what ATR means in trading puts it in forex terms. N then does three jobs:
- Stop: the stop sits 2N from the entry price.
- Unit size: unit = (1% of equity) / (N × value of one point per lot or contract).
- Adding units: the rules added units as a trade moved in its favour, up to a cap.
So a full stop-out costs 2% of equity per unit. That is what 1R means in our test: one 2N stop. And because the unit shrinks when N grows, quiet and wild markets carry the same risk. Our ATR position sizing guide covers it.
Entries and exits did not wait for a close. They fired as soon as price traded through the level. Whichever came first, the stop or the exit channel, closed the trade.
How we tested the Turtle rules
We coded both systems and ran them on daily history from MetaTrader 4, build 1471, on the Capital Point Trading server.
- Markets: 23 currency pairs, from EURUSD and USDJPY to crosses such as AUDNZD and CADCHF.
- Window: daily bars from 12 June 2018 to 24 August 2026.
- Size: one unit per pair, no pyramiding, results in R (1R is the 2N stop).
- Fills: at the breakout level, or at the open if price gapped past it.
- Costs: none. Every figure is before spread, swap and commission.
A daily bar does not show whether its high or low came first. So we did not check the entry bar against the stop.
The daily chart examples on EURUSD, USDJPY, USDCHF and gold come from the TradingView web chart with OANDA data and the built-in Donchian Channels at 20. We took them on 15 October 2026. Gold is not part of the statistics. Our editorial testing policy explains how we pick data and report results.
Turtle settings: the original rules and our test
| Rule | Original Turtle rules | Our test |
|---|---|---|
| System 1 entry | 20-day breakout | Same |
| System 1 exit | 10-day breakout against the trade | Same |
| System 2 entry | 55-day breakout | Same |
| System 2 exit | 20-day breakout against the trade | Same |
| N | 20-day exponential average of true range | Same |
| Stop | 2N from entry | Same |
| Unit size | 1% of equity per N | One unit per pair, results in R |
| Adding units | Yes, up to a cap | Not used |
| Skip filter (System 1) | Skip the breakout after a winning one | Not used |
| Portfolio limits | Caps on units in one market and in related markets | Not used |
| Markets | Futures: commodities, currencies and bonds | 23 FX pairs, daily |
The left-out rules cut both ways. Pyramiding makes winners bigger and reversals more painful, and the skip filter removes both losers and winners. So read our numbers as a test of the core entries, exits and stops.
Reading Turtle trades on a chart
On a chart, the Donchian channel does the work. Its upper line is the highest high of the last 20 bars, and its lower line is the lowest low. A System 1 trade starts when price breaks either one.
One detail trips people up. TradingView’s channel includes the current bar, so the line rises with a breakout and the candle never seems to poke outside. Instead, compare the bar with the previous bar’s line. Our charts also draw only the 20-day channel, so the 10-day exits fall inside it.
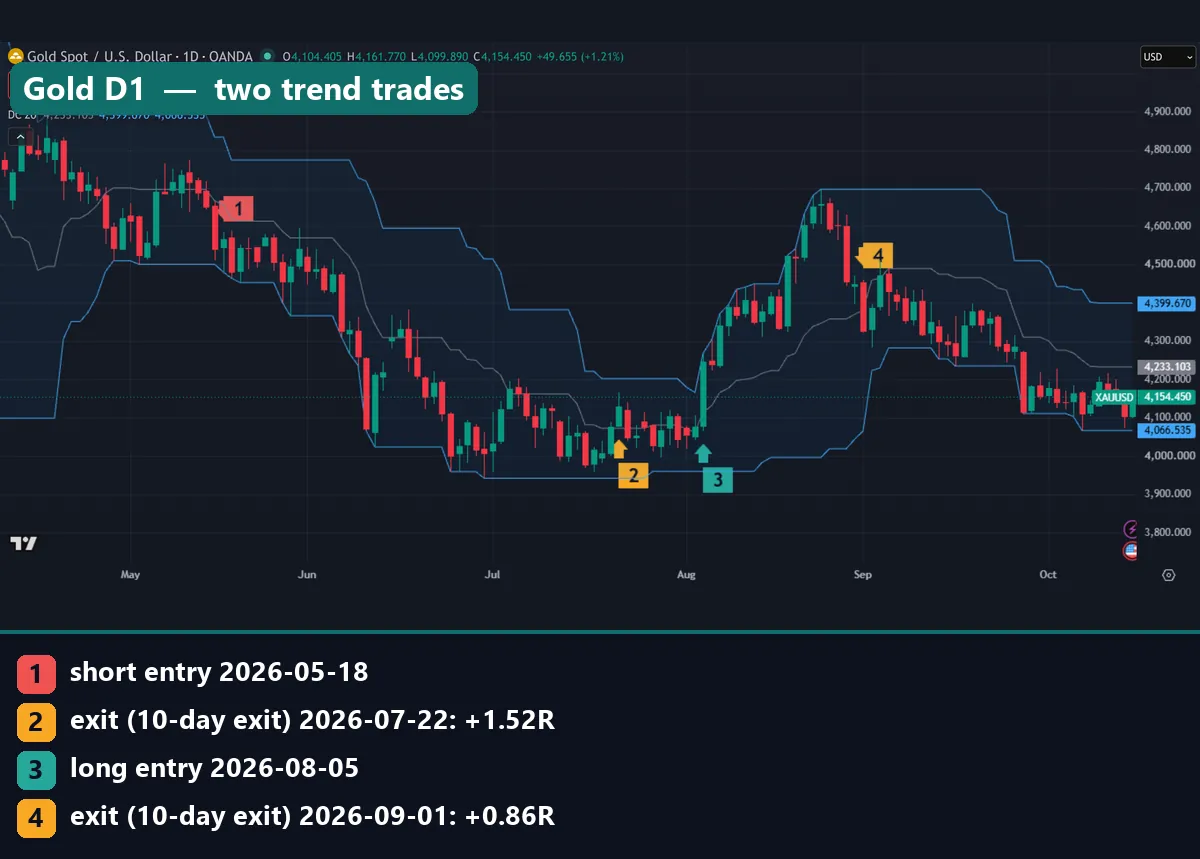
The gold chart shows the strategy at its best. Marker 1 is a short on 18 May 2026 at $4,501.035. The 2N stop sat at $4,739.21, so N was about $119. Gold slid for two months. Then the 10-day exit closed the trade on 22 July at $4,138.06 for 1.52R (marker 2). Next came a long on 5 August at $4,166.13 (marker 3). It closed on 1 September at $4,324.68 for 0.86R (marker 4).
A losing run: USDJPY from July to September
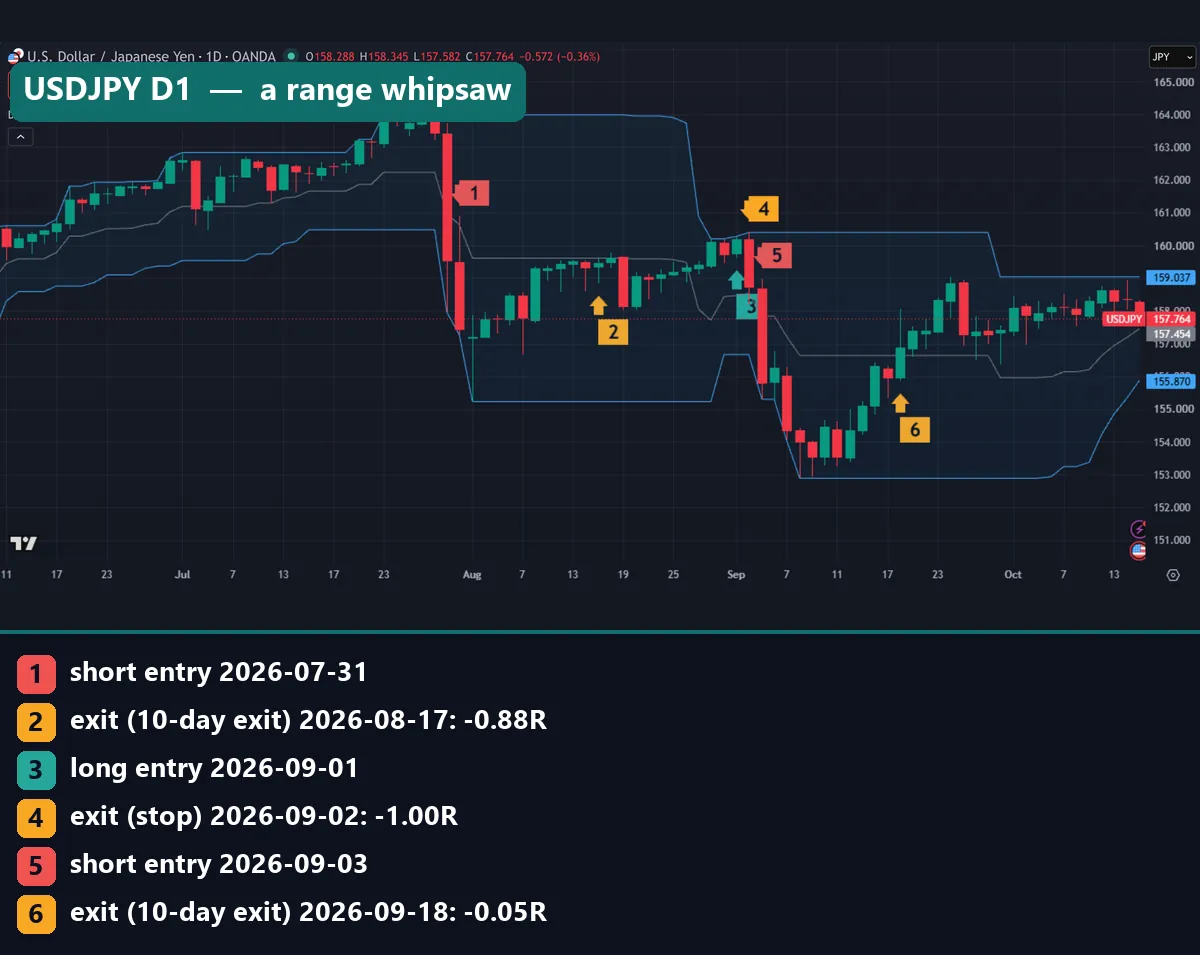
USDJPY shows the other side. Marker 1 is a short on 31 July at 157.953 after a steep drop. But price drifted back up, and the 10-day exit closed it on 17 August for -0.88R (marker 2). Marker 3 is a long on 1 September at 160.204. The next day a large red bar hit its stop for -1.00R (marker 4).
Marker 5 is a short on 3 September at 156.666. Price fell close to 153 within days, then climbed back. The exit on 18 September gave -0.05R (marker 6). So that trade handed back nearly all of a large open gain. The 10-day exit waits for a trend to prove it has ended, so it always gives back part of the move.
Worked example: three EURUSD trades in 2026
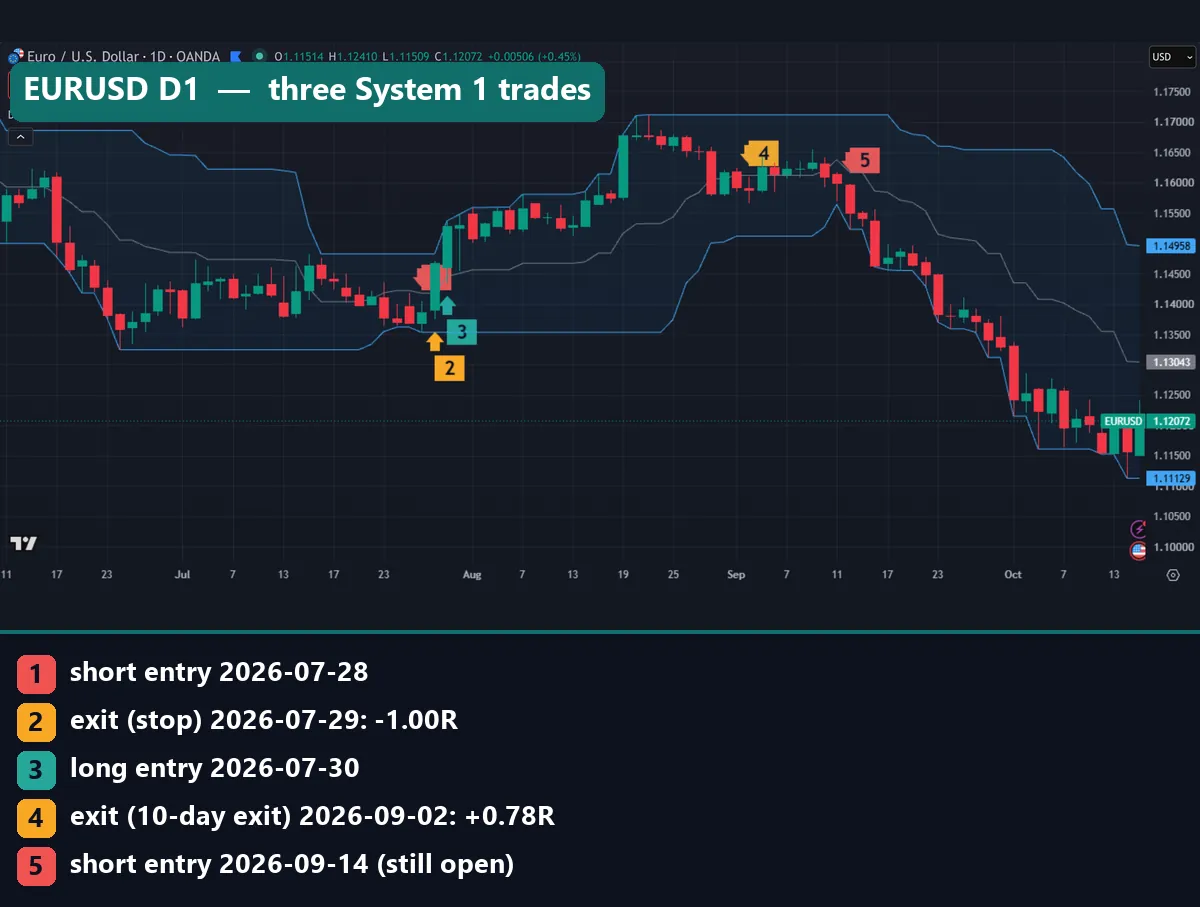
The opening EURUSD chart holds three System 1 trades from our TradingView check.
First, marker 1. On 28 July 2026, EURUSD traded below its 20-day low, and the system went short at 1.13618. N was 54.4 pips, so the stop sat 108.8 pips away at 1.14706. The next day a strong green bar hit it (marker 2). Result: -1.00R.
On 30 July the system bought the break of the 20-day high at 1.14824 (marker 3). N had risen to 56.4 pips, so the stop sat 112.8 pips lower, at 1.13696. On 2 September price broke the 10-day low, and the long closed at 1.15702 (marker 4). That is 87.8 pips, or 0.78R.
Marker 5 is a short on 14 September at 1.1564. By then N had dropped to 46.85 pips, so the stop sat at 1.16577. When we logged it, the open trade showed 3.64R on paper.
Now the sizing. At 1% of equity per N, the September unit is about 20% larger than the July one, because 56.4 divided by 46.85 is about 1.2. Yet both lose the same 2% of equity at the stop. That is the point of N.
For context, our six closed EURUSD trades from March to early September 2026 made +1.10R before costs: three winners, three losers.
What 2,503 Turtle trades did on forex
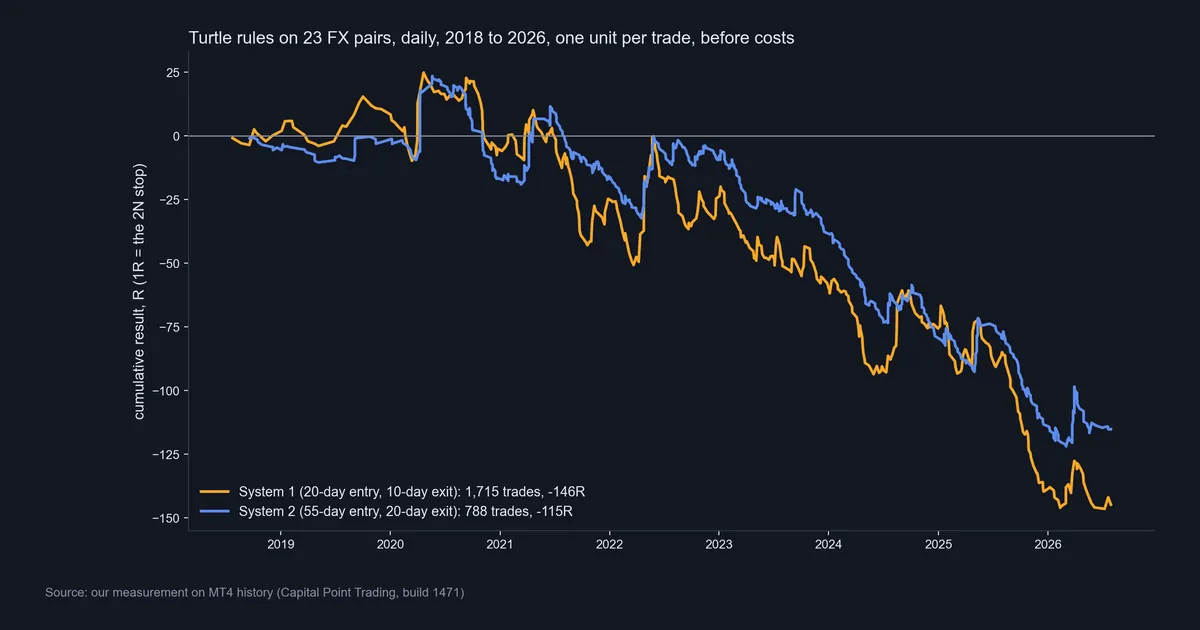
These curves are our measurement. System 1 took 1,715 trades, and only 32.9% made money. It lost 0.085R per trade and 146.5R in total. System 2 took 788 trades, with 29.1% profitable. It lost 0.146R per trade and 115.2R in total.
Both curves stayed within about 15R of zero until spring 2020, when strong moves lifted them to about +25R and +23.5R. Then both slid for six years. System 1’s worst drawdown was 172.3R, and System 2’s was 145.5R.
The trade shape explains it. System 1’s average winner made 1.13R and its average loser lost 0.68R. But two trades in three lost. The best single trade made 9.5R, and trend following depends on several wins like that each year. In this window, FX did not supply enough of them. The profit factors were 0.81 and 0.75.
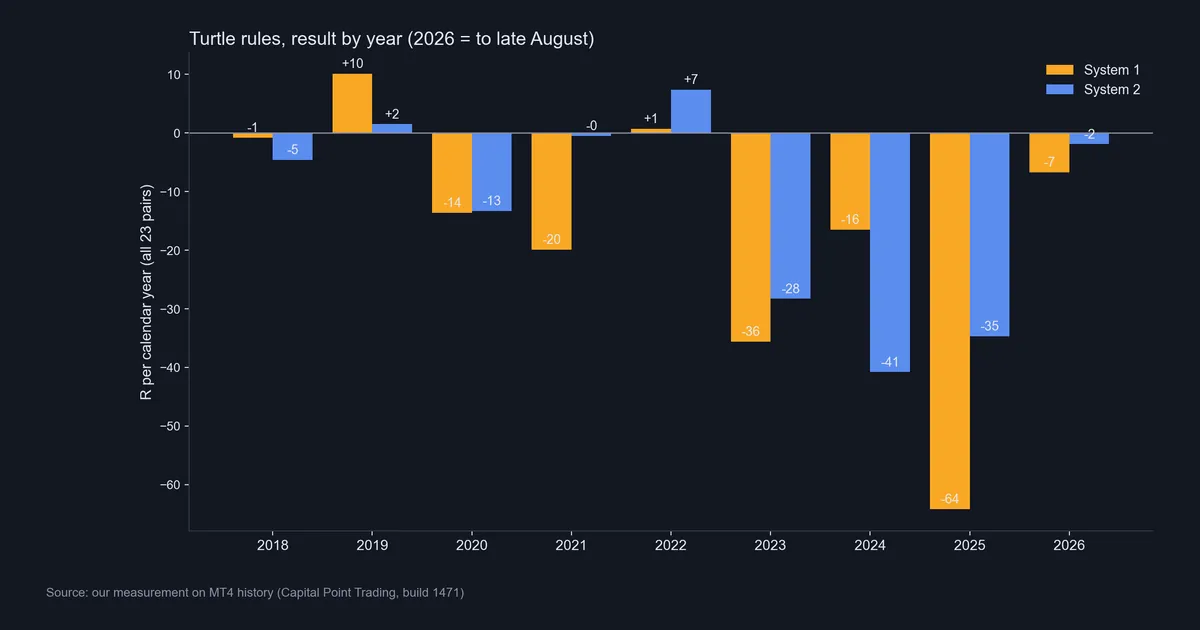
The yearly chart shows how rare the good years were. Only 2019 and 2022 ended positive for both systems, and System 1 made just 0.7R in 2022. System 1’s worst year was 2025, at -64.2R. For System 2 it was 2024, at -40.8R. Note that 2026 runs only to late August.
Download the complete indicator database
Put these concepts on your charts. One email unlocks the full library of 1,380+ indicators with compiled MT4 and MT5 files, plus my TradingView scripts. No paywall, no spam, unsubscribe any time.
Get free access to my indicator database
One email unlocks 1,380+ free MT4, MT5 and TradingView indicators — the complete library. No single-tool download; you get the whole database.
Where it fails
On 23 FX pairs from 2018 to 2026, the core Turtle rules lost money before costs. Costs would make it worse. Spread and commission hit all 2,503 trades, as our guide to backtesting transaction costs explains. Then forex swap rates add to the bill on trades held for weeks.
That does not mean the Turtles’ own results were fake. They traded futures from 1983 to 1988, a different market in a different era. Our test shows only that the same entries and exits did not carry over to daily FX from 2018 to 2026.
The rules also fail in ranges. The USDJPY chart shows a short, a long and another short inside seven weeks, for -1.93R. Even good trades have a lot to pay for. On gold, the two clean trades made 2.38R together, but the four gold trades before them in 2026 lost 2.48R.
The drawdowns are hard to live with. A 172.3R drawdown at the original 2% per R would leave almost nothing of an account. Our guides to drawdown in trading and losing streaks in trading cover what that does to a trader.
Finally, our test is simpler than the real system. The parts we left out could move the result either way, and we make no claim about them.
Setting up Donchian Channels on TradingView
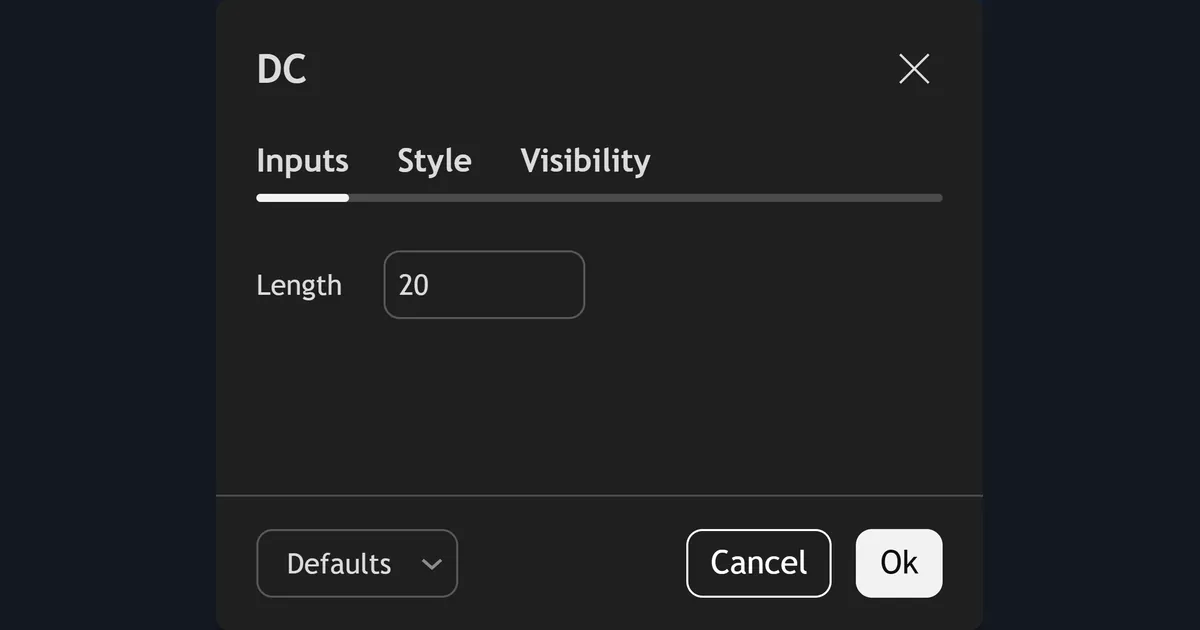
You can watch for Turtle signals with TradingView’s built-in Donchian Channels. Its Inputs tab has one field, Length, set to 20 in our capture. That gives the System 1 entry channel. To see the exits, add a second copy with Length at 10. For System 2, use 55 and 20. On MetaTrader, our Donchian channel indicator draws the same rails on MT4 and MT5.
One more example: USDCHF
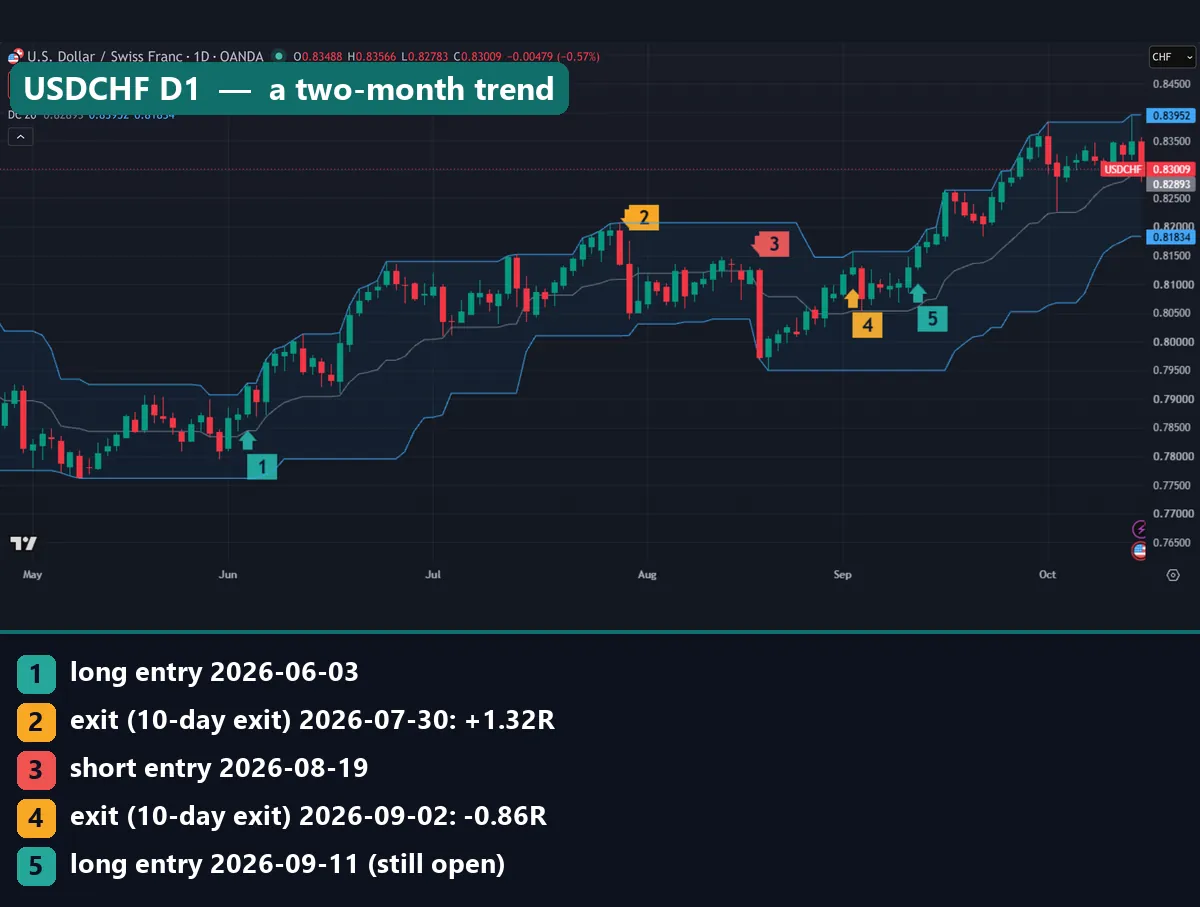
USDCHF gives our cleanest trend. Marker 1 is a long on 3 June 2026 at 0.79070, with the stop at 0.78049. The pair climbed in steps for almost two months. On 30 July the 10-day exit closed it at 0.80418 for 1.32R (marker 2).
Next, a short on 19 August at 0.80391 never followed through. It lost 0.86R on 2 September (markers 3 and 4). Marker 5 is a new long on 11 September at 0.81568, still open at 1.28R when we logged it.
Common mistakes with the turtle trading strategy
- Copying the rules without the context. The Turtles traded a broad futures portfolio in the 1980s. FX today is a different test, and ours lost.
- Tweaking the lengths until the backtest looks good. Try 30 days, then 40, then 18, and one may look good by chance. Our guide to curve fitting in trading explains why.
- Ignoring correlation. In our TradingView check, EURUSD and GBPUSD gave short entries on the same day three times in 2026: 2 March, 15 May and 14 September. That is close to one bet. Check a forex correlation matrix before you stack positions.
- Judging the system on a few trades. Two clean gold trades look convincing, and so does one ugly USDJPY month. Only the full record, with costs, tells you anything.
Where to go next
Start with the risk side, not the entries:
- Trading expectancy shows why -0.085R per trade adds up so fast over 1,715 trades.
- Our guide to a good profit factor puts 0.81 and 0.75 in context.
- The turtle soup strategy takes the other side and fades failed breakouts.
For outside reading, TradingView’s Donchian Channels help page gives the formula and credits Richard Donchian, who created the channel.
FAQ about the turtle trading strategy
What is the turtle trading strategy?
It is a breakout system from 1983. It buys new 20-day or 55-day highs, sells new lows, sets a stop 2N away and sizes each trade from volatility.
Who created the Turtle rules?
Richard Dennis and William Eckhardt taught them to a group of trainees, the Turtles. The trainees traded futures with these rules from 1983 to 1988.
What is N in Turtle trading?
N is the 20-day average true range, smoothed like an exponential average. It sets both the stop distance and the size of each unit.
Where does the Turtle stop loss go?
The stop goes 2N from the entry price. At the original 1% of equity per N, a full stop-out costs about 2% of equity per unit.
What is the difference between System 1 and System 2?
System 1 enters on a 20-day breakout and exits on a 10-day breakout. System 2 uses 55 days to enter and 20 to exit, so it trades less and holds longer.
Does the turtle trading strategy still work on forex?
Not in our test. On 23 FX pairs from 2018 to 2026, System 1 lost 146.5R over 1,715 trades and System 2 lost 115.2R over 788 trades. We tested the core rules without pyramiding or the skip filter.
Can I use TradingView’s Donchian Channels for Turtle signals?
Yes. Use Length 20 for the System 1 entry and a second copy at 10 for the exit. Then compare price with the previous bar’s line.
Are your Turtle test results after costs?
No. Every figure here is before spread, swap and commission, and those costs would make both systems worse; results are not guaranteed; past performance is not indicative of future results.
Last updated: 15 October 2026.

About the author
Written by Dominic Walsh, a Forex trader and MT4/MT5 indicator, Expert Advisor and script developer. Every tool on forexmt4systems.com is tested on live charts before release and ships with ready-to-use compiled MT4 (.ex4) and MT5 (.ex5) files. Learn more about the trader and developer behind this site.
How we build, test and correct every tool: Editorial & Testing Policy. Trading carries risk; see the disclaimer.