
Every trader meets a run of red trades, and knowing how to handle a losing streak in trading decides whether the account survives it. The streak itself rarely causes the real damage.
The reaction does. This guide explains why long losing runs appear inside a perfectly sound process, then hands you a concrete response: cut position size, verify the method against your own rules, and step away before the next decision.
What a Losing Streak Actually Looks Like
A losing streak simply means several trades in a row that finish at a loss. Nothing more complicated hides inside the definition.
So the length that feels shocking usually sits well inside normal. Five reds in a row look catastrophic on a Tuesday afternoon. Across two hundred trades, they barely register at all.
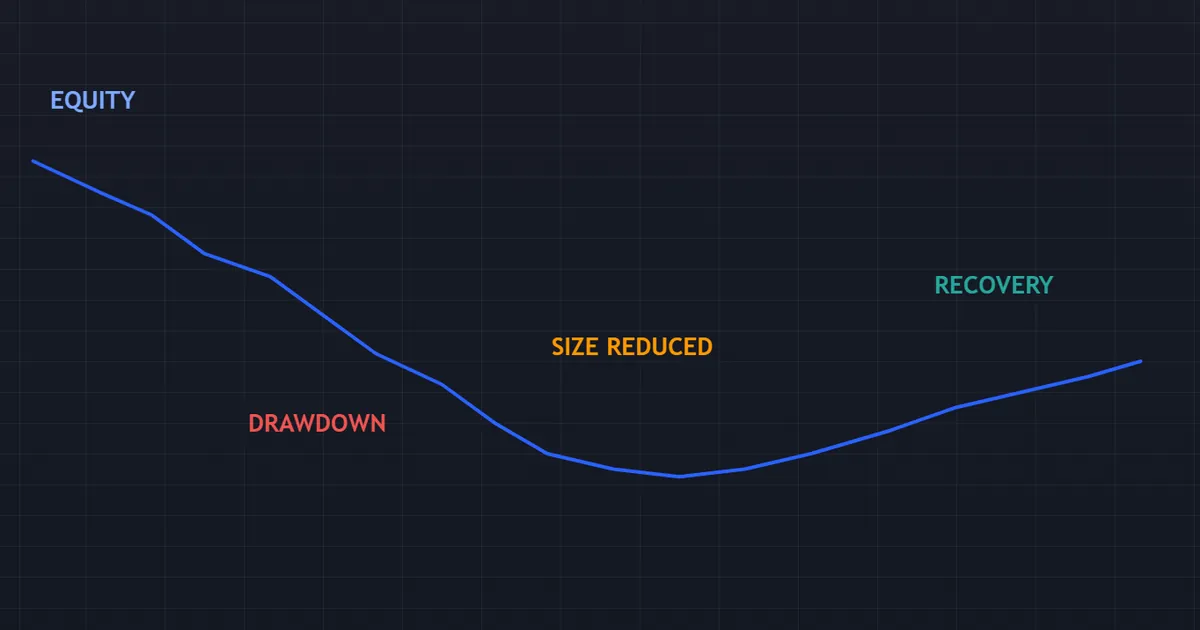
The equity curve above shows the shape most traders should expect. A grind lower, a flat patch, then a slow climb once the size comes down.
Notice what the panel leaves out. No crash appears, no single disaster, and no obvious blunder. Ordinary trades, taken properly, produced that whole dip.
A Streak Rarely Proves the Method Broken
Traders read a streak as a verdict on the strategy. In most cases it says almost nothing.
Because each trade lands independently, runs of the same result appear naturally in any random sequence. Toss a coin two hundred times and you will meet runs of six or seven heads. So your strategy deserves far more evidence than five trades before you rewrite it.
The Emotional Cost Arrives First
The financial damage of a normal streak stays small. The emotional damage moves much faster.
After three losses, most people shorten their analysis and lengthen their screen time. Then the next entry arrives from impatience rather than from the plan. So a streak that started as ordinary variance turns into a self-inflicted drawdown.
Drawdown Gives You One Honest Number
Drawdown tracks the fall from your equity peak down to the current low point. It replaces a feeling with a figure.
Our drawdown calculator turns a string of losses into that percentage. Because a percentage reads more calmly than a running tally of red trades, the number itself helps you stay level.
Streaks Look Different at Different Frequencies
A scalper meets a six-trade streak most weeks. A swing trader might wait a year for the same run.
So the emotional weight of an identical streak varies enormously between styles. Because frequency changes how often variance shows its teeth, high-frequency traders need thicker skin and tighter sizing rules.
Measure the Streak in Risk, Not in Trades
Six losses at a quarter percent hurt very little. Six losses at two percent threaten the account.
So the number of trades matters less than the risk behind them. Because the same headline count can describe a scratch or a wound, always quote a streak as a percentage of equity. That habit alone stops a lot of unnecessary alarm.
How to Handle a Losing Streak in Trading, Step by Step
Six steps cover the entire response. Work through them in order, since each one removes pressure from the next.
- Stop trading for the session. Close the platform once your pre-set loss limit fires, whatever the market offers next.
- Write the streak down. Record every trade, its setup, its risk and the reason you took it.
- Check the process, not the outcome. Ask whether each trade followed your written rules exactly.
- Cut position size. Halve your risk per trade until the equity curve steadies again.
- Compare the streak with your history. Look for a longer run in your own records before you conclude anything.
- Return on a plan, not a feeling. Set the date, the size and the permitted setups in advance.
None of those steps costs you money. Because none of them needs a market view, you can run the whole list on a quiet Sunday morning.
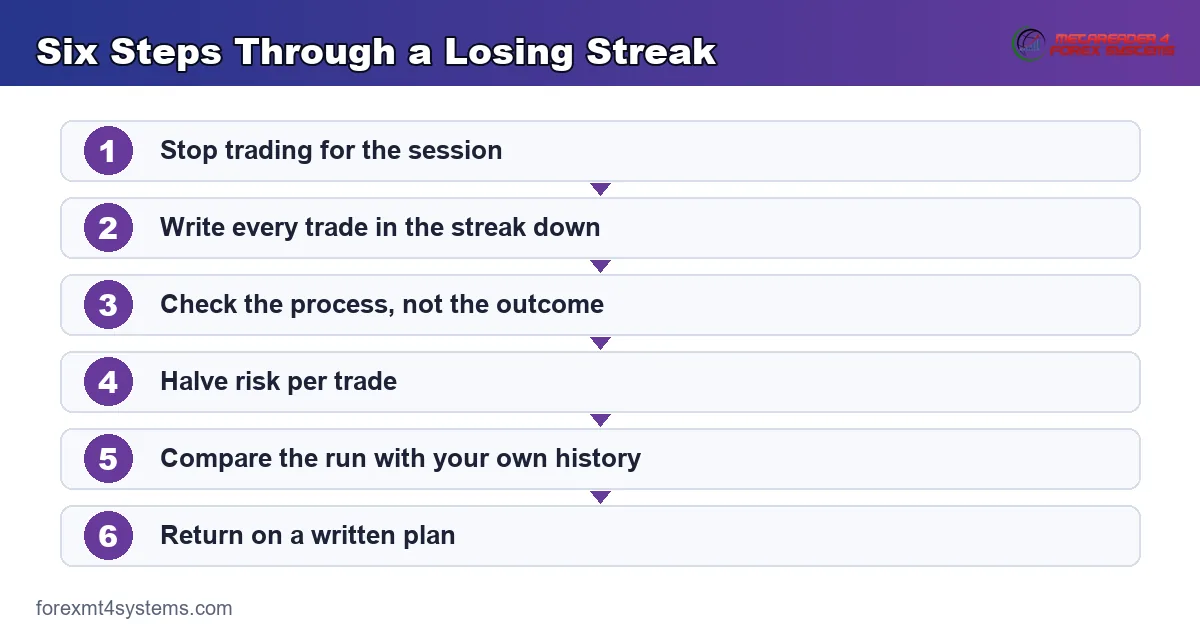
The flow above puts the same six steps into one panel. Pin it somewhere visible, since clear thinking runs short at exactly the moment you need this.
Step One Carries the Most Weight
Stopping for the session breaks the chain. Everything else on the list depends on that pause.
So set the trigger before the session rather than during it. Two losses or a fixed percentage both work well. Because you choose the rule while calm, it costs nothing emotionally when it fires later.
Halving Size Buys You Time
Smaller positions slow the bleeding without stopping you from trading. They also lower the emotional weight of every result.
Suppose you normally risk one percent. Drop to half a percent, and ten further losses cost five percent instead of ten. So the same bad run leaves you with a working account and a working head.
Review the Process, Never the Profit
Ask one question of each losing trade. Did it match the setup you wrote down beforehand?
A rule-following loss needs no fix at all. A rule-breaking win, meanwhile, deserves more attention than any red trade. Because outcomes stay noisy and rules stay checkable, grade yourself on the rules.
Set the Return Conditions in Writing
Vague plans collapse under pressure. Written ones survive.
State the return date, the reduced size and the two setups you will allow yourself. Then treat that note as binding until the equity curve makes a new high. Because your calmer self wrote the note, the restart carries far less pressure.
Add a Weekly Limit Above the Daily One
A daily limit stops one bad session. It does little against five mediocre ones in a row.
So layer a weekly cap on top. Three percent for the week, for instance, ends trading on Wednesday when the maths demands it. Because the weekly line catches slow bleeds that daily limits miss, most traders benefit from both.
Why Long Losing Runs Happen Inside Good Systems
The arithmetic behind streaks explains more than any chart pattern. Once the numbers make sense, the panic loses most of its grip.
Three ideas do the heavy lifting: independence, expectancy and the law of large numbers. None of them demands advanced maths.
Outcomes Arrive Independently
Your last trade tells you nothing about the next one. The market holds no memory of your account.
So a run of losses does not make a winner overdue. That belief carries a name, the gambler’s fallacy, and it pushes traders to size up at exactly the wrong moment. Because every trade stands alone, the correct response after four losses looks identical to the response after four wins.
Expectancy Only Emerges Over Many Trades
Expectancy measures the average result per trade across a long sample. A sound method carries a small positive figure.
Small, though, really does mean small. Over ten trades that number tells you almost nothing, while over three hundred it starts to firm up. Our expectancy calculator runs the arithmetic straight from your own records.
Long Runs Sit Comfortably Inside Normal Odds
Take a method where roughly four trades in ten finish as winners. Sequences of six or seven losses turn up regularly across a few hundred trades.
So a streak of that length carries no information about your edge. Because most traders never count their own history, the first long run feels unique. It almost never turns out that way.
The Law of Large Numbers in Plain Terms
The law of large numbers says one thing simply. As the sample grows, the average result drifts toward the true average.
Notice the direction of that promise. It says nothing about your next ten trades, and it offers no schedule for the drift. So a positive expectancy shows up over hundreds of trades while remaining invisible over ten. Because the law works slowly, your job during a streak amounts to staying solvent long enough for it to apply.
Count Trades, Not Weeks
Judge a method by the number of trades rather than the number of weeks. A scalper reaches two hundred trades in a fortnight, while a position trader needs a year.
So identical streaks mean very different things to those two traders. Because sample size drives every conclusion, count trades whenever you review performance.
A Worked Example of an Ordinary Streak
Numbers settle arguments that feelings cannot. Take a ten thousand dollar account and a method that risks one percent per trade.
Say the trader meets eight losses in a row. That run costs roughly eight percent, leaving the account near nine thousand two hundred dollars.

The panel above compares two responses to that identical run. One curve keeps full size and keeps digging. The other halves risk at the fourth loss and flattens out.
Look at the gap after twenty further trades. The disciplined path climbs back toward breakeven, while the doubled-up path sinks deeper still. So the streak never decided the outcome. The response did.
Recovery Arithmetic Cuts Both Ways
A ten percent loss needs about eleven percent to get back. A thirty percent loss needs nearly forty three percent.
So the cost of letting a streak run grows faster than the streak itself. Because the required gain climbs so steeply, defending the shallow end of a drawdown matters far more than fighting the deep end. Our guide to recovering from a drawdown works through the full table.
Costs Deepen Every Streak
Spread, commission and swap all add to the same run. Eight losses on a wide-spread instrument cost noticeably more than eight on a tight one.
So a streak in an expensive market bites harder. Because costs never take a break, trimming trade frequency during a drawdown helps you twice over.
What the Example Leaves Out
The comparison assumes clean fills and a settled trader. Real sessions add slippage, wider spreads and a faster pulse.
So the honest version of that arithmetic needs more cushion, not less. Because every one of those extras pushes the same way, a size that reads as safe on paper often runs tighter in practice. Leave the margin, and the surprises stop mattering.
Rebuilding Size After the Streak Ends
Cutting size solves the first half of the problem. Getting back to full size solves the second half, and most traders rush it.
A written ladder removes the guesswork. Each rung needs a trigger you can check without an opinion.
Tie Each Step to the Equity Curve
Pick a measurable milestone rather than a mood. Recovering half the drawdown might restore three quarters of normal size.
Then a new equity high restores the rest. So the account itself decides when you scale up, and confidence plays no part in the choice. Because the trigger sits in the numbers, arguing with it feels pointless.
Move Up Slowly, Drop Down Quickly
Asymmetry protects you here. Take two or three steps to climb back, but return to half size the moment a fresh drawdown reaches your threshold.
So the ladder rises gently and falls fast. Because the deep end of a drawdown costs so much more than the shallow end, that asymmetry pays for itself over a career.
Rebuild the Routine Before the Risk
Size follows habits rather than leading them. Get the pre-trade checklist, the journal and the session limit running properly first.
Then let the size follow. Because a streak often exposes a lapsed routine, fixing the routine usually matters more than the sizing ladder itself.
Download the complete indicator database
Put these concepts on your charts. One email unlocks the full library of 1,380+ indicators with compiled MT4 and MT5 files, plus my TradingView scripts. No paywall, no spam, unsubscribe any time.
Get free access to my indicator database
One email unlocks 1,380+ free MT4, MT5 and TradingView indicators — the complete library. No single-tool download; you get the whole database.
Common Mistakes During a Losing Run
Six habits turn an ordinary streak into a serious problem. Each one carries a simple fix.

Increasing Size to Get Even
Doubling up after a loss feels like a shortcut. It multiplies the damage instead.
The remedy runs the other way. Cut risk during a drawdown, then restore it only after the curve steadies. Our note on revenge trading covers this pattern in detail.
Changing the Strategy After Four Trades
Four results carry almost no information. Swapping methods on that basis leaves you with a permanent beginner’s sample.
Set a threshold instead. Decide in advance how many trades a genuine review needs, then hold the method until you reach that count.
Trading More to Recover Faster
More trades feel like more chances. They also mean more costs and more decisions taken while tired.
Reduce frequency rather than raising it. Take fewer, cleaner setups until the streak ends, and let the calendar carry some of the load.
Hiding From the Records
Plenty of traders stop logging once the numbers turn ugly. That gap then removes the only evidence they own.
Keep the log running through the worst of it. Record every trade, especially the painful ones, in a trade journal you actually open.
Treating a Streak as a Character Flaw
A run of losses says nothing about your worth as a person. It says something about variance.
Separate the two judgements cleanly. Grade yourself on rule-following, and grade the method on a large sample of trades.
Blaming the Broker Before the Journal
Slippage and spread deserve scrutiny, though rarely first. Traders who blame execution early usually skip the harder review.
Check your own records ahead of the platform. If the journal shows clean entries and clean exits, only then compare fills against the quotes you expected.
Losing Streak Quick Reference
Run this list at the end of any day that finishes red. It takes about two minutes.
| Check | Action when it fails |
|---|---|
| Did every trade follow the written rules? | Repair the process before touching size |
| Have you reached your daily loss limit? | Close the platform until tomorrow |
| Does the drawdown sit inside your historic range? | Carry on at reduced size |
| Has your risk per trade crept upward? | Reset it to the written figure |
| Did you log every trade today? | Complete the journal before the next session |
| Do you feel calm enough to trade tomorrow? | Book a longer break and a smaller return size |
Three answers pointing the wrong way mean one thing. Stand down for the week, and treat the pause as part of the method.
Keep the completed lists. Because a folder of them shows how you behaved across several streaks, it becomes the most useful performance record you own.
Pitfalls and What Still Goes Wrong
Some problems survive a good response, so keep them in view. The panel below shows the version that closes accounts.
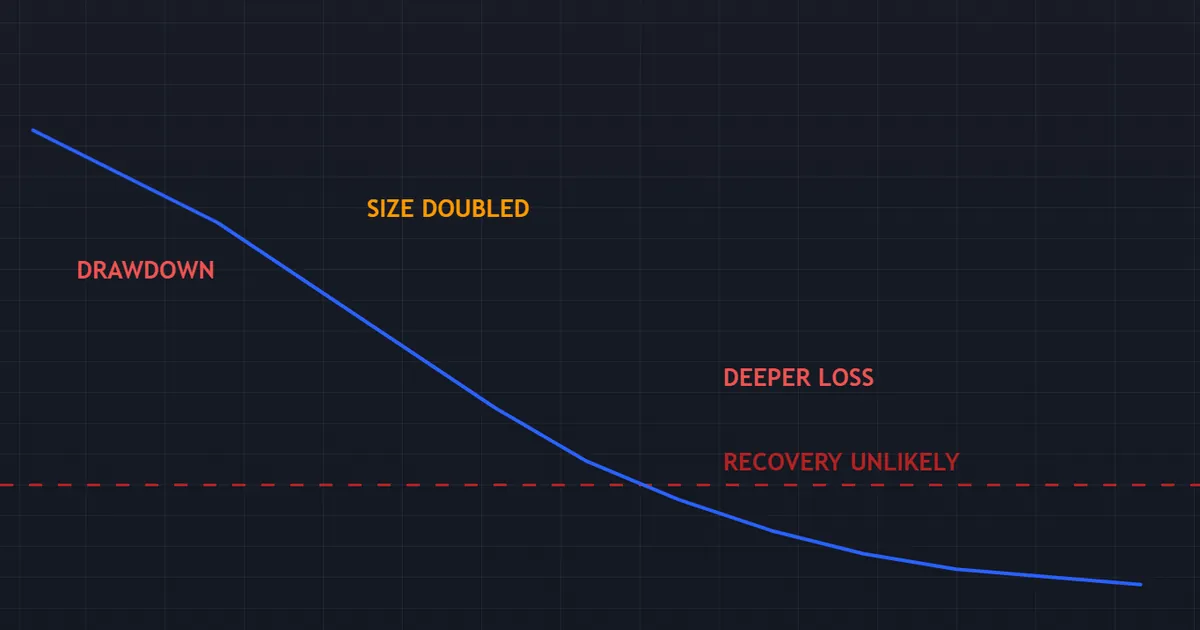
Equity slides, size rises instead of falling, and the curve breaks through the level where recovery stops being realistic. That path takes days rather than months.
Risk of Ruin Climbs Quietly
Risk of ruin measures the chance that a bad run empties the account entirely. It rises sharply as risk per trade grows.
So doubling size during a streak multiplies that chance rather than merely adding to it. Because the maths runs against you, size remains the safest lever during any drawdown.
A Genuine Edge Can Still Decay
Sometimes a streak really does flag a broken method. Conditions shift, and a range strategy meets a strongly trending month.
So look for a reason rather than only a result. Because a decayed edge shows up as a change in setup quality, your journal notes usually spot it before the equity curve does.
Correlated Positions Hide the Real Streak
Three trades in closely related markets behave like one larger trade. Your log then records three losses where the exposure carried only one idea.
So the streak looks longer than it truly was. Because correlation quietly multiplies risk, group related positions and size them as a single unit.
When the Stress Reaches Beyond Trading
Sometimes the problem stops being technical. If losses affect your sleep, your finances or your relationships, stepping away from the screens matters more than any rule.
Speak to a qualified professional in that situation. Because compulsive trading behaves much like other compulsions, willpower alone rarely settles it.
The Streak That Follows a Big Win
Losing runs often begin right after a strong week. Success loosens the rules quietly, and size drifts upward without a decision.
So review your sizing after good stretches, not only after bad ones. Because overconfidence leaves no obvious trace in the equity curve, the journal remains the only place it shows up early.
Restarting Far Too Early
A break helps only when it lasts long enough to change your state. Ten minutes rarely manages that after a heavy week.
So write down the return date and the return size. Because that decision then belongs to your calmer self, the restart feels far lighter.
Related Concepts to Study Next
Streak management sits inside risk management, so a few neighbouring topics repay an hour of reading. Fix the sizing, and most streak problems shrink on their own.
Start with drawdown in trading for the measurement, then read risk per trade for the lever that matters most. On the emotional side, see our guides to dealing with trading losses and tilt in trading, which pick up where this article stops.
FAQ
How long does a normal losing streak last?
Six or seven consecutive losses turn up regularly in methods that win roughly four trades in ten. Longer runs appear across a few hundred trades. So compare any streak against your own records before you treat it as unusual.
Should I stop trading during a losing streak?
Stopping for the session helps almost every trader. A longer pause helps when the losses start affecting your decisions rather than only your balance. Set the trigger in advance, because you will not choose well in the moment.
Does cutting position size actually help?
Yes, on two fronts. Smaller positions slow the financial damage, and they lower the emotional weight of each result. That combination keeps you trading your plan while the run works itself out.
How do I rebuild size once the streak ends?
Tie each step up the ladder to a milestone on the equity curve. Recovering half the drawdown might restore three quarters of normal size, with a new equity high restoring the rest. Climb back in stages, then drop straight to half size if a fresh drawdown reaches your threshold.
How many trades before I judge my strategy?
Aim for a few hundred rather than a few dozen. Ten trades tell you almost nothing about expectancy, while three hundred begin to show the real shape. Count trades rather than weeks, since frequency differs hugely between styles.
Is a losing streak a sign of bad luck or bad trading?
Usually it means variance. Check the process first: if every trade followed your written rules, the run says little about your skill. A pattern of rule-breaking, though, points somewhere else entirely.
What if the streak keeps going after I cut size?
Then treat it as a research problem rather than a trading problem. Stop, review a large sample, and look for a change in market conditions or setup quality. Reduced size protects the account while you investigate, and it keeps your options open. Results are not guaranteed; past performance is not indicative of future results.
External references
- For background on this concept, see Law of Large Numbers on Wikipedia.
- For broader market context, see Expectancy at BabyPips Forexpedia.

About the author
Written by Dominic Walsh, a Forex trader and MT4/MT5 indicator, Expert Advisor and script developer. Every tool on forexmt4systems.com is tested on live charts before release and ships with ready-to-use compiled MT4 (.ex4) and MT5 (.ex5) files. Learn more about the trader and developer behind this site.
How we build, test and correct every tool: Editorial & Testing Policy. Trading carries risk; see the disclaimer.