
Every trading method produces losses. The difference between accounts is not whether losses arrive, but what the trader does in the twenty minutes afterwards.
This guide covers how to deal with trading losses using written rules rather than encouragement. You get a loss limit, a cooling-off period, journal fields, a classification system and a review cadence you can start this week.
None of it asks you to feel differently. Each control simply removes a decision from the moment when your judgement is weakest.
Why Trading Losses Hurt More Than They Should
A loss carries two costs. The money leaves the account, and the experience distorts the next few decisions.
The second cost usually exceeds the first. So the mechanics below aim at the distortion rather than the arithmetic.
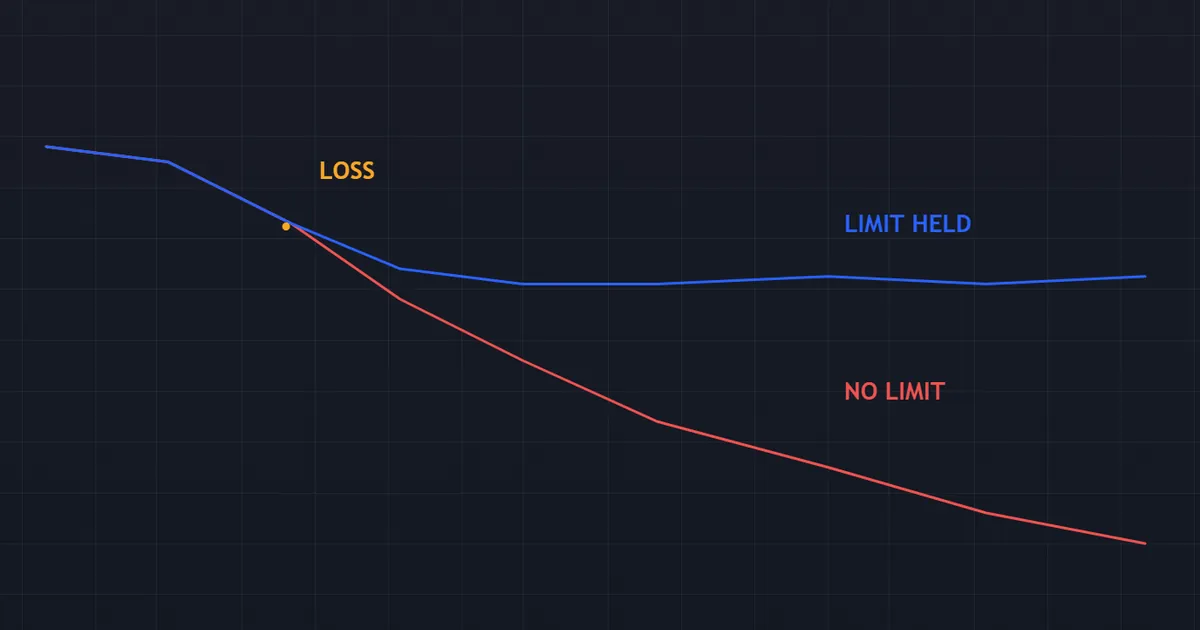
Look at the equity panel above. One controlled dip barely registers, while the escalation that follows an uncontrolled one changes the whole shape.
Loss Aversion in One Line
Research in behavioural economics found that people feel a loss roughly twice as strongly as an equivalent gain. Daniel Kahneman and Amos Tversky described the effect in their work on prospect theory.
So your reaction to a stop-out is not weakness. It reflects a documented asymmetry that shows up across almost every human decision task.
Knowing this changes the response. Because the feeling overstates the damage, you should never size or re-enter while it is still loud. Our note on loss aversion in trading unpacks the mechanism further.
The Sunk-Cost Trap
Money already lost feels recoverable from the same trade. That instinct is the sunk-cost fallacy, and it explains why traders add to losers.
The market has no memory of your entry. Whether to hold a position depends only on the setup in front of you now.
So write the test as a question. Would I open this position today, at this price, with no history attached? If not, close it.
What a Loss Actually Costs
Express every loss in R multiples rather than money. One R is your standard risk, so a full stop-out costs exactly one R.
That framing shrinks the drama. Five losses in a row is minus five R, which is a normal stretch for many strategies rather than a catastrophe.
It also makes losses comparable across account sizes. A trader with a five thousand dollar account and one with fifty thousand read the same number.
The Disposition Effect
Traders tend to sell winners early and hold losers too long. Researchers call this the disposition effect, and it follows directly from loss aversion.
The logic is uncomfortable. Closing a loser makes the loss real, whereas holding it keeps the outcome open and the feeling at bay.
So the fix is structural rather than mental. A stop order placed with the entry closes the position for you, before the instinct gets a vote.
How to Deal With Trading Losses, Step by Step
Seven steps cover a single losing trade from close to review. Run them in order every time, so the sequence becomes automatic.
- Let the stop do its job. Do not touch it, and do not close early out of discomfort.
- Log the trade immediately. Fill in the journal row while the detail is fresh.
- Classify it. Mark the loss as rule-following or rule-breaking, using your numbered rules.
- Start the cooling-off clock. Stand down for the fixed period you wrote in advance.
- Check the daily limit. Compare cumulative losses against the figure that ends your session.
- Return only through the checklist. The next entry must clear every box, with no exceptions.
- Review on schedule. Analyse the loss in your weekly slot, never in the ten minutes after it.
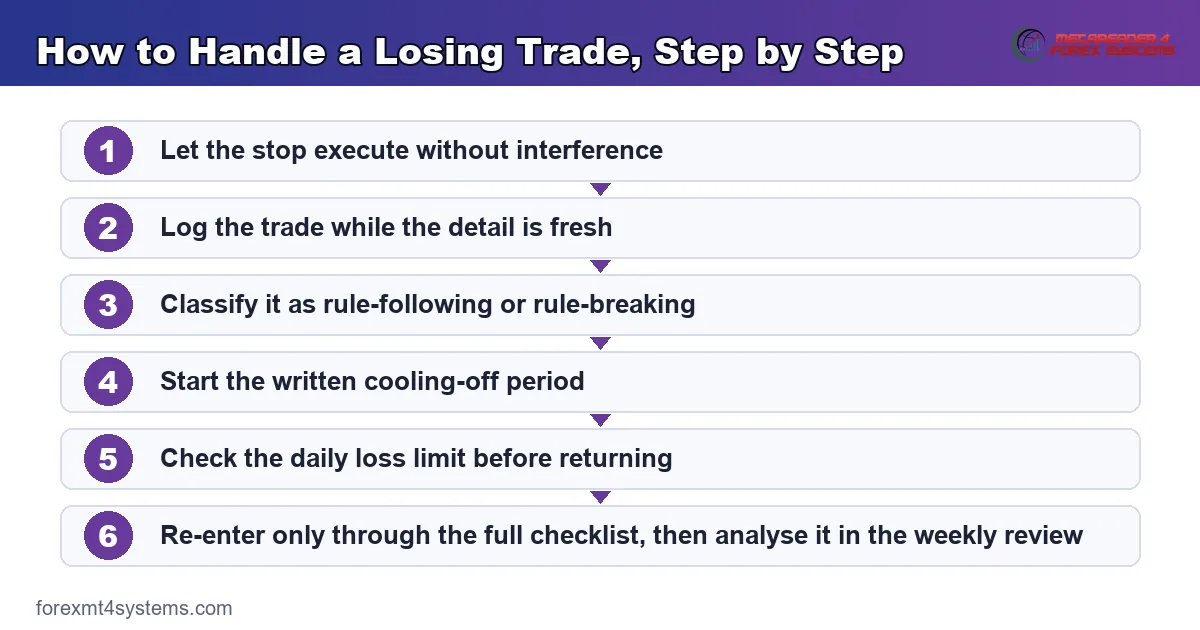
Notice how little of this involves thinking about the loss. Steps two and three record it, and step seven analyses it, while everything between simply prevents damage.
Separate the Loss From the Decision
A good decision can lose. A poor decision can win. Because outcomes carry noise, judging yourself by the result teaches the wrong lesson.
So grade the decision independently. Ask whether the setup matched your written definition, whether risk was standard, and whether the exit followed the plan.
Three yes answers make it a good trade regardless of the balance. That is the only definition of a good trade worth keeping.
Grade the Trade, Not the Outcome
Use a simple two-by-two. Trades split into rule-following winners, rule-following losers, rule-breaking winners and rule-breaking losers.
Rule-following losers need no action at all. They are the cost of running an edge, and treating them as failures is how traders talk themselves out of working strategies.
Rule-breaking winners deserve the real scrutiny. They feel wonderful and they teach the most expensive habits, so flag them in the journal as clearly as the losses.
Why the Order of the Steps Matters
Logging comes before analysis for a reason. Writing down what happened takes no judgement, while explaining it takes plenty.
The pause comes before the next entry for the same reason. Because your read of the market shifts after a loss, the pause protects the entry rather than your mood.
Analysis comes last, and it comes on a schedule. Traders who reverse this order end up rewriting a strategy every Tuesday afternoon.
The Written Rules That Cap the Damage
Four numbers do almost all the protective work. Decide each one before your next session, then let them run without debate.
Each rule answers a single question. How much per trade, how much per day, how much per week, and how long you wait after a loss.
Flat Risk Per Trade
Fix one risk figure and hold it for at least a month. A flat figure keeps every loss the same size, which stops one bad trade from mattering.
Most retail traders land between half a percent and one percent of the account. Lower is entirely reasonable while you are still building the habit.
Our note on risk of ruin shows what happens to survival odds as that figure climbs. The curve turns unfriendly faster than most traders expect.
The Daily Loss Limit
Set a figure that ends the session outright. Three consecutive full losses suits many intraday styles, which lands near three percent at one percent risk.
Write it as a percentage rather than a cash amount. Percentages scale with the balance, so the rule survives both growth and drawdown.
Then automate the reminder. An alert removes the negotiation, because a limit you have to remember during a bad afternoon is not really a limit.
The Weekly Floor and the Size Cut
Add a weekly floor at roughly twice the daily figure. Five controlled losing days still add up, and the floor catches that slow bleed.
Pair the floor with an automatic size cut. Halve your risk figure for the following week, then restore it after five clean sessions.
This single rule flattens most drawdowns. Because size falls as losses accumulate, the deepest part of the curve gets traded at the smallest exposure.
The Cooling-Off Period
Fix a pause after every full stop-out. Fifteen minutes covers most intraday styles, and the rest of the session after two losses in a row.
Leave the chart during the pause. Watching a market you cannot trade builds pressure rather than releasing it.
Write the journal entry instead. Our guide to revenge trading shows how fast the alternative escalates.
One Rule for Re-Entry
Many traders lose more on the trade after the loss than on the loss itself. So the re-entry deserves its own written rule.
Require a fresh setup, not a continuation of the old idea. If the chart still shows the same pattern, the market has already told you what it thinks of it.
Require the full checklist as well. Any unticked box means no trade, and an unticked box right after a loss means it twice over.
A Worked Example of a Losing Run
Numbers settle this faster than argument. Picture a trader risking one percent per trade who takes five losses in a row.

The table below compares two responses to that run. The rules are identical up to the first loss, then they part company.
| After | Flat risk, rules held | Size raised to recover |
|---|---|---|
| Loss 1 | Down 1.0 percent, risk stays at 1 percent | Down 1.0 percent, risk raised to 2 percent |
| Loss 2 | Down 2.0 percent | Down 3.0 percent, risk raised to 3 percent |
| Loss 3 | Down 3.0 percent, daily limit ends session | Down 6.0 percent, risk raised to 4 percent |
| Loss 4 | New session, risk halved to 0.5 percent | Down 10.0 percent |
| Loss 5 | Down 3.5 percent in total | Down roughly 15 percent in total |
Both traders read the market equally badly. Only the rules differ, and the gap after five trades is more than fourfold.
What the Two Columns Really Show
The left column never asks the trader to be right. It simply refuses to let any single stretch matter very much.
The right column depends on the streak ending soon. Because nothing in the market owes you that, the plan has no floor under it.
Notice the daily limit doing quiet work on the left. It ends the third session, which removes losses four and five from that day entirely.
Working the Recovery Arithmetic
Recovery is not symmetrical, which is the part traders underestimate. A ten percent drawdown needs an eleven percent gain to get back, while a fifty percent drawdown needs one hundred percent.
Run your own figures through our free drawdown calculator before you change anything. Seeing the required gain in print usually settles the case for smaller size.
Our guide to recovering from a drawdown covers the sequencing. In short, cut size first and raise it only after results confirm the change.
Download the complete indicator database
Put these concepts on your charts. One email unlocks the full library of 1,380+ indicators with compiled MT4 and MT5 files, plus my TradingView scripts. No paywall, no spam, unsubscribe any time.
Get free access to my indicator database
One email unlocks 1,380+ free MT4, MT5 and TradingView indicators — the complete library. No single-tool download; you get the whole database.
Journal Fields for Losing Trades
A journal written as prose teaches very little. Fields you can count and sort turn a losing month into a repair list.
So build the journal as a table. Reserve one free-text column for a single sentence, and no more.
The Fields to Record
Record these for every loss, without exception. Skipping the painful ones is exactly how the pattern hides.
- Date, time and instrument
- Setup name, from your written list
- Checklist complete: yes or no
- Planned risk and actual risk, in percent
- Result in R multiples
- Loss class: rule-following or rule-breaking
- Rules broken, by number
- Emotional state before entry, one to five
- Minutes since the previous trade closed
- Was the cooling-off period respected
- One sentence of comment
Our free trade journal already carries these fields. A spreadsheet works just as well, provided you never skip a row.
The Classification Column
One column matters more than the rest. The loss class turns a vague bad week into two very different piles.
Count them separately each week. A month of rule-following losses points at the strategy, whereas a month of rule-breaking losses points at the process.
Those two problems need opposite responses. Because the fix differs so sharply, guessing which one you have is expensive.
The Weekly Loss Review
Book thirty minutes at the same time each week. Read only the losing rows, and read them in order.
Ask three questions of the set. How many were rule-breaking, which rule broke most often, and what single change fixes that one rule next week?
Then change one thing only. Two simultaneous changes make the following week impossible to interpret, so slow repair beats fast reinvention.
Rebuilding After a Losing Month
A bad month leaves two problems behind. The balance is lower, and your willingness to pull the trigger is lower still.
Treat them separately. The balance recovers through arithmetic, while confidence recovers through evidence.
Reduce Size Before You Reduce Ambition
Cut risk to a quarter of your normal figure for twenty trades. At that size a loss barely registers, so the checklist becomes easy to follow again.
Judge those twenty trades on process alone. Count rule breaks, not profit, because the point of the exercise is behaviour rather than recovery.
Then restore size in steps. Half your normal figure for another twenty trades, and full size only after both blocks show clean compliance.
Rebuild Evidence, Not Optimism
Confidence built on a good week collapses with the next bad one. Confidence built on a compliance record survives both.
So keep the rule-following score visible. Twenty trades at ninety percent compliance is real evidence, whatever the equity curve did over that stretch.
Review the record before each session. Reading your own numbers beats any amount of self-talk before the market opens.
Common Mistakes After a Loss and How to Fix Them
Six patterns cover most of the damage traders do to themselves. The panel below collects the habits that keep a losing run small.

Re-Entering Immediately
The urge to get it back peaks within minutes. So write a fixed pause and let a timer, rather than your mood, decide when you return.
Doubling Size to Recover
Raising risk after a loss converts a normal stretch into a serious drawdown. Hold your flat figure, and cut it rather than raise it when losses cluster.
Widening the Stop Mid-Trade
Moving a stop away from price turns a planned loss into an unknown one. Write a rule that permits movement in one direction only, then leave the original level alone.
Changing Strategy After Three Losses
Three losses tell you almost nothing about an edge. Set a minimum sample, thirty trades or one month, before any strategy decision counts.
Hiding the Bad Trades
Journals with gaps always have the same gaps. Log every loss on the day it happens, especially the embarrassing ones.
Reviewing While Still Angry
Analysis done ten minutes after a loss records the emotion, not the lesson. Book the review for a fixed slot and hold it there.
Counting Losses in Money Rather Than R
Cash figures inflate the reaction, since the same trade feels far worse on a bigger account. Convert every result to R multiples and read the streak as a normal stretch.
Skipping the Next Valid Setup
Fear after a loss makes traders miss the trade that would have recovered it. So let the checklist decide rather than the memory of the last result.
Loss Handling Quick Reference
Keep this list beside your platform. Seven answers cover every losing trade you will take.
- Did the stop execute as planned, without interference?
- Is the journal row filled in already?
- Was this loss rule-following or rule-breaking?
- How long does my cooling-off period run?
- How far am I from the daily loss limit right now?
- How far am I from the weekly floor?
- Does my next entry clear every checklist box?
Answer all seven before the next order. Because the answers take under a minute, no market condition justifies skipping them.
When a Losing Run Becomes Something Else
Most losing runs are ordinary. A few are not, and the difference shows in behaviour rather than in the balance.
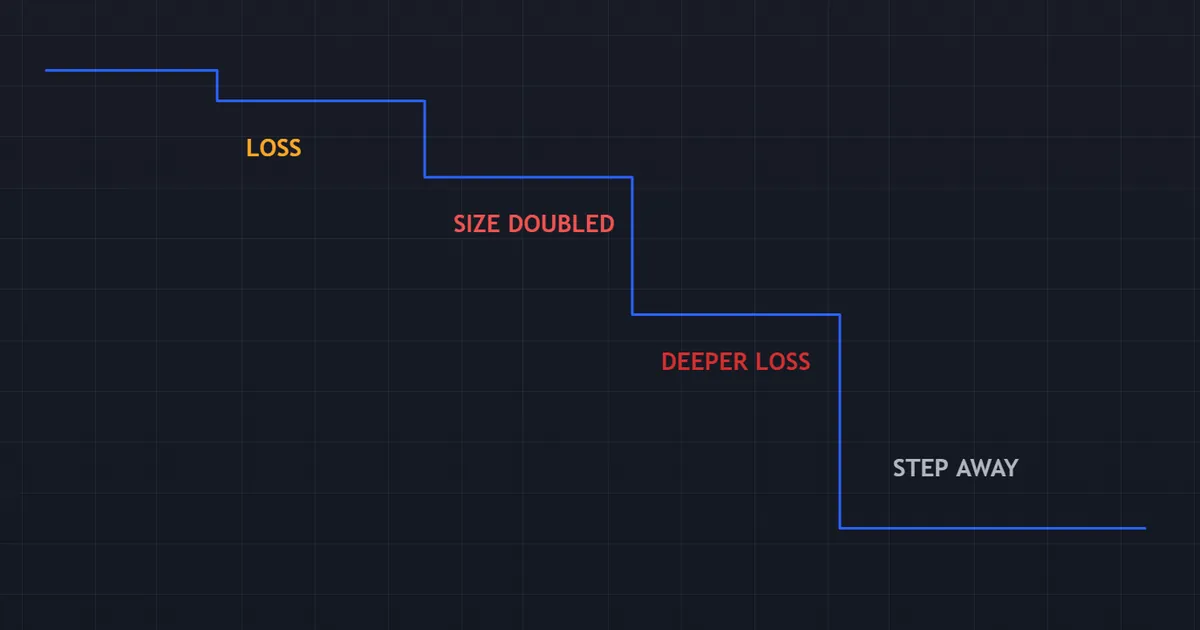
The equity panel below shows the shape to avoid. Size climbs after each loss, so the path steepens instead of flattening.
Signals Worth Taking Seriously
Watch for trades placed outside your session, sizes you cannot justify, and orders you cannot remember opening. Each one signals that the process has stopped running.
Watch the frequency too. Our guide to handling a losing streak explains why trade count usually rises before the account falls.
Deposits made to chase a loss belong on the same list. Adding money mid-drawdown converts a trading problem into a financial one.
Stepping Away Is a Valid Move
A week away costs you nothing that matters. Markets run every day, and the setups you miss are replaced by identical ones later.
Set the return conditions before you leave. A written plan, a reduced size and a clear head are reasonable requirements.
Tell somebody the date you plan to return. A break with no end point tends to become either a permanent exit or a quiet relapse within days.
Some situations need more than a break. If losses are affecting your sleep, your finances or your relationships, stepping away and seeking qualified professional support is the right move.
Separating Ordinary Drawdown From Real Trouble
Ordinary drawdowns look flat and boring. Our note on drawdown in trading shows the normal range for common strategies.
Trouble looks different. The curve accelerates downward, trade count rises, and the rules you wrote stop appearing in the journal at all.
Check the trade count first, since it moves earliest. A week with three times your usual number of trades is a behavioural signal long before it becomes a financial one.
Related Concepts to Study Next
Losses connect to two neighbouring topics. One explains why the reaction fires, and the other covers the sequencing of a recovery.
Read our overview of trading psychology for the wider behavioural picture. Then pair it with a flat sizing habit, because a fixed risk figure does more for loss tolerance than any mental technique.
FAQ
How do I stop taking trading losses personally?
Grade the decision instead of the outcome. If the setup matched your written definition, risk was standard and the exit followed the plan, the trade was correct whatever the result. Rule-following losses are a cost of running an edge, not a verdict on your ability.
How long should I wait after a losing trade?
Fifteen minutes suits most intraday styles, and the rest of the session after two consecutive losses. The exact figure matters less than writing it down in advance. A timer decides better than a trader with a fresh loss.
Should I reduce position size during a drawdown?
Yes, and the reduction should be automatic rather than discretionary. Halve your risk figure when you hit the weekly floor, then restore it after five clean sessions. That single rule keeps the deepest part of a drawdown at the smallest exposure.
How many losses in a row is normal?
It depends entirely on your strike rate. A strategy that wins forty percent of trades will see five consecutive losses regularly across a few hundred trades. Work out your own expected streak length before you judge a run as abnormal.
When should I stop trading altogether?
Step away when behaviour changes rather than when the balance falls. Trades outside your session, sizes you cannot justify and deposits made to chase a loss are all clear signals. If trading is affecting your sleep, finances or relationships, seek qualified professional support.
Can a losing period be fixed by changing strategy?
Sometimes, but rarely as fast as traders hope. Check the loss classification first, because rule-breaking losses point at process rather than strategy. Give any genuine strategy change at least thirty trades before you judge it. Results are not guaranteed; past performance is not indicative of future results.
External references
- For background on this concept, see Grief on Wikipedia.
- For broader market context, see Self-Serving Bias at Corporate Finance Institute.

About the author
Written by Dominic Walsh, a Forex trader and MT4/MT5 indicator, Expert Advisor and script developer. Every tool on forexmt4systems.com is tested on live charts before release and ships with ready-to-use compiled MT4 (.ex4) and MT5 (.ex5) files. Learn more about the trader and developer behind this site.
How we build, test and correct every tool: Editorial & Testing Policy. Trading carries risk; see the disclaimer.