
Ask what percentage of traders pass prop firm challenges and you will get a confident number from almost every source. Almost none of those numbers rests on data anyone can check.
This guide answers what percentage of traders pass prop firm challenges the honest way. It stays firm-neutral, it attributes every figure it cites, and it explains why the true share sits far lower than the marketing suggests.
Why a Precise Public Number Does Not Exist
No regulator counts prop challenge outcomes. No firm has to publish them, and no auditor signs them off.
So the figures floating around come from firms, blogs, and affiliate pages. Each one has a reason to shade the answer in a chosen direction.
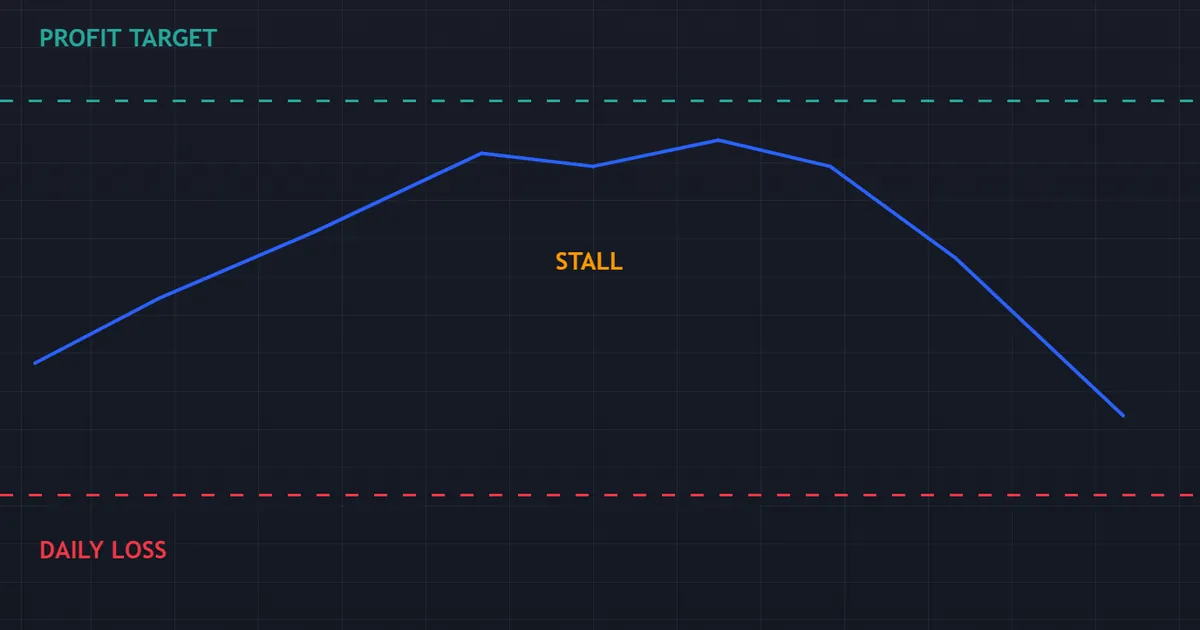
The chart above shows the shape of a typical failed attempt. Equity climbs for a while, stalls below the profit target, then slides back toward the loss limit.
Most attempts end somewhere on that path. Because the target and the limit pull in opposite ways, the run needs both a decent gain and a calm one.
Nobody Audits the Data
A pass rate is easy to state and hard to verify. The raw records sit inside a firm’s own systems.
So you cannot inspect the denominator. Because nobody outside knows how many accounts entered, any published rate rests on trust alone. Ask for the audit, and the trail runs cold.
Firms Publish What Suits Them
A firm chooses which figure to release and when. A high pass rate helps sales, while a low one signals a serious rule set.
So both directions get used, depending on the pitch. Because the number doubles as marketing, treat it as a claim rather than a measurement. Read it beside the rules, which are much harder to spin.
Definitions Move the Answer
Two firms can report the same activity and disagree wildly. One counts first attempts, another counts every attempt, and a third counts only accounts that traded.
So the wording changes the answer more than the trading does. Free retries, for example, lift a headline rate without changing a single trader’s skill. Always ask what the firm counted before you read the digits.
Who Gets Counted, and Who Vanishes
A rate needs a bottom number as well as a top one. That bottom number hides most of the argument.
Some buyers never place a trade, and others quit after one bad day. Leave them out, and the rate jumps. Include them, and it sinks. So the same records can yield two very different headlines.
What Percentage of Traders Pass Prop Firm Challenges, Honestly
Strip out the unsourced claims, and a thin layer of reported data remains. It all points the same way.
The large majority of people who buy an evaluation do not pass it. Fewer still reach a payout, and fewer again reach a second one.
What Reported Figures Show
Some firms have published pass rates in the single digits, and the trade press has carried headline claims of roughly one attempt in twenty. Those come from the firms themselves, so nobody has checked them.
The trade publication Finance Magnates also reported data from a prop-trading technology provider covering roughly three hundred thousand accounts. In that set, about seven percent of accounts reached a payout, and the average payout came to near four percent of the plan size. Later coverage from the same publication carried one firm founder’s estimate that only one or two percent of participants ever get paid.
How to Hold Those Numbers
Hold them loosely, and hold them as a floor for your caution. They come from interested parties, they cover different periods, and they count different things.
So no single figure deserves quoting as fact. Because every source points in the same direction, though, the honest summary is simple. Most people who pay for a challenge do not pass, and most of those who pass never build a run of payouts.
Why the Question Still Matters
A vague answer can still guide a decision. Knowing that most buyers fail changes how you approach the fee.
So treat the money as the cost of a test rather than an investment. Because the base rate runs against you, only pay what you can lose without pain. That framing keeps a bad run from becoming a bad year.
Passing Is Not the Same as Getting Paid
A pass unlocks the funded stage rather than the money. The drawdown floor follows you there, and the pressure changes shape.
So the pass rate overstates the odds of earning. Because a second filter waits after the first, the share of buyers who collect a payment sits well below the share who pass. Judge the model on payouts, not on passes.
Where the Funnel Narrows
Think of the path as a funnel with three throats. Each one removes a large slice of the people who entered.
Seeing the stages laid out beats memorising any percentage. The shape explains the outcome better than a single digit ever could.
The Funnel, Stage by Stage
Walk the stages in order, and watch the group shrink.
- Entry. A trader pays a fee and starts an evaluation on a simulated account.
- Profit target. The account must reach a set gain without touching any loss limit.
- Verification. Many programs add a second, gentler phase before funding.
- Funded stage. The trader now works under the same floor with real consequences.
- First payout. Minimum profit, minimum days and a review stand between profit and cash.
- Repeat payouts. Only a run of them shows a process rather than a lucky month.
Notice how the last two stages sit outside the pass-rate question entirely. Because most public figures stop at stage two, they flatter the model badly.
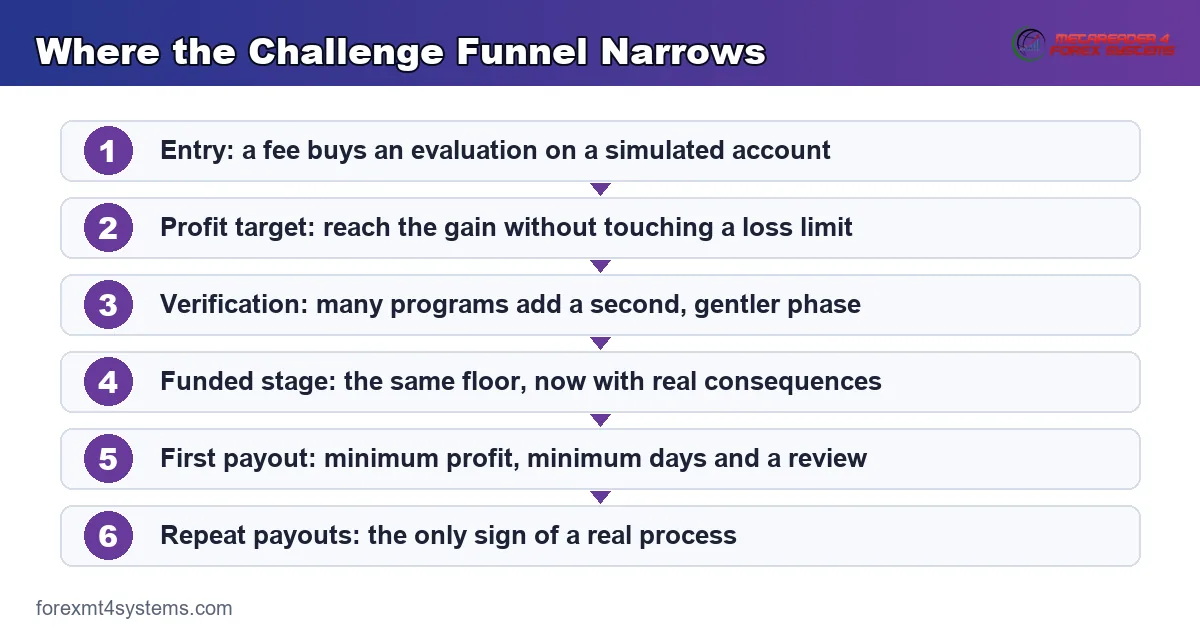
The flow graphic gathers those throats into one view. Pin it up, and the marketing numbers lose most of their power.
Why Each Stage Removes People
Every stage tests a different weakness. The target tests patience, the loss limit tests sizing, and the funded stage tests nerve.
So a trader can clear one throat and fail the next. Because the tests differ, a strong evaluation run predicts less about the funded stage than people expect. So treat each stage as a fresh exam.
Why the First Attempt Differs
A first attempt runs on nerves as much as on skill. The trader does not yet know how the rules feel in a live session.
So second attempts often go better, even with no change in method. Because familiarity removes a layer of panic, the same person can fail once and pass later. That effect alone muddies any headline rate.
What Actually Drives the Outcome
Your own result depends on a handful of choices, not on the published rate. Those choices sit almost entirely in your hands.
So the useful question changes shape. Rather than asking how many people pass, ask which habits separate the ones who do.
Position Size Against the Daily Limit
Oversizing ends more attempts than any other single habit. A trade sized for the profit target often breaches the daily limit on the way.
So size against the limit, never against the target. Because a modest risk per trade survives a losing streak, small size buys you the time the target needs. Our free prop firm position size calculator works the lot size back from a program’s own loss rules.
The Drawdown Type
A static floor stays put, while a trailing floor climbs with your equity. The trailing version ends far more accounts.
So read which type you bought. Because a rising floor shrinks your cushion after every winning trade, a giveback can breach it while the balance still looks healthy. To picture how far a loss run reaches, our drawdown calculator maps the arithmetic.
Minimum Trading Days
Many programs ask for a minimum number of trading days. That clause stops a single lucky session from passing you.
So it also creates a trap. Traders who hit the target early keep trading to fill the days, then give the gain back. Place small, low-risk trades instead, and protect the balance you earned.
Rule Literacy
Plenty of attempts die on a rule the trader never read. A weekend-hold clause or a news restriction ends the run without warning.
So read the whole rule book before you pay. Because the rules differ between programs, memory from a previous attempt misleads you. Write the key figures on a card, and keep it beside the screen.
Time Limits and Pace
Some evaluations run on a clock, while others give you unlimited time. The clock changes behaviour more than most traders expect.
So a deadline pushes people to size up near the end. Because that rush breaches limits, an untimed program suits a calm trader far better. Check the time rule before you plan your pace.
A Worked Case of a Passing Run
Numbers make the funnel concrete, so walk one clean case. This example shows the mechanics and predicts nothing about your own attempt.
Picture a fifty thousand dollar evaluation with an eight percent target, a five percent overall loss limit, and a two percent daily cap. You risk half a percent per trade, so a bad day of three losses costs one and a half percent.
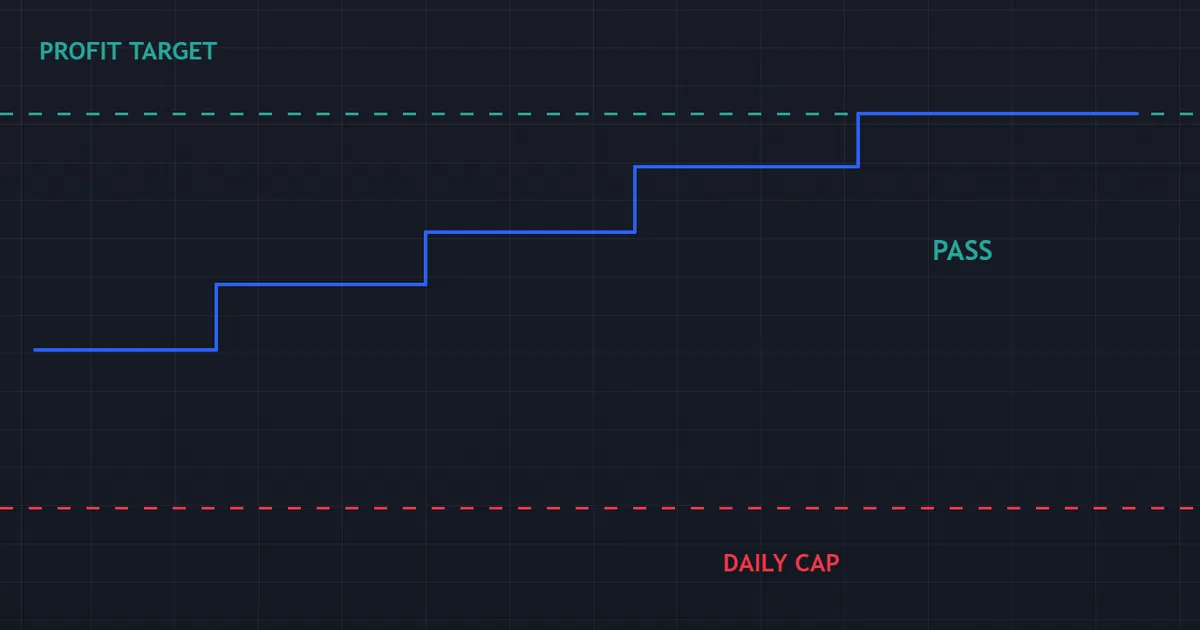
That sizing keeps you clear of the daily cap even on an ugly session. To reach the target you need a net gain of four thousand dollars, which at half a percent risk means a steady run of winners against losers over several weeks.
So the pass depends on patience, not on a burst. Because the loss limit gives you roughly ten losing trades of room, your sizing decides whether a rough patch ends the attempt or merely dents it.
The Same Run With Double the Size
Now risk one percent per trade instead. The target arrives twice as fast, and so does the danger.
Three losses in a day now cost three percent, which breaches the two percent cap outright. So the faster route ends the attempt on an ordinary bad day. That single comparison explains most failed challenges.
What the Case Does Not Show
The example assumes a steady edge and a calm trader. Neither assumption holds for most people who buy an evaluation.
So treat the arithmetic as a floor for your planning. Because slippage, news gaps and tilt all sit outside the model, a real attempt runs harder than the sums suggest.
Download the complete indicator database
Put these concepts on your charts. One email unlocks the full library of 1,380+ indicators with compiled MT4 and MT5 files, plus my TradingView scripts. No paywall, no spam, unsubscribe any time.
Get free access to my indicator database
One email unlocks 1,380+ free MT4, MT5 and TradingView indicators — the complete library. No single-tool download; you get the whole database.
Why the Rate Varies Between Programs
Two programs can produce very different outcomes from the same trader. The rule set does most of the work.
So comparing published rates across firms tells you little. Compare the rules instead, since they decide how much room you get.
Target and Drawdown Ratio
The ratio between the target and the loss limit sets the difficulty. A large target beside a tight limit demands a rare run.
So do the division before you buy. Because a target twice the size of your allowed loss needs a strong strike sequence, that ratio predicts your odds better than any advert. Favour programs where the two figures sit closer together.
One-Step and Two-Step Formats
A one-step evaluation funds you after a single phase. A two-step format adds a gentler second phase with a lower target.
So the formats fail people at different points. Because the second phase still carries the loss limit, a two-step route asks for stamina rather than speed. Pick the shape that suits your natural pace.
Instant-Funding Models
Some programs skip the evaluation and fund you at once. The rules then tighten at the payout stage instead.
So the filter moves rather than disappearing. Because these accounts often carry small drawdown allowances and strict consistency clauses, the share of buyers who get paid stays low. Read the payout terms with extra care here.
Futures and Forex Programs Differ
Futures-style programs often use a trailing floor tied to closed balance. Forex-style programs more often measure equity in real time.
So the same trade can breach at one and survive at the other. Because the measurement basis differs, a rate quoted for one market says nothing about the other. Read which basis your program uses.
Common Mistakes When Reading Pass Rates
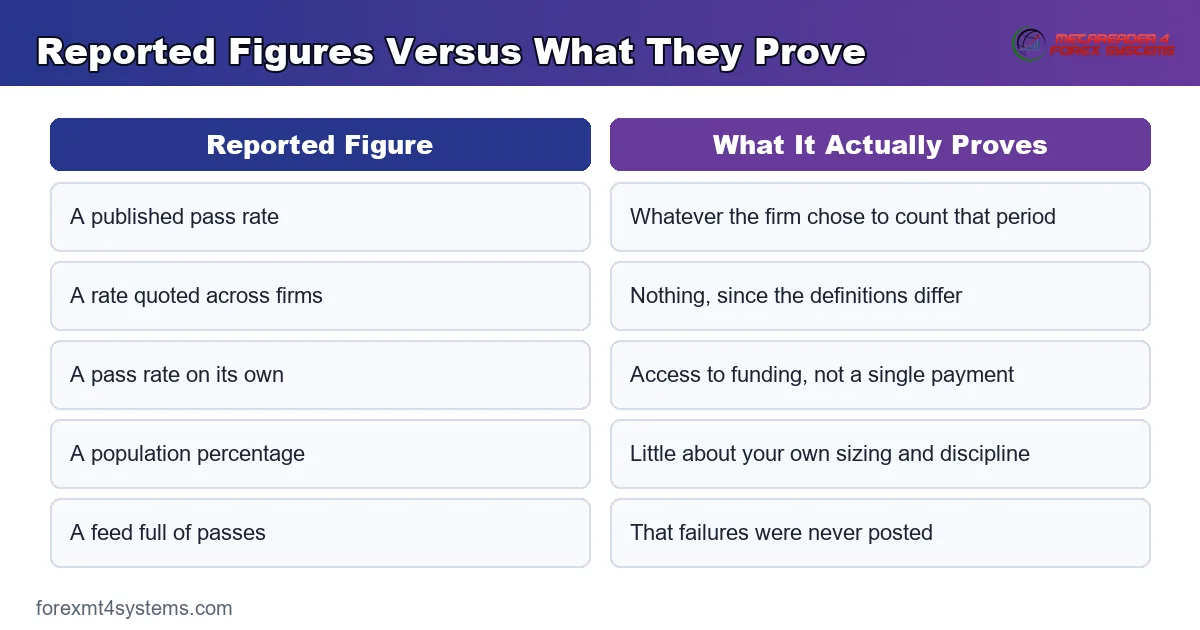
The numbers mislead people in a few predictable ways. The comparison graphic below sets a reported figure beside what it actually proves.
Treating a Firm’s Figure as Audited
A published rate carries no independent check. It describes whatever the firm chose to count. So read every figure as marketing until an auditor’s name appears beside it.
Comparing Rates Across Firms
Two rates built on different definitions cannot be compared. One may count retries, another only first attempts. So compare rule sets, which are written down and specific.
Confusing Passing With Earning
A pass unlocks a funded account and nothing more. The payout filter still waits beyond it. So judge any program by the share of buyers who collect money, not by the share who pass.
Assuming the Rate Applies to You
A population rate says nothing about one person. Your sizing, your rule literacy and your patience move your own odds far more. So work on those, and ignore the headline.
Reading Success Feeds as Evidence
Social media shows the passes and hides the failures. That filter makes any rate look generous. So discount what you see in a feed, since the losers post nothing.
Quoting a Rate as a Personal Forecast
A published figure describes a crowd, not a plan. Some traders use it to excuse a loss, and others to justify a gamble. So log your own attempts, and let your record replace the guesswork.
Buying a Cheap Attempt to Test Yourself
A low fee tempts traders into an unprepared run. Repeated attempts then cost real money. So prove the process on a demo account first, then pay once.
Pass-Rate Quick Reference
Keep this short list beside you whenever a figure catches your eye. Run through it before you pay for any evaluation.
- No audited, industry-wide pass rate exists for prop challenges.
- Published rates come from firms and count whatever the firm chose.
- Reported figures cluster low, and every source points the same way.
- The share of buyers who reach a payout sits below the share who pass.
- Repeat payouts, not passes, show whether a process exists.
- Your sizing against the daily limit moves your own odds most.
- The target-to-drawdown ratio predicts difficulty better than any advert.
Pitfalls and Edge Cases
A few wrinkles bend the clean picture, so keep them in view. The chart below shows an attempt that breaches the loss limit before the target arrives.
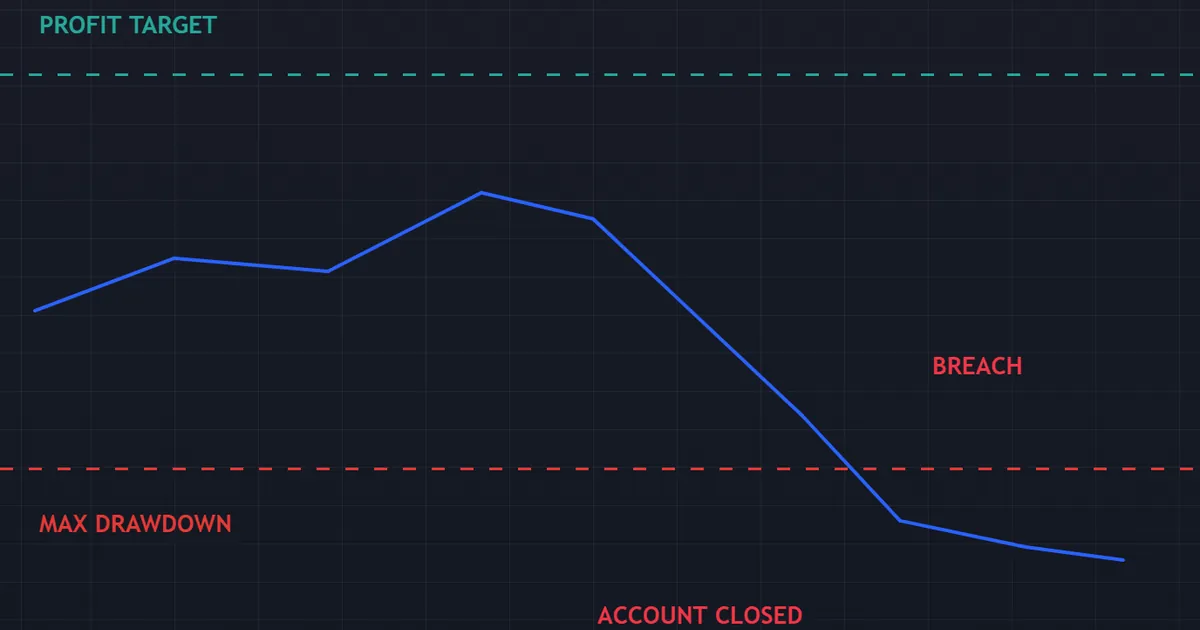
Picture the run from the trader’s side. Equity rises, the target starts to look close, and then a rushed session cuts through the floor. The fee goes with it, and the count resets to zero.
Free Retries Flatter a Rate
Some programs hand out a free second attempt. That policy lifts a headline pass rate without lifting anyone’s skill. So check whether a quoted figure counts attempts or people.
Cheap Fees Change Who Enters
A low entry price attracts casual buyers who never really try. Their failures drag the reported rate down. So a low published figure can reflect the customer mix rather than the difficulty.
Consistency Clauses Hide in the Funded Stage
A pass rate says nothing about consistency caps. Those clauses often bite later, at the first payout request. So read the funded-stage rules before you judge a program by its evaluation.
Bundles and Multiple Accounts
Traders who buy several accounts at once appear many times in the count. One method then passes or fails them all together. So a rate built on accounts can look very different from a rate built on people.
Rules Get Rewritten
Targets, limits and formats change, sometimes without much notice. So a rate published last year may describe a different product. Save the rule page on the day you buy, and keep your own copy.
Related Concepts to Study Next
The pass-rate question sits inside a wider picture, so a few neighbouring topics repay an hour of reading. Each one explains part of the funnel that decides your result.
Start with why traders fail prop firm challenges, then read our practical guide to passing a prop firm challenge. For the money question, see how much prop firm traders make, and for the model itself, see what a prop firm is or browse the full prop trading library. Because a loss run decides most attempts, pair it with our note on risk of ruin.
FAQ
What percentage of traders pass prop firm challenges?
No audited figure exists, so any precise number deserves suspicion. Firms have published rates in the single digits, and trade-press coverage has carried claims near one attempt in twenty. Every source points the same way, so the honest read is that most buyers do not pass.
Why can nobody verify these numbers?
The records sit inside each firm’s own systems, and no regulator or auditor reviews them. Firms also choose what to count, so retries and untraded accounts move the answer. Without a denominator you can inspect, a published rate remains a claim.
Is the payout rate lower than the pass rate?
Yes, and by a wide margin. Passing only unlocks the funded stage, where the same drawdown floor still applies. Reported data covering a large set of accounts showed a small single-digit share reaching a payout at all.
Which rule fails most attempts?
A drawdown rule, most often the daily loss limit, ends more attempts than a missed target. Traders size for the target and breach the limit on the way. So sizing against the limit is the single highest-value change you can make.
Do easier programs have higher pass rates?
Often, but the difference usually sits in the rules rather than in trader skill. A closer target-to-drawdown ratio, a longer time allowance or a free retry all lift a headline figure. So compare the rules, not the advertised rate.
Can I improve my own odds?
Yes, and the levers are unglamorous. Risk a small, fixed share per trade, read the whole rule book, plan around news, and stop trading once the target arrives. Those habits raise your chance without promising anything, since the market decides the rest. Results are not guaranteed; past performance is not indicative of future results.
External references
- For background on this concept, see Survivorship Bias on Wikipedia.
- For broader market context, see Survivorship Bias at Investopedia.

About the author
Written by Dominic Walsh, a Forex trader and MT4/MT5 indicator, Expert Advisor and script developer. Every tool on forexmt4systems.com is tested on live charts before release and ships with ready-to-use compiled MT4 (.ex4) and MT5 (.ex5) files. Learn more about the trader and developer behind this site.
How we build, test and correct every tool: Editorial & Testing Policy. Trading carries risk; see the disclaimer.