
Charts carry plenty of information before any indicator touches them. So a fair place to begin is the question itself: what is price action trading, and why do so many traders drift towards it after a few years of screen time?
The short answer is that it means reading raw bars for context, location and intent. This guide sets out the approach, the vocabulary it runs on, and the limits that come attached.
What Is Price Action Trading, in Plain Terms
Price action trading treats the bars themselves as the primary evidence. Everything else sits in a supporting role, or gets left off the chart entirely.
That does not make it an indicator-free religion. Plenty of traders in this camp keep a moving average on the chart for slope, or an average range reading for stop distance.

Above sits a bullish pin bar on USDCHF hourly bars, formed early on 28 July 2026. Its long lower wick reached 0.81866 before buyers took price straight back, and the bars that followed moved higher.
The Core Claim
Every indicator you have ever loaded takes price as its input. A moving average smooths closes, and an oscillator compares recent closes against older ones.
So no indicator can hold information the price series lacks. It can only repackage that series, usually with a lag attached.
Traders in this school take the observation seriously. If the raw bars hold everything, why not read the raw bars?
What the Approach Does Not Claim
Reading bars turns nobody into a forecaster. A rejection shows something that already happened, and it says nothing certain about the next hour.
Careful practitioners describe the method as a framing tool. It hands you a level, an invalidation price and a way to size the position, and that is the whole of it.
Anyone selling more than that has stopped describing the method. Our honest look at whether price action trading works takes the evidence side of the argument seriously.
The Vocabulary You Actually Need
Most of the confusion around this style comes from language rather than logic. Five terms carry almost all the weight.
- Swing high and swing low. A bar whose extreme sits above (or below) the bars on either side of it. These are the anchors everything else hangs from.
- Structure. The sequence those swings make. Higher highs with higher lows describe an uptrend; the mirror image describes a downtrend.
- Break of structure. A close beyond the last swing point in the opposite direction. It marks the moment the sequence changes character.
- Location. Where the current bar sits relative to levels that already mattered, such as a prior swing, a session extreme or a round number.
- Rejection. A bar that trades into a level and closes away from it, leaving a wick behind as the record of the attempt.
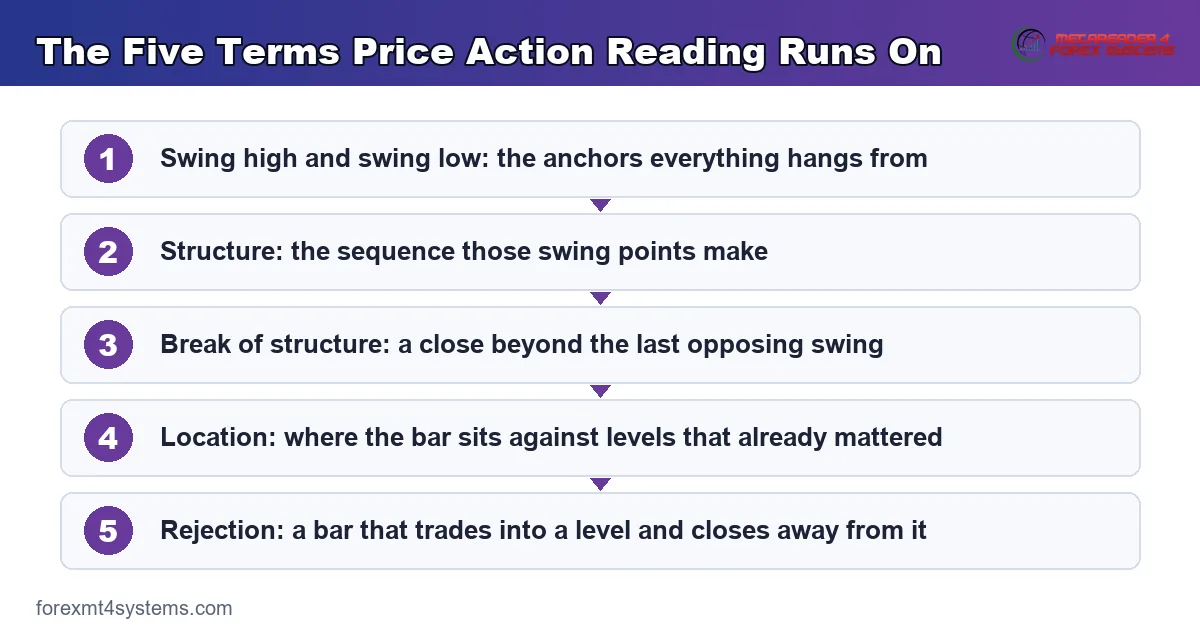
Learn those five and most price action writing becomes readable. Everything after them is dialect.
Why the Jargon Multiplies
Different schools rename the same five ideas. One calls a break of structure a market structure shift, and another calls the same close a change of character.
None of the renaming adds information. So when you meet a new term, ask which of the five it maps onto before you learn a new rule for it.
Bars, Bodies and Wicks
A candle records four numbers: open, high, low and close. Its body spans open to close, and its wicks reach out to the extremes.
Body size relative to range tells you how decisively the period ended. A large body means price closed near an extreme, while a small body inside a wide range means the period ended in a fight.
That single ratio does more work than most named patterns. Our guide to what a pin bar means unpacks the extreme version of it.
Impulse and Pullback
Markets rarely travel in a straight line. They push, pause, then push again, and the two phases look completely different on the chart.
An impulse covers ground quickly with large bodies and few overlapping bars. A pullback drifts back against that move with smaller bodies and heavy overlap.
Telling one from the other decides how you treat a level. A pullback into support invites a buy, while an impulse through the same support says the level lost.
Range and Trend
Two market states cover almost everything. In a trend, swings step in one direction and pullbacks stay shallow.
In a range, price rotates between two boundaries and neither side keeps control. Signals that work at range edges tend to fail badly in the middle of a trend, so naming the state first saves a lot of trouble.
Retest and Confluence
After a break, price often returns to the level it just cleared. Traders call that a retest, and it offers a second entry with a tighter invalidation.
Confluence simply means two reasons landing in the same place. A prior swing that also matches a round number carries more weight than either on its own, though stacking six reasons rarely beats stacking two.
How the Reading Works in Practice
Experienced readers work top down, and they work in a fixed order. Skipping a step is where most bad trades begin.
Step One: Location
Open the higher timeframe first and mark levels that already produced a reaction. Prior swing extremes, obvious ranges and the weekly open all qualify.
Then ignore everything happening away from those marks. A bar in the middle of a range describes very little, however tidy it looks.
Our explainer on candlestick patterns at support and resistance covers why the same bar means two different things in two different places.
Step Two: Structure
With levels marked, read the swing sequence into that area. Ask whether price arrived in a trend or drifted in sideways.
An impulsive arrival and a slow grind carry different messages. A slow drift into resistance leaves sellers plenty of room, while a violent push often runs into stops instead.
Step Three: The Bar
Only now does the individual candle matter. At a marked level, in a readable structure, a rejection bar becomes a trigger rather than a curiosity.
Notice the order. Location and structure filter, and the bar times the entry, so the bar is the least important of the three.
Step Four: The Invalidation Price
Before entry, write down the price that ends the idea. Usually it sits just beyond the extreme of the signal bar.
That number does two jobs at once. It defines your risk, and it lets you work out position size instead of guessing at it.
A Worked Example on the Four-Hour Chart
Theory reads well and settles nothing. Here is the same routine applied to a real bar.

The chart shows a bullish engulfing bar on USDCHF four-hour bars, formed in the London morning of 5 June 2026. Price dipped to 0.78724, below the previous bar’s low, then closed above its high, and the bars afterwards followed through.
Reading It in Order
Location came first. Price had returned to an area that already halted a decline, so the zone had a history rather than a fresh line drawn in hope.
Structure came second. The pullback into that area unfolded in overlapping bars, which is what a correction usually looks like.
Only then did the bar matter. Sellers took price to a new low within the session and lost it inside four hours, and the close above the prior high recorded that failure.
What the Trade Plan Looked Like
Entry sat at or just above the close of the engulfing bar. Invalidation sat below its low, because a move through there would say the sellers were not finished.
Target selection stayed mechanical. The next swing high above offered the first objective, and anything beyond that became a decision for later.
Notice what the plan never included. Nobody predicted a destination, and nobody claimed the setup had to work.
Why an Engulfing Bar Says More Than a Doji
An engulfing bar contains a failed excursion. Price went one way, ran out of buyers or sellers, and finished at the other end of the range.
A doji records indecision instead, which is a weaker message at any level. Our note on what an engulfing candle means goes deeper into the mechanics.
What Would Have Cancelled the Idea
Setting the failure condition first keeps the reading honest. A four-hour close back beneath 0.78724 would have ended this one outright.
That is a specific price, not a feeling. Traders who define it after entry usually end up widening it instead.
Where This Sits Alongside Indicators
Purists claim the chart should stay bare. In practice most working traders land somewhere in the middle.
Indicators as Context, Not Triggers
A long moving average answers one question quickly: which way has this market leaned recently? Reading that from bare bars takes longer and produces the same answer.
So a slope line earns its space. Using the same line as an entry trigger is where the trouble starts, because a crossing tells you nothing about location.
Volatility Readings Do Real Work
Stop distance needs a number, and eyeballing it produces inconsistent risk. An average range reading gives you a repeatable measure of how far this market normally travels.
That is arithmetic rather than prediction. Our guide to what ATR means in trading covers the calculation and its sensible uses.
The Chart-Clutter Test
Ask what each tool changes about your decision. If removing it would not alter a single entry, remove it and enjoy the extra screen space.
Most charts fail that test badly. Three indicators saying roughly the same thing feel like confirmation, and they only repeat one message louder.
What Reading Bars Cannot Show You
Honesty about the blind spots matters as much as the method. Three things sit outside the chart entirely.
Orders Nobody Has Placed Yet
Bars record completed transactions. They say nothing about the size waiting above or below, so a level holds only until somebody decides otherwise.
The Calendar
A tidy setup running into a central bank decision faces a different market within minutes. Check our economic calendar before committing, because timing beats hindsight here.
Your Own Costs
Spread and commission never appear on the candles. A setup with a fifteen-pip objective and a two-pip spread starts a long way behind, and the chart hides that entirely.
Download the complete indicator database
Put these concepts on your charts. One email unlocks the full library of 1,380+ indicators with compiled MT4 and MT5 files, plus my TradingView scripts. No paywall, no spam, unsubscribe any time.
Get free access to my indicator database
One email unlocks 1,380+ free MT4, MT5 and TradingView indicators — the complete library. No single-tool download; you get the whole database.
Common Mistakes and the Fixes
Six habits account for most of the damage. Each one has a fix that costs nothing.

Trading the Bar Without the Level
A rejection in open space is just a bar. Mark your levels before you scan for signals, and skip everything that forms away from them.
Entering Before the Close
A wick through a level proves an attempt and nothing more. Wait for the bar to finish, because half a candle is not a signal.
Adding Timeframes Until One Agrees
Flicking through five charts until one supports your view is not analysis. Pick two timeframes in advance and stay with them.
Redrawing Levels Mid-Trade
Moving a line to keep a losing position alive removes the only objective reference you had. Fix the level once, then let price argue with it.
Calling Every Small Wick a Rejection
Wicks appear on almost every bar. Set a tolerance in advance, such as a wick worth at least two thirds of the range, and apply it consistently.
Sizing by Habit
Invalidation distance changes from setup to setup, so a fixed lot size changes your risk without telling you. Run the numbers through our position size calculator instead.
Quick Reference: Reading a Chart in Order
Keep this table beside the platform for the first month. Working through it in sequence prevents most rushed entries.
| Step | Question to ask | Skip the trade when |
|---|---|---|
| Location | Did this area produce a reaction before? | The bar sits in open space |
| Structure | Trend or range, and which way did price arrive? | Swings overlap with no readable sequence |
| Bar | Does the close reject the level clearly? | The body ends in the middle of the range |
| Invalidation | Which price ends the idea? | No sensible level sits within reach |
| Size | What lot keeps the loss small? | Correct size falls below your minimum |
Choosing Your Two Timeframes
Almost every workable routine runs on a pair of charts. One supplies context, and the other supplies timing.
The Usual Pairings
Daily for context with four-hour for timing suits traders who check charts twice a day. Four-hour with hourly suits anyone watching a session properly.
Roughly a four-to-one ratio works best. Charts closer together repeat each other, while charts further apart leave a gap you cannot see across.
Why Two and Not Five
Each extra chart adds a chance to find agreement somewhere. That feels like thoroughness and behaves like bias, since a determined trader can always locate a supportive timeframe.
Two charts force a decision. Either the context supports the setup or it does not, and there is no third opinion to break the tie.
Fix the Pair Before You Trade
Write the two timeframes into your plan and leave them alone for a month. Switching after a loss leaves your records describing several methods rather than one.
Our walkthrough of multi-timeframe analysis covers how to keep the two views in step without doubling the work.
When the Reading Fails
The rejection failed: price broke the bar’s own extreme instead of turning. That sentence describes the chart below, and it describes a large share of the signals you will ever mark.

What Happened on the Daily Chart
The image shows a bullish pin bar on EURJPY daily bars in late April 2026. Buyers rejected the low at 186.072 inside that session, and the long lower wick recorded the fight properly.
Afterwards price traded straight through 186.072. Nothing about the reading was sloppy, and the outcome still went the other way.
Why That Matters More Than the Winners
Breaking the signal bar’s own extreme is the cleanest possible invalidation. It removes any argument about whether the idea is still alive.
So a failure like this one costs a known amount. Traders who never define that price in advance turn the same bar into an open-ended loss.
What the Failed Bar Left Behind
A broken level does not stop mattering. Buyers defended 186.072 once, so the price where they gave up becomes a reference for the other side.
Traders who log failures tend to notice that pattern. The level that failed as support frequently caps the next attempt higher, which turns a losing observation into a useful one.
The Lesson to Take
Rejections fail regularly, and no reading style changes that. Our study of what an inside bar means makes the same point about compression bars.
Plan around failure rather than against it. A method that survives being wrong repeatedly is worth more than one that needs to be right.
Related Concepts Worth Reading Next
Two directions extend this article naturally. Both add depth rather than new terminology.
The Levels Themselves
Location does the heavy lifting, so study levels before you study bars. Our guide to support and resistance covers how to mark them without cluttering the chart.
A Structured Way to Learn It
Reading takes practice, and practice needs a loop. Our study plan for learning price action trading lays out a schedule with a review built into it.
Tools That Mark the Bars for You
Some traders prefer an alert rather than a manual scan. Our price action indicators archive collects tools that flag bars mechanically, and the judgement still belongs to you.
Building the Habit
Knowing the vocabulary changes nothing on its own. A short weekly routine converts it into behaviour.
Mark Levels Before the Week Opens
Set aside twenty minutes on Sunday. Mark the previous weekly extremes, the round numbers nearby and the last obvious swing on each pair you follow.
Then look for bars only near those marks. Doing it in that order removes most of the noise before you ever see it.
Screenshot Every Signal
Capture each bar you mark, before the outcome exists. Store the level, the invalidation price and the date alongside it.
Our free trade journal keeps those records in order. Memory will not do the job, because it quietly discards the boring failures.
Review Monthly, Change One Thing
Sort the screenshots by location quality once a month. Signals at marked levels usually behave differently from signals in open space, and the split tells you where to focus.
Then adjust a single rule and leave the rest alone. Changing three things at once teaches you nothing about which one mattered.
Keep the Language Careful
Watch how you describe a setup to yourself. Saying a bar shows a rejection keeps you honest, while saying it signals a reversal quietly commits you to an outcome.
Wording drives expectation, and expectation drives how long you sit in a losing position. Precise language costs nothing and saves real money.
FAQ
Is price action trading better than using indicators?
Neither approach wins on principle. Indicators repackage price with a lag, while raw bars ask more of your judgement and give you less structure to lean on. Many traders end up with a small number of indicators for context and their own reading for timing, which is a reasonable place to land.
Which timeframe suits price action reading best?
Higher timeframes carry cleaner information, because each bar summarises more activity. Daily and four-hour charts filter noise well, and hourly charts work if you mark levels from above first. Below fifteen minutes the bars get noisy and costs start to matter more than the reading.
How many patterns do I need to learn?
Two or three, honestly. A rejection bar, an engulfing bar and an inside bar cover most of what a chart offers. Adding a dozen named shapes on top adds vocabulary rather than skill, and it usually slows the decision down.
Can I trade price action without a stop loss?
You can, and the arithmetic argues against it. This approach hands you an obvious invalidation price, so declining to use it throws away the method’s clearest advantage. Our note on how to use a stop loss covers the placement details.
What is the difference between price action and naked trading?
Mostly marketing. Naked trading usually means a completely bare chart, while most price action traders keep one or two context tools loaded. The reading itself is identical, so treat the labels as house style rather than separate methods.
Does price action work on every market?
The reading transfers, and the behaviour does not. Bars form the same way on gold, indices and currency pairs, but liquidity, session hours and gap behaviour differ enough to change how levels hold. Study one market properly before you spread across several.
How long does it take to read charts confidently?
Longer than most courses suggest, and the honest measure is occurrences rather than months. A few hundred logged setups with real notes teach more than a year of casual watching. Track your own records, judge the process over a long run rather than any single trade, and adjust slowly. Results are not guaranteed; past performance is not indicative of future results.
External references
- For background on this concept, see Range at BabyPips Forexpedia.
- For broader market context, see Confirmation at Investopedia.

About the author
Written by Dominic Walsh, a Forex trader and MT4/MT5 indicator, Expert Advisor and script developer. Every tool on forexmt4systems.com is tested on live charts before release and ships with ready-to-use compiled MT4 (.ex4) and MT5 (.ex5) files. Learn more about the trader and developer behind this site.
How we build, test and correct every tool: Editorial & Testing Policy. Trading carries risk; see the disclaimer.